* Realizado no Laboratório de Avaliação Motora, Universidade Federal de Juiz de Fora. Apresentado no Simpósio Internacional de Ciências do Esporte 2003. Apoiado pelo CNPq com bolsa de iniciação científica para o aluno Leandro Nogueira Dutra.
1. Laboratório de Avaliação Motora, Universidade Federal de Juiz de Fora. 2. Universidade Salgado de Oliveira, Campus Juiz de Fora.
3. Faculdade Estácio de Sá, Campus Juiz de Fora. Approved in 17/ 10/06.
Correspondence to: Leandro Nogueira Dutra, Rua Padre Matias, 49 / 301, Morro da Glória – 36035140 – Juiz de Fora, MG.
E-mail: leandro-dutra@nextwave.com.br
Estimation of the gait energy expenditure
*
Leandro Nogueira Dutra1, Vinicius Oliveira Damasceno1,2,3, André Calil Silva1,
Jeferson Macedo Vianna1, José Marques Novo Junior1 and Jorge Roberto Perrout Lima1
O
RIGINALA
RTICLEKeywords: Perceived exertion. Heart rate monitor. Oxygen consumption. Gait. ENGLISH VERSION
ABSTRACT
The aims of this study were: 1) to propose predictive equations for gait energy expenditure (GEE) of young individuals in three sit-uations: a) when the identification of the gait velocity is possible; b) when heart rate (HR) monitoring is possible; and c) when nei-ther the velocity identification nor the HR monitoring is possible; and 2) to validate the GEE made by the HR Polar M71® monitor.
Thirty individuals (16 males, 22.7 ± 2.6 years and 14 female, 22.1 ± 2.1 years), non-athletes, physical education students were in-structed to walk on the treadmill with 1% inclination, in self-select-ed low, moderate and high intensity velocities, during 6 minutes in each velocity. The VO2, measured by the Aerosport Metabolic An-alyzer Teem 100, HR and GEE estimated by the monitor, were reg-istered in the last 2 minutes of each load. It was concluded that the best GEE prediction is done with the use of the gait velocity and the individual’s body weight. HR for prediction of GEE should be accompanied by the gender and rest HR. The perceived exer-tion scale proposed in this study should be utilized only when it is not possible to register the velocity or the HR. The use of other scales of perceived exertion is encouraged. The HR Polar M71 monitor is a valid instrument for GEE estimation, with the limita-tion that is necessary that HR exceeds 100 bpm. Its precision is enhanced at high intensity gait.
INTRODUCTION
The importance of physical activity in people’s daily lives has been demonstrated over the last decades. Among other objectives, it is practiced with the aim to keep good health and prevent diseas-es. Regular physical activity in the prevention of diseases and pmature deaths, as well as in maintenance of quality of life has re-cently received recognition as a target of public health(1). Among
the benefits from regular physical activity, decrease of the risk of development of cardiovascular diseases, diabetes, hypertension, among others, can be mentioned. Physical activity contributes to the general strengthening of muscles, bones and joints and also helps to control body weight(1-10). It is worth mentioning as well the
role of the physical activity in the prevention and treatment of obe-sity which is the excessive accumulation of adipose tissue in the body(11). In Brazil, data from the National Institute of Eating and
Nutrition showed that 32% of the results presented some degree of surplus weight(12).
Restriction of caloric intake and increase of the energetic cost through exercise are effective ways for body fat reduction as well
as for normalization of blood pressure and blood lipidic profile(13).
Walking is the most popular exercise and therefore, very used in programs of weight control and reduction of risk factors of coro-nary disease(14-16). Besides intensity and duration, in some cases, it
is also important to quantify the caloric cost caused by the gait for its prescription and control. Small benefits can be reached in activ-ities in which the energetic cost is of at least 150 daily kcal(10).
When the aim of the gait practice is the reduction of body weight, the energetic cost is an important parameter to be used by the physical education professionals in its prescription.
The amount of energy expenditure in different activities varies with the intensity as well as the kind of exercise(1,11). However,
there are some individual variations due to differences in the level of activity, age, sex, size weight and body composition which jus-tify the existence of many methods for measurement and estima-tion of the exercise energetic cost. In order to measure the ener-getic cost, indirect calorimetry by the measurement of the oxygen uptake is usually used; however, such method depends on costly procedures which restrict its use almost exclusively to laboratory environments and research situations. In field situations, where the measurement of the gait energetic expenditure (GEE) is not very viable, it is usually estimated.
According to Di Prampero(17), the first trials to describe the
hu-man locomotion were dedicated to quantify the GEE and occurred in the second half of the XIX century. The values registered at that time varied from 0.32 and 0.51 kcal.kg-1.km-1 for velocities between
3.2 and 4.8 km.h-1 – values surprisingly close to the ones currently
found. For Di Prampero(17), the energetic expenditure of the
hu-man locomotion above rest levels is function of the velocity multi-plied by a factor which varies according to a kind of dislocation as well as environmental conditions, such as air resistance. The Amer-ican College of Sports Medicine(18) proposed that for the GEE
esti-mation on flat surface, the rest cost of 3.5 mlO2.kg-1.min-1 (0.0175
kcal.kg-1.min-1) is considered and 0.1 mlO
2.kg-1.m.min-1 (0.0005
kcal.kg-1.m.min-1) for the horizontal velocity.
In many field situations, it is not possible to measure the com-pleted distance in the gait, making hence, the use of GEE in rela-tion to the velocity predicrela-tion equarela-tions impossible. In these situa-tions, heart rate (HR) monitors, accelerometers, pedometers, compendiums and so forth can be used(19-22). The heart rate (HR)
measurement has been widely used in the field to estimate the energetic cost of the physical activity, due to its practicality, espe-cially with the popularization of the HR monitors as well as the strong correlation that it has with the energetic cost during dynam-ic exercise whdynam-ich involves large muscular mass(23-25). Currently, HR
monitors such as the ones by Polar, series M and S, which have among their functions the estimation of the energetic cost of the physical activity are available in the market. Nevertheless, even with their easy use, their acquisition especially for large groups is still costly. Therefore, the development of a GEE prediction equa-tion which does not use the velocity or the HR as independent variables is justified.
individu-als and 2) validation of the GEE estimation performed by the Polar M71® heart rate monitor also in young individuals. Three situations
have been considered for the first aim: 1) when the velocity is possible to be identified; 2) when the HR monitoring is possible; and 3) when neither the velocity identification nor the Hr monitor-ing is possible.
MATERIAL AND METHODS
Sample – 30 young Physical Education college students, non-athletes were evaluated (16 males and 14 females). The sample characteristics are on table 1.
Procedures – Initially, after the methodology has been clarified, the subjects signed a free and clarified consent form. Afterwards, a questionnaire was applied in order to have the physical activity level evaluated (PAL) in a 0-7 point scale(26) and the anthropometric
measurements were taken as well. In order to have the weight checked a Filizola electronic scale was used. The individuals were bare feet and wearing the least garment as possible. Height mea-surement was performed in stadiometers attached to the wall. The Jackson, Pollock and Ward(27) and Jackson and Pollock(28) equations
have been used for body composition estimation from the skin-folds thickness, measured with the Lange compass. After anthro-pometry, while the individuals remained in supine position for 10 minutes, rest heart rate (HRr) was registered by the Polar M71®
monitor.
After the initial procedures, each individual was told to walk on the ergometric treadmill with 1% of inclination, at low, moderate and high intensities, at self-selected velocities, during 6 min at each intensity. The GEE, measured by the Teem 100 Metabolic Analyz-er by AAnalyz-erosport, as well as the HR and GEE estimated by the HR monitor, were registered in the two last minutes of each load.
Statistical treatment – Description of the sample as well as the results obtained during the gait was conducted through mean and standard deviation. In order to describe the correlation among the studies’ variables, the Pearson correlation coefficient was used. The identification of the GEE prediction equations was performed by multiple regression with progressive inclusion of the indepen-dent variables using the Statistica 6.0 program. The t-stuindepen-dent test for paired data was used for comparison of the measured GEE values estimated by the HR monitor. The significance level estab-lished was P < 0.05. In order to obtain the comparison of the re-gression equations, the correlation and the estimation standard error (ESE) which is the square root of the means of the residue squares (estimated predicted value).
RESULTS
The studied individuals were young (age mean of 22.7 ± 2.6 years for males and 22.1 ± 2.1 for females), with fat percentage
within the limits considered normal and physical activity level of 4.0 ± 2.0 for males and 4.8 ± 2.2 for females in a 0-7 points scale, according to what is shown in table 1.
TABLE 1
Characteristics of the studied sample
Male (N = 16) Female (N = 14)
Mean Standard deviation Mean Standard deviation
Age (years) 022.7 2.6 022.1 2.1
Weight (kg) 069.4 6.5 058.3 7.6
Height (cm) 178.0 7.3 164.8 6.7
PAL (points 0-7) 004.0 2.0 004.8 2.2
Fat (%) 008.1 3.4 021.5 3.8
HRr (bpm) 057.5 7.9 063.8 6.3
TABLE 2
Velocity, heart rate and energetic expenditure by gait intensity of the male group
Intensity Velocity Heart rate GEE Teem 100 GEE Polar (km / h) (bpm) (kcal) (kcal)
Mean SD Mean SD Mean SD Mean SD
Low 4.3 0.5 087.7 09.4 3.4 0.9 – – (N = 0)
Moderate 5.7 0.5 100.1 10.2 4.8 1.2 6.5 1.2(N = 5)
High 7.4 0.5 130.3 14.4 8.4 2.2 9.5 2.2(N = 14)
TABLE 3
Velocity, heart rate and energetic expenditure per gait intensity of the female group
Intensity Velocity Heart rate GEE Teem 100 GEE Polar (km / h) (bpm) (kcal) (kcal)
Mean SD Mean SD Mean SD Mean SD
Low 4.0 0.3 101.0 09.3 3.4 0.5 2.9 1.5(N = 9)
Moderate 5.4 0.5 116.8 08.9 4.2 0.6 3.9 0.5(N = 14)
High 6.7 0.7 145.6 17.1 6.2 1.4 6.2 1.6(N = 14)
Figure 1 – Mean, Standard deviation and 1.96*velocity, heart rate and measured (GEE) and estimated by the monitor (Polar) gait energetic expenditure standard deviation, in the low (1), moderate (2) and high intensities (3). Grouped male and female data.
The velocities self-selected by the individuals, the HR values reached at each intensity and the GEE, measured and estimated by the monitor, are presented in tables 2 and 3 in figure 1. Since the monitor estimates the energetic expenditure only for HR high-er than 100 bpm, the GEE cannot be estimated for all individuals of the sample in all intensities, especially in the lowest ones. The t-Student test showed that there is not significant difference be-tween the measurements taken by the Teem 100 and the Polar M71® in any of the intensities. The comparisons in the low and
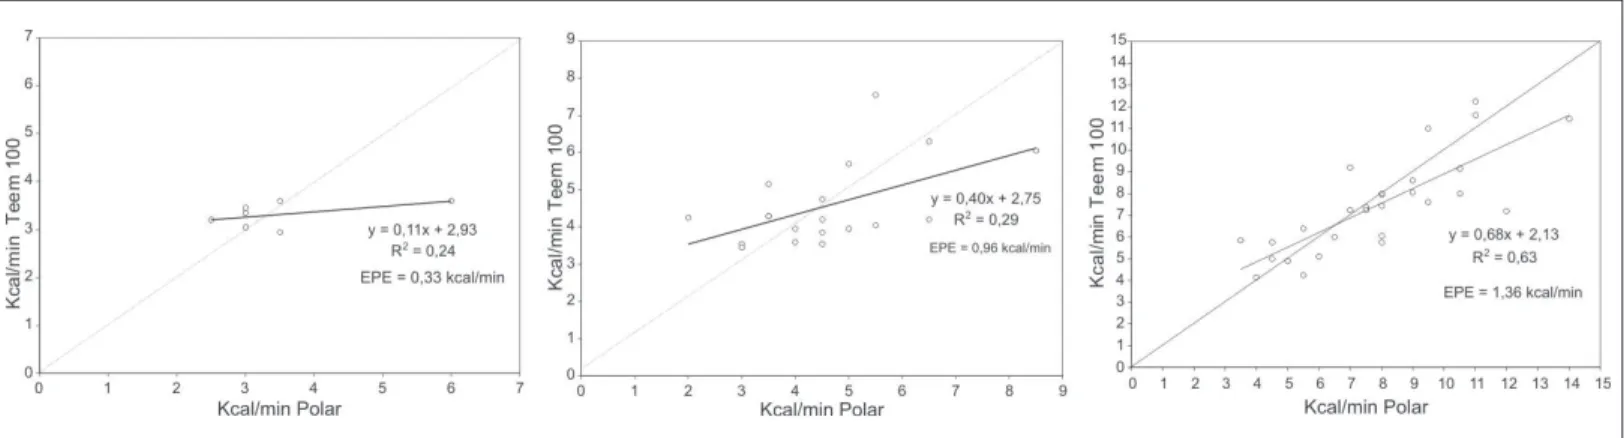
intensities some subjects did not reach the minimum HR of 100 bpm, needed for the GEE monitor estimation. Figure 3 shows the relationship between GEE measured and estimated, arranging the female and male groups in the three intensities. It is observed that the regression line is closer to the identity line as the gait intensity increases. Concerning the ESE values, in percentage terms, they were at the order of 10. 23 and 21% of the GEE mean in the inten-sity.
Table 4 shows the correlations among the studies variables. Only the velocity and the HR have significant correlation with the GEE. In figure 2, the following ratios are represented: A) HR x velocity, B) GEE X velocity C) GEE x Velocity. It is observed that, concerning the HR, the square adjustment (R2 = 0.58; ESE = 14.8 bpm) was
slightly better than the linear one (R2 = 0.54; ESE = 15.6). The
same fact has occurred concerning the GEE, whose square adjust-ment (R2 = 0.75; ESE = 0.87 kcal/min) was slightly higher to the
linear one (R2 = 0.72; ESE = 0.91 kcal/min). However, since the
differences between adjustments quality are relatively low, it is possible to estimate the GEE through linear equations, with no
important estimation errors. Since the HR and GEE have the same behavior concerning velocity, they keep a linear ratio between each other.
The prediction equations of the gait energetic expenditure (ta-ble 5) were divided in four groups: 1) equations in which the gait velocity is used; 2) equation in which the HR is used; 3) equations in which the perceived effort exertion is used; and 4) with use of all variables from the study. In the four groups, the equations have been arranged from the simplest (lowest number of variables) to the most complex (highest number of variables), according to
re-TABLE 4
Correlation matrix among the study’s variables
1 2 3 4 5 6 7 8 9
1 – Age 1.00
2 – Weight –0.25 1.00 3 – Height –0.29 0.83 1.00 4 – PAL –0.30 0.05 –0.08 1.00 5 – F% –0.14 –0.50 –0.72 0.29 1.00 6 – HRr –0.16 –0.18 –0.31 0.04 0.42 1.00 7 – Velocity 0.08 –0.01 0.04 0.08 –0.10 –0.07 1.00
8 – HR –0.16 –0.20 –0.28 0.16 0.40 0.41 0.74 1.00 9 – GEE –0.06 0.20 0.16 0.14 –0.10 –0.08 0.85 0.69 1.00
Significant correlations (P < 0.5) in bold.
TABLE 5
Prediction equations of the gait energetic expenditure
Num Equation R2 ESE
Using gait velocity
A1 Kcal/min = 1.22V – 1.98 0.74 0.91
A2 Kcal/min = 1.22V + 0.04P – 4.74 0.78 0.84 A3 Kcal/min = 1.24V + 0.06P + 0.03F% – 6.09 0.79 0.82
Using heart rate
B1 Kcal/min = 0.05HR – 1.08 0.48 1.30
B2 Kcal/min = 0.07HR – 1.64 (M/F) + 162.57 0.65 1.07 B3 Kcal/min = 0.07HR – 1.27 (M/F) – 0.08HRr + 129.36 0.73 0.94
Using effort intensity exertion
C1 Kcal/min = –1.06 (LMH) + 113.46 0.23 1.56 C2 Kcal/min = –1.11 (LMH) + 0.05P – 115.27 0.30 1.50 C3 Kcal/min = –1.12 (LMH) + 0.05P + 0.12PAL – 115.26 0.32 1.49
Using all independent variables
D1 Kcal/min = 1.22V – 1.98 0.74 0.91
D2 Kcal/min = 1.22V + 0.04P – 4.74 0.78 0.84 D3 Kcal/min = 1.07V + 0.05P – 0.40 (LMH) + 36.67 0.79 0.82
V = Gait velocity (km/h); W = Body Weight (kg); HRr = Rest heart rate (bpm); M/F = Male (100) and female genders (101); LMH = Low (101), Moderate (102) and High (103) perceived intensity exer-tion; HR = Gait heart rate (bpm); PAL = Physical activity level (0 – 7 ); F% = Body fat percentage.
sults derived from the multiple regression process with progres-sive inclusion (forward stepwise). It is observed in group D, in which all variables are inserted as independent variables in the multiple regression, that the A1 and A2 equations are repeated, showing that, even in a wide number of variables, velocity and body weight are the best GEE predictors.
DISCUSSION
According to Di Prampero(17), from the middle of the XIX century
the GEE has been studied and its best predictor is the gait velocity, followed by the individual’s weight. In mechanical matters, this ratio would be predictable, once velocity and weight determine the generated mechanical power, which in return, determines the metabolic power needed to perform the task. Currently, strategies relatively accurate for GEE estimation which use as independent variables the gait velocity and the individual’s weight are
avail-able(1,18). Even considering the convincing knowledge on this field,
studies for GEE estimation are still justified.
The determination of the gait velocity is actually a simple calcu-lation which involves the space derivative (completed distance) in relation to time. Nevertheless, in situations in which the gait is usually performed, the itinerary distance measurement is not via-ble. People walk in streets of the neighborhood where they live, in parks, irregular distances and other places with no completed dis-tance marks. For these cases, when the GEE estimation is intend-ed, it is necessary to have the estimation performed from other independent variables. Due to its strong correlation with the oxy-gen uptake, the HR is most chosen variable in most cases. The popularization of the Hr monitors occurred over the last years has made these devices more accessible and their use during the gait has been spread. The technological development has loaded the HR monitors with functions which allow many calculations, among them the energetic expenditure.
Despite the relative popularization of the HR monitors, their use is restricted to few subjects who practice physical activity. Further studies on other ways of estimating the GEE which are not costly such as accelerometers, GPS equipment and so on are needed. The use of variables of easy measurement would be recommend-ed. The perceived exertion effort is one interesting variable for the GEE estimation due to the easiness to obtain it – there is no need of any equipment – besides its proved correlation with the HR(29).
This study was conducted in order to test the GEE estimation validity performed by the Polar M71 HR monitor as well as to study other possibilities of estimation with the use of variables of easy measurement. Physically active young adults, from both genders participated in the study. The sample choice for the current stage of the proposal is suitable. The inclusion of other variables such as age, body weight and physical conditioning level should be includ-ed in future studies in which wider breadth of results’ generaliza-tion is intended.
The results obtained in the study have evidenced its importance and validity of the prediction functions. The GEE values found are according to classic studies of the field(25). The ratio between
ener-getic expenditure and gait velocity was not linear, as has been re-ported in the literature(30). Moreover, the mean values found for
the GEE are close to the ones predicted by the ACSM equation(18).
The studied subjects were able to easily select gait velocities ac-cording to the proposed intensity (low, moderate and high). The capacity of discrimination of the gait intensity was evidenced due to the finding of significant difference (P < 0.05) between the mean velocities grouped by intensity and also due to the velocities dis-persion of the same intensity was small, suggesting hence that there is a certain similarity in the velocity in which people walk. The fact that people select similar velocities when asked to walk in a given intensity causes a correlation between perceived effort intensity and GEE.
As expected, the proposed equations (organized in groups) have shown that the best GEE predictor is the gait velocity. In the group A equations small reductions of the ESE were obtained as anthro-pometric variables concerned with the individuals body mass, such as weight and fat percentage, have been added. In this group, a lower ESE than 1.0 Kcal/min is obtained. Concerning the predict-ing capacity of the equations, it is suggested that whenever possi-ble, the completed distance and the time spent in the gait should be measured in order to obtain the best GEE estimation. The esti-mation can be slightly improved as the individual’s weight is known. The ESE of the group B equations which use the HR, can be expressively reduced with the addition of gender and HRr of the individual. A prediction with ESE lower than 1 kcal/min is obtained with these three variables, which is close to the results obtained in group A. It is suggested that the HR can be used as GEE predictor, as long as it is concerned with gender and HRr.
Groups C of equations, in which the perceived effort exertion is used as GEE predictor, presented the highest ESE, which slightly decrease with the addition of the body weight and PAL of the indi-vidual. It is suggested that the perceived effort exertion should be only used in situations in which it is not possible to identify the gait velocity and the HR. The ESE of this group is of approximately 1.5 kcal/min, which can represent an error of 30% in the GEE estima-tion for a gait of moderate intensity. An explanaestima-tion for the low prediction capacity of the perceived effort intensity may be the existence of only three levels in the scale (L, M and H). Perhaps the use of a scale with more levels, such as the Borg scale, could have increased the discrimination degree and consequently the GEE prediction capacity.
Group D represents the regression with all the variables of the study. The inclusion of the perceived effort exertion does not add expressive improvement in the GEE prediction. It suggests that even if a wide range of independent variables is available, the best prediction is performed with the use of the gait velocity as well as the weight of the individual.
Concerning the measurement of the Polar energetic expendi-ture, despite its validity, the Polar M71®monitor is limited to the
estimation of energetic expenditure only above 100 bpm. This val-ue is not reached by some individuals in gaits of low and moderate intensities. On the other hand, the validity of the estimation done by the M71® Polar increases as the gait velocity increases. The
best prediction is performed in the high intensity, in which the HR of 130 bpm for males and 146 bpm for females are registered. This fact can be explained by the sigmoid behavior of the HR curve concerning the effort intensity(31). The HR curve presents
flatten-ing in its inferior and superior portions. Its central portion – be-tween 130 and 170 bpm – is the one that best adjusts to a line, and therefore, the one that best associates with the effort intensity.
CONCLUSION
Even if a wide group of independent variables is available, the best prediction performed is through the use of the gait velocity and the individual’s weight. The HR for GEE prediction should be followed by the individual’s gender as well as HRr. Making use of the three-leveled scale, the perceived effort exertion should be used only when neither the gait velocity nor the HR is possible to be registered. We suggest that other studies with other scales should be tried. The Polar M71 HR monitor is valid for the GEE estimation as long as the HR overpasses 100 bpm – which does not occur for some young individuals in low and moderate intensi-ty gaits, and its accuracy is better in high intensiintensi-ty gaits, with HR between 130 and 150 bpm.
1. American College of Sports Medicine. ACSM stand position on the appropriate intervention strategies for weight loss and prevention of weight regain for adults. Med Sci Sports Exerc. 2001;33:2145-56.
2. Castaneda C, Layne LE, Orians LM, Gordon PL, Walsmith J, Foldvari M, et al. A randomized controlled trial of resistance exercise training to improve glycemic control in older adults with type 2 diabetes. Diabetes Care. 2002;25:2335-41.
3. Durstine JL, Haskell WL. The influence of exercise on plasma lipids and lipopro-teins. Exerc Sport Sci Rev. 1994;22:477-521.
4. Eriksson J, Taimela S, Koivisto VA. Exercise and the metabolic syndrome. Diabe-tologia. 1997;40:125-35.
5. Fletcher GF, Balady GJ, Amsterdam EA, Chaitman B, Eckel R, Fleg G, et al. Exercise standards for testing and training: a statement for healthcare profes-sionals from the American Heart Association. Circulation. 2001;104:1694-740.
6. Pate RR, Pratt M, Blair SN, Haskell WL, Macera CA, Bouchard C, et al. Physical activity and public health: a recommendation from the Centers for Disease Con-trol and Prevention and the American College of Sports Medicine. JAMA. 1995; 273:402-7.
7. Paffenbarger RS, Jung DL, Leung RW, Hude RT. Physical activity and hyperten-sion: an epidemiological view. Ann Med. 1991;23:319-27.
8. Whelton SP, Chin A, Xin X, He J. Effect of aerobic exercise on blood pressure: a meta-analysis of randomized, controlled trials. Ann Intern Med. 2002;136:493-503.
9. Sociedade Brasileira de Cardiologia. III Diretrizes brasileiras sobre dislipidemias e diretriz sobre prevenção da aterosclerose do Departamento de Aterosclerose da Sociedade Brasileira de Cardiologia. Arq Bras Cardiol. 2001:77-98.
10. Department of Health and Human Services. Physical activity and health: a report of Surgeon General. Atlanta: U.S. Department of Health and Human Services, Centers for Disease Control and Prevention, National Center for Chronic Dis-ease Prevention and Health Promotion; 1996.
11. Pollock ML, Wilmore JH. Exercício na saúde e na doença. Avaliação e prescrição para prevenção e reabilitação. 2a ed. Rio de Janeiro: Médica Científica; 1993.
12. Inan. Condições nutricionais da população brasileira: adultos e idosos. Pesquisa nacional sobre saúde e nutrição. Brasília, Instituto Nacional de Alimentação e Nutrição, Ministério da Saúde; 1991.
13. Heyward VH. Advanced fitness assessment exercise prescription, 3rd ed. Cham-paign: Human Kinetics; 1997.
14. Benetti M, Nahas M. Alterações na qualidade de vida em coronariopatas acome-tidos de infarto agudo do miocárdio, submeacome-tidos a diferentes tipos de tratamen-tos. Rev Bras Atividade Física e Saúde. 2000;6:27-33.
15. Silva DK, Nahas MV. Prescrição de exercícios físicos para pessoas com doença vascular periférica. Rev Bras Cien Mov. 2002;10:55-61.
16. Powers SK, Howley ET. Fisiologia do exercício – teoria e aplicação ao condicio-namento e ao desempenho. 3a ed. Manole: São Paulo; 2000.
17. Di Prampero PE. The energy cost of human locomotion on land and in water. Int J Sports Med. 1986;7:55-72.
18. American College of Sports Medicine. ACSM’s guidelines for exercise testing and prescription. . . Baltimore: Williams & Wilkins; 1995.
19. Ainsworth BE, Haskell WL, Whitt MC, Irwin ML, Swartz AM, Strath SJ et al. Compendium of physical activities: an update of activity codes and MET intensi-ties. Med Sci Sports Exerc. 2000;32:498-504.
20. Hendelman D, Miller K, Bagget C, Debold E, Freedson P. Validity of accelerome-try for assessment of moderate intensity physical activity in the field. Med Sci Sports Exerc. 2000;32:442-9.
21. Strath SJ, Swartz AM, Bassett Jr DR, O’Brien WIL, King GA, Ainsworth BE. Evaluation of heart rate as method for assessing moderate intensity physical activity. Med Sci Sports Exerc. 2000; 32:465-70.
22. Welk JG, Differding JA, Thompson RW, Bair SN, Dziura J, Hart P. The utility of the Digi-walker step counter to assess daily physical activity patterns. Med Sci Sports Exerc. 2000;32:S481-7.
23. Strath SJ, Swartz AM, Basset Jr DR, O‘Brien WL, King GA, Ainsworth BE. Eval-uation of heart rate as a method for assessing moderate intensity physical activ-ity. Med Sci Sports Exerc. 2000;32:S465-70.
24. Hiilloskorpi HK, Pasanen ME, Fogelholm MG, Laukkanen RM, Manttari AT. Use of heart rate to predict energy expenditure from low to high activity levels. Int J Sports Med. 2003;24:332-6.
25. Passmore R, Durnin JVGA. Human energy expenditure. Physiologic Review. 1955; 35:801.
26. Jackson AS, Blair SN, Mahar MT, Wier LT, Ross RM, Suttuville JE. Prediction of functional aerobic capacity without exercise testing. Med Sci Sports Exerc. 1990; 22:863-70.
27. Jackson AS, Pollock ML, Ward A. Generalized equations for predicting body density of women. Med Sci Sports Exerc. 1980;12:175-82.
28. Jackson AS, Pollock ML. Generalized equations for predicting body density of men. Br J Nutr. 1978;40:497-504.
29. Borg G. Escalas de Borg para dor e o esforço pecebido. São Paulo: Manole; 2000.
30. McArdle WD, Katch FI, Katch VL. Fisiologia do exercício – – – – energia, nutrição e – desempenho humano. 4a ed. Rio de Janeiro: Guanabara Koogan; 1998.
31. Lima JRP. Freqüência cardíaca em cargas crescentes de trabalho: ajuste sig-móide, ponto de inflexão e limiar de variabilidade da freqüência cardíaca. São Paulo, Tese (Doutorado) – Escola de Educação Física e Esporte da Universidade de São Paulo; 1997.