Copyright © 2009 by Sociedade Brasileira de Pediatria
O
RIGINALA
RTICLEReceiver operating characteristic (ROC) curves to identify
birth weight cutoffs to predict overweight in Mexican
school children
Suzana A. de Moraes,1 Isabel C. M. de Freitas,2 Lenise Mondini,3 Juana B. Rosas4
Abstract
Objective:To identify birth weight cutoffs to predict overweight in school children and adolescents from
Chilpancingo, Mexico, in 2004.
Methods:Six hundred and sixty-two male and female children between 5 and 13 years old were selected by
probability sampling. Birth weight measures were extracted from vaccination cards. The school children’s nutritional status was defined using specific body mass index (BMI) cutoffs according to sex and age. Predicting equations were built using linear regression models. Areas under the receiver operating characteristic (ROC) curves were calculated and two-graph (TG) ROC curves were plotted, respectively, to detect global accuracy and to identify birth weight cutoffs corresponding to the intersection of sensitivity and specificity curves.
Results:Overweight prevalence was higher in female (46%) than male school children (38.5%). Among
adolescents, overweight prevalence was also higher in females (43.5%) than males (38.9%). BMI average and birth weight deciles showed a linear relation. Areas under ROC curves showed values ≥ 78% in each stratum of sex and age, depicting a difference by sex in adolescents. TG-ROC curves showed that birth weight cutoffs were slightly higher in boys than in girls, and the sensitivity/specificity intersections were ≥ 0.70.
Conclusions:The study results showed that birth weight cutoffs can be used as overweight markers in childhood
and adolescence, being useful as a screening strategy to detect risk groups.
J Pediatr (Rio J). 2009;85(1):42-47:Body mass index, birth weight, sensitivity and specificity, cross-sectional studies.
Introduction
The prevalence of obesity has been increasing dramati-cally in developed as well as developing countries. The rela-tively recent transition from agrarian to urban economy resulted in the increased consumption of high-energy-density foods and reduced physical activity, which are both consid-ered important risk factors for overweight.1
In 2004, Moraes et al.,2in a cross-sectional study related to school children in the urban area of Chilpancingo, state capi-tal of Guerrero, Mexico, identified overweight prevalence lev-els of 37.7% in male and 46.2% in female children. Among
adolescents, these levels were 41.0% for boys and 45.6% for girls. In that study, the authors reported the occurrence of a linear gradient for birth weight tertiles in relation to over-weight, even after adjusting for potential risk factors such as intake of high-energy-density foods, time spent on seden-tary activities, and frequency of physical activities.
In recent years, a new prevention paradigm has high-lighted the intra-uterine relevance of environmental factors, which can influence health throughout life.3,4Several studies have detected an independent effect of birth weight on the risk of overweight during childhood and adult life,2,5,6being
1. MD, MPH, PhD. Escola de Enfermagem de Ribeirão Preto, Universidade de São Paulo (USP), Ribeirão Preto, SP, Brazil. 2. PhD student. Escola de Enfermagem de Ribeirão Preto, USP, Ribeirão Preto, SP, Brazil.
3. PhD. Instituto de Saúde, Secretaria de Estado da Saúde, São Paulo, SP, Brazil.
4. PhD. Unidad Académica de Enfermeria nº 1, Universidad Autónoma de Guerrero, Chilpancingo, Guerrero, Mexico.
No conflicts of interest declared concerning the publication of this article.
Suggested citation:de Moraes SA, de Freitas IC, Mondini L, Rosas JB. Receiver operating characteristic (ROC) curves to identify birth weight cutoffs to predict overweight in Mexican school children. J Pediatr (Rio J). 2009;85(1):42-47.
Manuscript received Jul 01 2008, accepted for publication Oct 29 2008.
doi:10.2223/JPED.1858
overweight alone identified as a risk factor for a large spec-trum of chronic conditions, including cardiovascular diseases and type 2 diabetes mellitus.4,7,8Silveira et al.9in a recent review underlined the relevance of developmental origins of health and disease (DOHaD), recognizing different combina-tions between low birth weight and overweight related to car-diovascular disease in later life, according to living in developing or developed countries.
Some authors have used receiver operating characteris-tic (ROC) techniques to identify the accuracy of cutoffs for anthropometric measures in predicting adiposity (body fat percentage) in children and adults.10,11However, it seems to be unusual the use of those techniques to identify cutoffs for birth weight in predicting overweight in children and adolescents.
Considering the pertinence of setting up health promo-tion and prevenpromo-tion strategies at an early stage of life, this study aimed to identify cutoffs for birth weight to predict over-weight in school children and adolescents who lived in the urban area of Chilpancingo, Guerrero, Mexico, in 2004.
Methods
Data were extracted from the database of a cross-sectional epidemiological study4that reported the prevalence of overweight and associated factors in Mexican school children in 2004. The reference population comprised the universe of students enrolled in elementary schools located in the urban area of Chilpancingo, the state capital of Guerrero, Mexico. The study population consisted of 667 male and female school children, between 5 and 13 years old, selected by random sampling. The sample size was esti-mated taking into account the overweight prevalence as 25% and a maximum error of 3%. From a total of 59 schools, seven schools located in the urban area of Chilpancingo were selected by probability proportional to size sampling, without replacement.12The sampling process was developed in three steps: schools, school grade, and students selection. Data col-lection was carried out between March and May, 2004.
Due to the impossibility to obtain information about the mothers’ gestational age on the occasion of the survey, five children with birth weight ≤ 2,500 g were excluded, resulting in a sample of 662 school children available for this study. The study protocol was submitted and approved by the Research Ethics Committee at Universidad Autónoma de Guerrero, Mexico, and data were collected throughout interviews, after permission by the school children’s parents or caregivers who signed a free informed consent form.
Body mass index (BMI) measures were obtained as a result of the weight (in kilograms) divided by the square of the height (in meters). Weight and height were measured using electronic scales and wall stadiometers to the nearest 0.1 kg and 0.1 cm, respectively. The classification of the school
children’s nutritional status was based on Cole et al. recom-mendations,13based on the cutoff of BMI according to sex and age. Participants were classified in two categories: normal and overweight, the latter category including overweight and obese children.
Birth weight information (in grams) was taken from the children’s vaccination cards, presented by mothers or caregiv-ers during the interview.
Age was classified in two groups: children (≤ 10 years of age) and adolescents (> 10 years of age), and the school chil-dren were also classified by sex as male or female.
In a first step, the relation between birth weight (x), clas-sified in deciles, and the children’s average estimated BMI (y) in each decile was examined. Using regression tech-niques,14,15linear regression models were constructed, fol-lowed by more complex second and third-order models and, finally, logarithmic models. The choice of the best model was based on R2estimates, p values for F distributions in each model, and residual analysis, choosing, whenever possible, models of the lowest order. A significance level α = 0.05 was adopted.
ROC curves16were constructed to identify the global accu-racy (areas under the curves) of birth weight measures to pre-dicting overweight. The areas under the curves were compared according to sex, into age groups, using chi-square statistics. Those areas were estimated by points and 95% con-fidence intervals (95%CI).
Non-parametrical two-graph (TG) ROC curves17were built for children and adolescents according to sex in order to deter-mine birth weight cutoffs (d0) predicting overweight which corresponded to the intersection between sensitivity and specificity curves (θ0). θ0values correspond to the mean between sensitivity (Se) and specificity (Sp) values: θ0 =(Se+Sp)/2. Values for d0were estimated by points and 95%CI.
Stata software version 8.218was used to run regression analysis, and to calculate and compare the areas under the ROC curves. TG-ROC curves were plotted using Computa-tional Methods for Diagnostic Tests (CMDT) software, version 1.0β.19
Results
Table 1 shows overweight prevalence according to age groups and sex. The results depicted increased values for Mexican school children and adolescents, mainly for females in both age groups.
by about 4% for increasing of birth weight decile (x) in crude and stratified analysis.
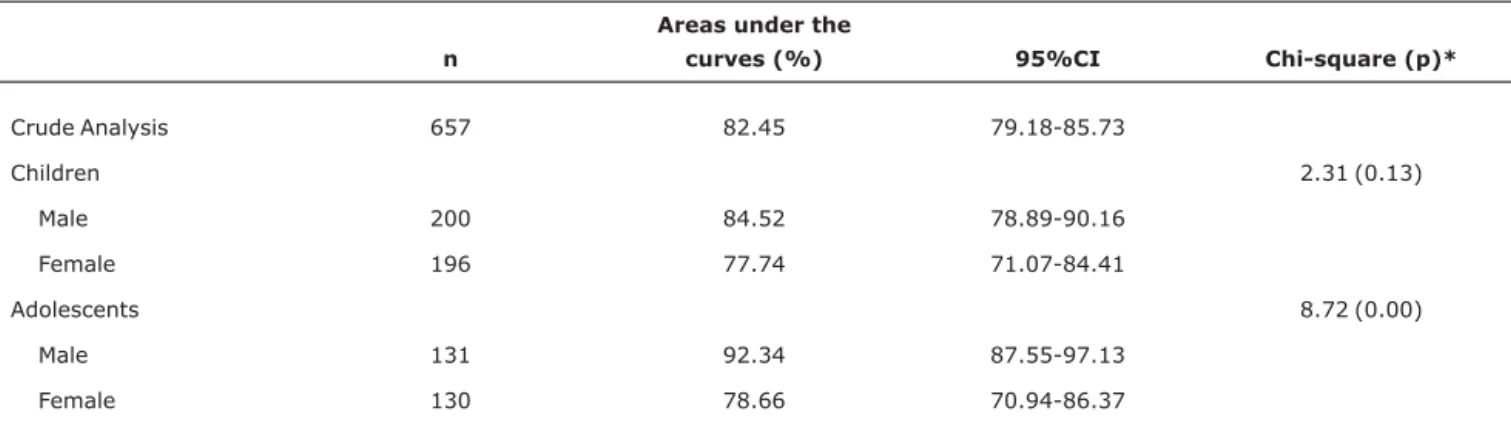
Table 3 shows the global accuracy of birth weight (areas under the ROC curves) for the whole group of school children and according to sex into each age group. The areas under the curves were estimated by points and 95%CI. The chi-square statistics and respective p-values correspond to the hypotheses tests to compare areas under the curves according to sex into age groups. Related to the global accu-racy, the estimated areas reached values of more than 78% (crude and stratified analysis), and narrowed confidence inter-vals, indicating that birth weight measures reached a good discriminatory power to diagnose overweight. The compari-son between areas under the curves showed a statistically sig-nificant difference by sex in adolescents (p < 0.01).
Figure 1 shows TG-ROC curves according to sex in each age group. We can observe that the cutoffs points for birth weight (d0) were higher in males than in females, in both age groups, and θ0values in each group reached levels ≥ 0.70 for the sensitivity/specificity intersections, also indicating that the estimated cutoffs points for birth weight contributed to iden-tify overweight in the study groups.
Discussion
The results revealed a positive linear relation between birth weight and BMI (kg/m2) in Mexican school children from Chilpancingo. These findings are similar to those reported by other studies that examined the relation between birth weight and BMI in subsequent stages of the life cycle,20,21although some authors have found that linearity tends to be attenu-ated as age increases.4,22
In this study, the authors used the areas under the ROC curves to identify the global accuracy of the birth weight mea-sures to predict overweight in children and adolescents. They concluded that the respective measures performed well, as the areas under the curves reached values close to 100% (maximum performance)23in all strata.
ROC curves have been widely used to detect the accuracy of BMI cutoffs to diagnose adiposity in children and adoles-cents.10,11,24,25In those studies, the authors have found that BMI is highly accurate to detect adiposity, using different gold standard methods: X-ray absorptiometry, multisite skinfold thickness and bioelectrical impedance analysis.
On the other hand, in a large part of studies that evi-denced a relationship between birth weight and overweight, Table 1- Overweight* prevalence (%) according to age group and sex (Chilpancingo, Guerrero, Mexico, 2004)
Nutritional status
Children (≤ 10 years of age) Adolescents (> 10 years of age)
Male Female Male Female
n % n % n % n %
Normal 123 61.50 108 54.00 80 61.07 74 56.49
Overweight 77 38.50 92 46.00 51 38.93 57 43.51
Total 200 100 200 100 131 100 131 100
* Overweight was classified as proposed by Cole et al.,13who defined body mass index cutoffs according to age and sex.
Table 2- Regression models* to predict BMI average related to birth weight deciles according to age group and sex (Chilpancingo, Guerrero, Mexico, 2004)
n Regression equations Ra2(%) p†
Crude analysis 657 y = 15.87 + 0.66x 96.03 < 0.01
Children
Male 200 y = 15.88 + 0.66x 96.03 < 0.01
Female 196 y = 15.90 + 0.65x 96.20 < 0.01
Adolescents
Male 131 y = 15.81 + 0.67x 96.43 < 0.01
Female 130 y = 15.84 + 0.66x 95.02 < 0.01
BMI = body mass index.
* Regression models: x = birth weight deciles; y = predicted BMI average.
Table 3- Areas under ROC curves to estimate global accuracy of birth weight related to overweight according to age group and sex (Chilpancingo, Guerrero, Mexico, 2004)
n
Areas under the
curves (%) 95%CI Chi-square (p)*
Crude Analysis 657 82.45 79.18-85.73
Children 2.31 (0.13)
Male 200 84.52 78.89-90.16
Female 196 77.74 71.07-84.41
Adolescents 8.72 (0.00)
Male 131 92.34 87.55-97.13
Female 130 78.66 70.94-86.37
95%CI = 95% confidence interval; ROC = receiver operating characteristic. * Chi-square estimates and p values to compare areas under ROC curves in strata.
Figure 1 - TG-ROC curves to estimate birth weight cutoff (d0), sensitivity (Se), specificity (Sp), and intersection (θ0) related to overweight,
in subsequent periods of the life cycle, the authors had used different methodologies, such as multivariable techniques to evaluate the magnitude of that association, after adjusting for risk/protective factors.2,6,26Moraes et al.,2investigating overweight and obesity correlates, detected that birth weight (classified in tertiles) was an independent predictor for over-weight and obesity in school children from Chilpancingo. In that study, the authors found that adjusted odds ratios for birth weight measures classified in the third tertile (≥ 3,110 g) reached values of 7.03 (95%CI 3.53-13.99) and 7.91 (95%CI 2.83-22.09), related to overweight and obesity, respectively.
The advantage of the present study was that the use of TG-ROC curves made it possible to define birth weight cutoff points to detect overweight (including 95% confidence inter-vals) and respective sensitivity/specificity intersections, pro-viding practical and useful information to encourage public health promotion policies. Hence, the use of TG-ROC curves might complement Moraes et al. findings,2as the technique permits estimating not only the birth weight cutoff in predict-ing the outcome but also a convergence point for its sensitiv-ity and specificsensitiv-ity which could be applied as a screening strategy in epidemiology.
It could be relevant to highlight that the cutoffs for birth weight in this study suggest high positive predictive values in populations with high overweight prevalence levels, like chil-dren from Chilpancingo. However, it cannot be affirmed that those same cutoffs would reach high positive predictive val-ues in populations with low prevalence levels of the outcome under analysis.17
Some authors have reported that, in considering the rela-tionship between birth weight and BMI in later stages of the life cycle, the mother’s nutritional status before pregnancy could have a positive confounding effect reducing the strength of this association, however without eliminating it.3,4The mother’s nutritional status before pregnancy was not for-mally available to be taken into consideration in the present study, and getting the information by interviews might result in the occurrence of recall bias, mainly in cross-sectional designs.
The choice of cutoffs for birth weight measures to predict-ing future risks for overweight should preferably be based on the evidence coming from longitudinal studies, which are more appropriate to express the natural history of different health outcomes.11,24The present study results suggest, however, that the cutoffs found for birth weight measures in Chilpancingo can be used to earlier track newborns for follow-up in order to prevent overweight in subsequent peri-ods, such as late childhood and adolescence.
In this perspective, the results support the recommenda-tion that birth weight cutoffs and the respective sensitivity/ specificity based on TG-ROC curves, as those found in the present study, could be appropriate to sustain public policies
for health promotion and prevention programs against over-weight, in populations with high overweight prevalence levels.
References
1. Lobstein T, Baur L, Uauy R; IASO International Obesity TaskForce.
Obesity in children and young people: a crisis in public health. Obes Rev. 2004;5 Suppl 1:4-104.
2. Moraes SA, Béltran JR, Mondini L, Freitas ICM. Prevalência de sobrepeso e obesidade e fatores associados em escolares de área urbana de Chilpancingo, Guerrero, México, 2004. Cad Saude Publica. 2006;22:1289-301.
3. Oken E, Gillman MW.Fetal origins of obesity.Obes Res. 2003; 11:496-506.
4. Cameron N, Demerath EW.Critical periods in human growth and their relationship to diseases of aging. Am J Phys Anthropol. 2002;Suppl 35:159-84.
5. Kinra S, Baumer JH, Davey Smith G.Early growth and childhood obesity: a historical cohort study.Arch Dis Child. 2005;90: 1122-7.
6. Ribeiro IC, Taddei JA, Colugnatti F.Obesity among children attending elementary public schools in São Paulo, Brazil: a case-control study.Public Health Nutr. 2003;6:659-63.
7. Hemachandra AH; Howards PP; Furth SL; Klebanoff MA.Birth weight, postnatal growth, and risk for high blood pressure at 7 years of age: results from the Collaborative Perinatal Project. Pediatrics. 2007;119:1264-70.
8. Dietz WH.Health consequences of obesity in youth: childhood predictors of adult disease.Pediatrics. 1998;101:518-25.
9. Silveira PP, Portella AK, Goldani MZ, Barbieri MA.Developmental origins of health and disease (DOHaD).J Pedriatr (Rio J). 2007; 83:494-504.
10. Zimmermann MB, Gübeli C, Püntener C, Molinari L.Detection of overweight and obesity in a national sample of 6-12-y-old Swiss children: accuracy and validity of reference values for body mass index from the US Centers for Disease Control and Prevention and the International Obesity Task Force. Am J Clin Nutr. 2004; 79:838-43.
11. Sardinha LB, Going SB, Teixeira PJ, Lohman TG.Receiver operating characteristic analysis of body mass index, triceps skinfold thickness, and arm girth for obesity screening in children and adolescents.Am J Clin Nutr. 1999;70:1090-5.
12. Silva NN. Amostragem probabilística: um curso introdutório. 2ª ed. rev. São Paulo: EDUSP; 2001.
13. Cole TJ, Bellizzi MC, Flegal KM, Dietz WH.Establishing a standard definition for child overweight and obesity worldwide: international survey.BMJ. 2000;320:1240-3.
14. Vieira, S. Bioestatística: tópicos avançados. 2ª ed. Rio de Janeiro: Elsevier; 2004.
15. Kleinbaum DG, Kupper LL, Muller KE, Nizam A. Applied regression analysis and other multivariable methods. 3rd ed. Pacific Grove, CA: Duxbury Press; 1998.
16. Zweig MH, Campbell G.Receiver-operating characteristic (ROC) plots: a fundamental evaluation tool in clinical medicine.Clin Chem. 1993;39:561-77.
18. Stata Corporation. Intercooled Stata 8.2 for windows. College Station, TX: Stata Corporation; 2005.
19. Institut für Parasitologie und Tropenveterinärmedizin, Freie Universität Berlin.Computer Method for Diagnostic Tests – CMDT, version 1.0β. Berlin: Freie Universität Berlin; 1997. Copyright © 1997-1999 Jens Briesofsky.
20. Hui LL, Schooling CM, Leung SS, Mak KH, Ho LM, Lam TH, et al.
Birth weight, infant growth, and childhood body mass index: Hong Kong's children of 1997 birth cohort.Arch Pediatr Adolesc Med. 2008;162:212-8.
21. Li C, Goran MI, Kaur H, Nollen N, Ahluwalia JS.Developmental trajectories of overweight during childhood: role of early life factors.Obesity (Silver Spring). 2007;15:760-71.
22. Parsons TJ, Power C, Manor O.Fetal and early life growth and body mass index from birth to early adulthood in 1958 British cohort: longitudinal study.BMJ. 2001;323:1331-5.
23. Fletcher RH, Fletcher SW, Wagner EH. Epidemiologia clínica: elementos essenciais. 3ª ed. Porto Alegre: Artes Médicas; 1996.
24. Lazarus R, Baur L, Webb K, Blyth F.Body mass index in screening for adiposity in children and adolescents: systematic evaluation using receiver operating characteristic curves.Am J Clin Nutr. 1996;63:500-6.
25. Bedogni G, Iughetti L, Ferrari M, Malavolti M, Poli M, Bernasconi S, Battistini N.Sensitivity and specificity of body mass index and skinfold thicknesses in detecting excess adiposity in children aged 8-12 years.Ann Hum Biol. 2003;30:132-9.
26. Laitinen J, Power C, Järvelin MR. Family social class, maternal body mass index, childhood body mass index, and age at menarche as predictors of adults obesity. Am J Clin Nutr. 2001; 74:287-94.
Correspondence: Suzana Alves de Moraes Av. Santa Luzia, 440/81
CEP 14025-090 - Ribeirão Preto, SP - Brazil Tel.: +55 (16) 3602.3424