Original Article
Artigo Original
Lilian Cássia Bórnia Jacob-Corteletti1 Josilene Luciene Duarte1 Fernanda Zucki1 Luciane Domingues Figueiredo Mariotto1 José Roberto Pereira Lauris2 Kátia de Freitas Alvarenga1
Descritores
Testes de Impedância Acústica Relexo Acústico Recém-Nascido Fatores de Risco Perda Auditiva Keywords
Acoustic Impedance Tests Relex, Acoustic Infant, Newborn Risk Factors Hearing Loss
Correspondence address:
Lilian Cássia Bórnia Jacob-Corteletti Departamento de Fonoaudiologia, Faculdade de Odontologia de Bauru, Universidade de São Paulo
Alameda Doutor Otávio Pinheiro Brisolla, 9-75, Vila Universitária,Bauru (SP), Brasil, CEP: 17012-901. E-mail: [email protected]
Received: 06/30/2014
Study carried out at the Speech Language Pathology and Audiology Department, Dental School of Bauru, Universidade de São Paulo – USP – Bauru (SP). Brazil.
(1) Speech Language Pathology and Audiology Department, Dental School of Bauru, Universidade de São Paulo – USP – Bauru (SP). Brazil.
(2) Department of Orthodontics, Pediatric Dentistry and Public Health, Dental School of Bauru, Universidade de São Paulo – USP – Bauru (SP). Brazil.
Financial support: Conselho Nacional de Desenvolvimento Cientíico e Tecnológico – CNPq.
Conlict of interests: nothing to declare.
Acoustic relex on newborns: the inluence
of the 226 and 1,000 Hz probes
A inluência da sonda de 226 e 1.000 Hz
no registro do relexo acústico em neonatos
ABSTRACT
Purpose: To analyze the occurrence of acoustic relex and its threshold on newborns using the 226 and 1,000 Hz probes. Methods: Thirty-six newborns with “PASS” results in newborn hearing screening and tympanogram with one or two peaks for both probe tones were included. Group I comprised 20 full-term newborns without risk indicator for hearing loss, and Group II comprised 16 newborns with at least one risk indicator. The study about ipsilateral acoustic relex thresholds was conducted in 500, 1,000, 2,000, and 4,000 Hz. Results: The groups presented the acoustic relex thresholds between 50 and 100 dB for both probe tones. In the comparison between the probes, there were differences in all frequencies evaluated in Group I, with the lowest threshold mean for the 1,000 Hz probe. In Group II, differences were detected at 2,000 Hz. The mean acoustic relex thresholds were similar in both groups for the 226 Hz probe. There was a difference for the 1,000 Hz probe in all tested frequencies. The percentage of response was higher in both groups for the 1,000 Hz probe. The kappa test showed extremely poor agreement in the comparison of results between both probes. Conclusion: The occurrence of acoustic relex was higher in newborns and its thresholds were lower with the 1,000 Hz probe both for healthy newborns and for newborns at risk.
RESUMO
Objetivo: Veriicar a ocorrência e o limiar do relexo acústico em neonatos utilizando a sonda de 226 e 1.000 Hz. Métodos: Trinta e seis neonatos com resultado “PASS” na triagem auditiva neonatal e timpanogramas com um ou dois picos para os dois tons de sonda. O Grupo I foi composto por 20 neonatos a termo sem indicador de risco para deiciência auditiva e o Grupo II, por 16 neonatos com pelo menos um indicador de risco. A pesquisa dos limiares do relexo acústico ipsilateral foi realizada em 500, 1.000, 2.000 e 4.000 Hz.
INTRODUCTION
Acoustic impedance tests are objective, non-invasive, safe, simple, and easy to conduct. They are widely used for hearing assessment(1-4). These tests provide information regarding the
mobility of the tympanossicular system by presenting the pres-sure in the external auditory canal (tympanometry) and the contraction of the stapedius muscle when stimulated by high-intensity sounds (acoustic relex)(5,6).
A probe is placed in the external acoustic meatus to con-duct acoustic impedance tests, thus causing hermetic seal, whereas one tone is continuously presented to the audi-tory system with varying pressure in the external acoustic meatus. At the point where the magnitude of the acous-tic admittance is maximal, there is a pressure peak in tym-panometry and, under these conditions, with the same probe tone, the acoustic relex is analyzed(7-9). The acoustic relex
is deined as the lowest stimulus intensity able to produce a detectable change in acoustic admittance(5,6,10). The
analy-sis of the presence or absence of Acoustic Stapedial Relex Threshold (ASRT) may indicate a middle-ear dysfunction, signiicant cochlear hearing loss, retrocochlear pathology, or dysfunction in the facial nerve(11-14). The results of the
acoustic relex also help to interpret the audiological ind-ings after verifying the compatibility between diagnos-tic tests(15). This procedure has diagnostic value in all age
groups. In the pediatric population, due to the anatomical changes in the irst two years of life, such as the increasing size of the auditory canal, changes in the orientation of the tympanic membrane, decreasing mass in the middle ear, and others(16,17), the mass component is prevalent in the middle
ear; therefore, the resonance frequency tends to be low when compared to normal adults(18). Therefore, this must be
consid-ered for choosing the frequency probe tone used to generate the acoustic relex, thus preventing mistaken interpretations regarding the results of the examination.
Despite its clinical important, the acoustic stapedius relex test has not been widely used among infants (0–6 months old)(10).
Nowadays, there is no regulation for the research of acoustic relex threshold in this population(19); some studies have tried
to establish levels of ASRT for healthy newborns, by using different pure tones in broadband noise (BBN). Therefore, it is necessary to perform studies verifying the occurrence and threshold of acoustic relex among newborns with different probe tones to generate the stimulus. The objective of this study is to verify the occurrence of ASRT in newborns using the 226 and 1,000 Hz probes.
METHODS
The study was approved by the Human Research Ethics Committee (Registration Number 078/2007). All parents and people in charge signed the informed consent.
The medical history of each newborn was analyzed, and parents or people in charge were interviewed in order to verify issues related to pre-, peri-, and post-natal history.
The analyses were conducted in the maternity ward of a public hospital.
Sample selection
Inclusion criteria
Newborns from both genders who obtained the “PASS” result in the newborn hearing screening and tympanogram, with one or two peaks for the 226 and 1,000 Hz probe tone, were included. These patterns indicate the normal function of the middle ear for the newborn population.
Sample
Thirty-six newborns participated in the study and were sub-divided in two groups:
• Group I: 20 newborns (mean age of 36 hours) who were born at a term without history of pre-, peri-, or post-natal intercurrences and without risk indicator for hear-ing impairment(20);
• Group II: 16 newborns (mean age of 32 days) who presented at least one risk criterion for hearing impairment(20). They
were all in the Neonatal Intensive-Care Unit.
Transient-Evoked Otoacoustic Emissions
The equipment Madsen AccuScrenPRO, with nonlinear
acoustic click stimulus at 73 dB SPL (maximum sound pres-sure level at 85 dB SPL) and frequency rate of 1.4 to 4 kHz, was used. To analyze the presence of response, the software used a binomial statistical test that calculates the probability of an emission having been recorded in a succession of sampling points, ranging from 6 to 12 ms after the end of the stimulus, presenting the results “PASS” or “REFER”.
Acoustic immittance measures
After the newborn hearing threshold, acoustic immit-tance measures were taken, and the ear was chosen ran-domly. That is, in the irst newborn, the test was performed in the right ear, and, in the second one, in the left year, and so on and so forth.
The tympanometry and the analysis of the ipsilateral relex threshold frequencies 500, 1,000, 2,000, and 4,000 Hz were
performed with the equipment Madsen Otolex 100 middle ear
analyzer (GN Otometrics).
Data analysis
The descriptive analysis of the quantitative and qualita-tive variables (mean, median, standard deviation, maximum value, minimum value, 5th percentile, 95th percentile) was used,
and, in the inferential analysis, the t-test was used to compare
Groups I and II. The paired t-test was used to compare the
the agreement coeficient (kappa) to observe the concordance between the obtained results with the 226 and the 1,000 Hz probes. In all of the analyses, the adopted signiicance level was 5% (p≤0.05).
RESULTS
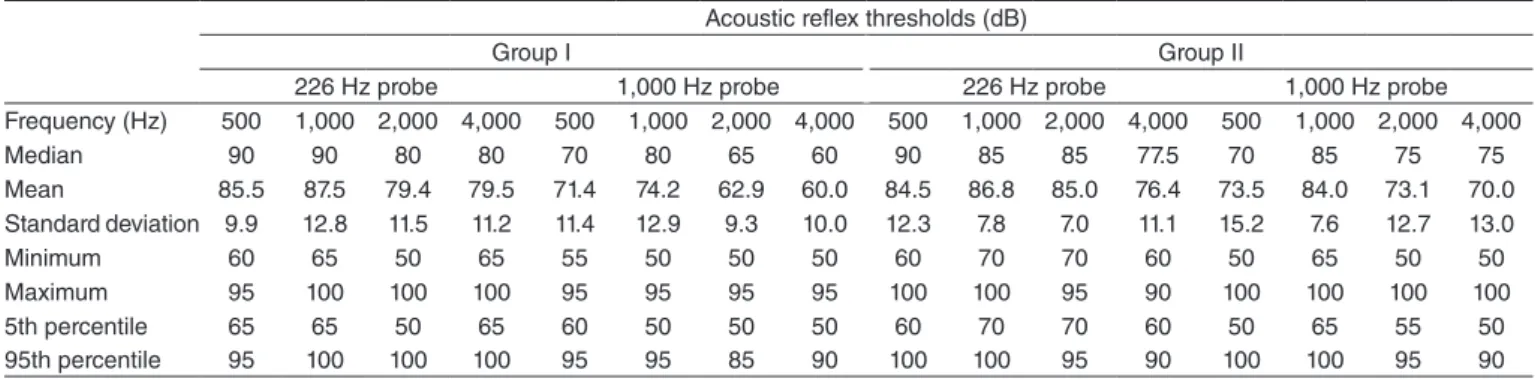
Table 1 presents the values regarding the descriptive analysis of the results found for the acoustic relex thresholds obtained with the 226 and 1,000 Hz probes for Groups I and II.
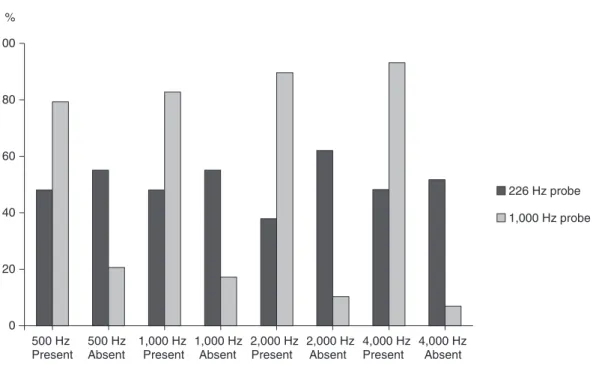
Figures 1 and 2 show the percentage of presence and absence of responses obtained in the acoustic relex study with the 226 and 1,000 Hz probes, respectively, for Groups I and II. Tables 2 and 3 provide the observed concordance (%) and the Kappa coeficient for this analysis in Groups I and II, respectively.
Tables 4 and 5 shows the comparison between the 226 and the 1,000 Hz probes (Table 4) and between groups (Table 5) for the acoustic relex thresholds obtained in the frequencies of 500 to 4,000 Hz.
DISCUSSION
Nowadays, the regulation regarding data on ASRT with the 1,000 Hz probe tone is lacking. In the literature studied, only a few studies focused on analyzing the acoustic relex threshold with the 1,000 Hz probe. In 2007, authors(21)
ana-lyzed the data regarding ASRT in 267 ears, using 1,000 Hz pure tone stimuli, and the acoustic relex threshold was con-sidered as the lowest intensity in which there was a change in the admittance of at least 0.02 mmho. Based on this crite-rion, they found out that 94% of the ears had a mean acoustic
Table 1. Descriptive data (median, mean, standard deviation, minimum and maximum value, 5th, and 95th percentile) regarding the acoustic reflex
thresholds obtained in the 500 to 4,000 Hz frequencies of newborns in Groups II and II, conducted with 226 and 1,000 Hz probe tones Acoustic reflex thresholds (dB)
Group I Group II
226 Hz probe 1,000 Hz probe 226 Hz probe 1,000 Hz probe Frequency (Hz) 500 1,000 2,000 4,000 500 1,000 2,000 4,000 500 1,000 2,000 4,000 500 1,000 2,000 4,000
Median 90 90 80 80 70 80 65 60 90 85 85 77.5 70 85 75 75
Mean 85.5 87.5 79.4 79.5 71.4 74.2 62.9 60.0 84.5 86.8 85.0 76.4 73.5 84.0 73.1 70.0 Standard deviation 9.9 12.8 11.5 11.2 11.4 12.9 9.3 10.0 12.3 7.8 7.0 11.1 15.2 7.6 12.7 13.0
Minimum 60 65 50 65 55 50 50 50 60 70 70 60 50 65 50 50
Maximum 95 100 100 100 95 95 95 95 100 100 95 90 100 100 100 100 5th percentile 65 65 50 65 60 50 50 50 60 70 70 60 50 65 55 50 95th percentile 95 100 100 100 95 95 85 90 100 100 95 90 100 100 95 90
0 20 40 60 80 100
500 Hz Present
500 Hz Absent
1,000 Hz Present
1,000 Hz Absent
2,000 Hz Present
2,000 Hz Absent
4,000 Hz Present
4,000 Hz Absent
226 Hz probe
1,000 Hz probe %
Table 2. Kappa coefficient for the agreement between the probe tones (226 and 1,000 Hz) in newborns from Group I Observed agreement (%)
Kappa 1,000 Hz x 226 Hz probes
Frequency (Hz) 500 1,000 2,000 4,000 500 1,000 2,000 4,000
62.86 51.85 62.96 74.07 -0.07 0.00 0.00 0.00
Table 3. Kappa coefficient for the agreement between probe tones (226 and 1,000 Hz) in newborns from Group II Observed agreement (%)
Kappa 1,000 Hz x 226 Hz probes
Frequency (Hz) 500 1,000 2,000 4,000 500 1,000 2,000 4,000
58.62 48.28 48.28 55.17 0.22 0.03 0.13 0.13
Table 4. Comparison between the 226 and 1,000 Hz probes for acoustic reflex thresholds obtained in the 500–4,000 Hz frequencies considering Groups I and II
Acoustic reflex (226 x 1,000 Hz probes)
Group I Group II
Frequency (Hz) 500 1,000 2,000 4,000 500 1,000 2,000 4,000 p-value 0.003* 0.002* 0.001* 0.000* 0.064 0.422 0.003* 0.156 *Statistically significant (p<0.05)
Table 5. Comparison between Groups I and II for the reflex thresholds obtained with the 226 and 1,000 Hz probes in frequencies 500 to 4,000 Hz Acoustic reflex (Group I x Group II)
226 Hz probe 1,000 Hz probe
Frequency (Hz) 500 1,000 2,000 4,000 500 1,000 2,000 4,000 p-value 0.850 0.995 0.206 0.321 0.831 0.010* 0.006* 0.002* *Statistically significant (p<0.05)
0 20 40 60 80 100
500 Hz Present
500 Hz Absent
1,000 Hz Present
1,000 Hz Absent
2,000 Hz Present
2,000 Hz Absent
4,000 Hz Present
4,000 Hz Absent
226 Hz probe
1,000 Hz probe %
relex threshold of 93 dB and 90% between 80 and 105 dB HL. Similarly, however, with pure tone stimuli of 2 kHz and broadband noise, a study(22) detected the presence of
acous-tic relex (AR) in 97.6% of 42 normal newborns, with mean ASRT of 76.2 (±7.9) for the 2 kHz frequency and 64.9 (±7.8) for the broadband noise, respectively. Even though the results of these studies provide useful clinical information, they are restricted to the analysis of ASRT in only one frequency, or with broadband stimulus. A study from 2005(23) analyzed the
changes in the contralateral acoustic relex of children aged 6 weeks and adults, using a probe with 250 and 8,000 Hz signals and broadband noise. Changes in AR were similar, above 1,000 Hz among children and adults; however, values lower than 1,000 Hz among children were less reliable. The relexes were detected more successfully among infants when the correlation was calculated in 1,000–8,000 Hz, and among adults, from 250 to 2,000 Hz.
The ipsilateral relex threshold was analyzed(14) in the
1,000, 2,000, and 4,000 Hz frequencies, with the 226 Hz probe, and it was observed that for the female gender
and the right ear, the mean dB (±standard deviation) was
96.43 (±10.62), 93.29 (±9.40), and 91.85 (±7.77); whereas for the female gender and the left ear, it was 92.67 (±9.0), 92.38 (±8.89), and 91.67 (±8.86). For the male gender and the right ear, the mean dB was 94.71 (±8.54), 93.06 (±10.59), and 92.18 (±7.18); whereas for the male gender and the left ear, it was 94.25 (±9.77), 94.13 (±9.76), and 95.47 (±6.82). There was no signiicant difference between gender and
fre-quency. A study(24) observed newborns and the association
between Transient-Evoked Otoacoustic Emission (TEOAE) and changes in acoustic immittance with a 226 Hz probe. For that, the authors assessed 20 newborns with absent TEOAEs (experimental group) and 101 with TEOAEs (study
group). The mean relex threshold was 98.57 (±14.52) for
the 500 Hz frequency, 102.50 (±9.64) for the 1,000 Hz
fre-quency, 103.33 (±6.83) for the 2,000 Hz frequency, and
111.0 (±10.84) for the 4,000 Hz frequency in the group with
absent TEOAEs; and 92.83 (±9.04) for the 500 Hz frequency,
93.48 (±8.48) for the 1,000 Hz frequency, 93.88 (±9.48) for
the 2,000 Hz frequency, and 93.21 (±9.99) for the 4,000 Hz
frequency in the group with TEOAEs.
In this study, for newborns in Group I, the mean ASRT obtained with the 226 Hz probe was lower (Table 1) in all frequencies in comparison to that found by other studies(14,24).
With the 1,000 Hz probe, the average was 74.2 dB for the 1,000 Hz frequency and 62.9 dB for 2,000 Hz (Table 1).
A study(21) found a mean of 93 dB for the 1,000 Hz and two
other studies(10,22) found means of 73.05 and 76.2 dB for
1,000 and 2,000 Hz, respectively. In the these studies, no other frequencies were analyzed. As in this study, another
analysis(9) has recently observed the ASRTs in 73 newborns
with integrity of the external ciliated cells and observed the presence of AR in all the newborns. Values ranged between minimum and maximum: right ear — between 85 and 110 dB for 500 Hz and 80 and 110 dB for 1,000 to 4,000 Hz frequencies in ipsi- and contralateral measurements; left ear — between 85 and 110 dB for 500, 1,000, and 2,000 Hz
frequencies and between 90 and 110 dB for 4,000 Hz in the contralateral measure. For the ipsilateral measurement, values between 80 and 110 dB were observed for the 1,000 and 2,000 Hz frequencies. These ASRT values are higher than the ones found in this study, which ranged from 55 to 95 dB for the 500 Hz frequency and 50 to 95 dB for the 1,000 to 4,000 Hz frequencies (Table 1).
Generally, the ASRT in Groups I and II varied between 50 dB (minimum value or 5th percentile) and 100 dB for both probe tones (226 and 1,000 Hz). The occurrence of acoustic relex at 50, 55, or 60 dB was higher with the 1,000 Hz probe. Lower ASRTs were also found(10,21,22) and were justiied by the
small size of the external auditory canal of newborns by vibra-tion of the wall of the canal after a sound stimulus. However, it is worth to mention that the minimum intensity for the analysis of AR in the equipment is 50 dB NPS.
Regarding the acoustic relex thresholds obtained among
the newborns in Group II, literature has only one study(25)
with the same subject of investigation. In that study, the authors analyzed the Brainstem Auditory Evoked Potentials (BAEP), the TEOAEs, and the acoustic relex among 53 children pre-senting risk indicators for hearing impairment. They observed that, from the ears presenting BAEP thresholds lower than 30 dB nHL, 91% had TEOAEs, which suggests psychoacous-tic thresholds within normal patterns; out of these, 78% had acoustic relex. Therefore, the authors proposed that the anal-ysis of TEOAE acoustic relex could be an eficient newborn hearing screening protocol.
In the comparison between probes (Table 4), it was possi-ble to verify the differences in all of the frequencies assessed in the group of healthy newborns (Group I), and the mean of thresholds was lower with the 1,000 Hz probe. In Group II, a difference was detected between probes only in the 2,000 Hz frequency. However, the small sample size for the 226 Hz probe may have influenced the analysis of this variable. After comparing the groups (Table 5), the mean acoustic relex thresholds found with the 226 Hz probe in the frequen-cies of 500 to 4,000 Hz were similar in both studied groups. With the 1,000 Hz probe, there was a difference between the 1,000, 2,000, and 4,000 Hz frequencies; the group of healthy newborns (Table 1) presented lower acoustic relex thresh-olds. It is believed that the highest acoustic relex thresholds for newborns at risk were due to the immaturity of the struc-tures in the external and middle ear, caused by the size and weight of the newborn, as well as auditory pathways, since most newborns in this group presented prematurity as a risk indicator. Some authors studied the neurological maturation of auditory pathways(26-28) and reported that it starts in the 6th
The analysis of the data presented in Figures 1 and 2, regarding the occurrence of acoustic relex in Groups I and II, respectively, clearly demonstrates the difference between the indings of both the probes. In the analysis of acoustic relex, studying thresholds in healthy newborns (Figures 1 and 2), the speciicity was also 100% for the 1,000, 2,000, and 4,000 Hz with the 1,000 Hz probe. The occurrence (100%) in the presence of AR in Group I is higher than that found in two studies — 97.6%(22) and 91.3%(10). On the other hand,
the percentage of the presence of response in the group with risk indicators (Group II) for the 1,000 Hz probe (Figure 2) ranged from 79% (500 Hz) to 93% (4,000 Hz). It is important to mention that the inclusion criteria involved newborns who had otoacoustic emissions, based on the assumption that, in general, the presence of TEOAEs suggests not only the nor-mality in the cochlear ampliier mechanism, but also normal middle ear function, or close to normal. However, since there are reports in literature mentioning that conductive impairment did not inluence the record of TEOAEs, or that resulted in reduced level of response(19,29), only newborns who presented
TEOAEs, tympanogram with one or two peaks for both probe tones were included in the study sample. These patterns are indicators of normal middle ear function for the newborn population. Therefore, the absence of acoustic relex in some newborns from Group II may suggest the existence of new-borns with retrocochlear changes in the sample, as these pre-sented risk indicators for hearing impairment, according to the Joint Committee on Infant Hearing(20).
The discrepancy between the results obtained with the 226 and 1,000 Hz probes in the acoustic relex analysis was proved by the kappa test (Tables 2 and 3). In this test, the agreement between the responses obtained from both probes was assessed. The values revealed extremely poor agreement (0.8 to 1 is con-sidered as almost perfect agreement), that is, in many cases, the analysis of ASRTs revealed absence of response when con-ducted with the 226 Hz probe, and the presence of response when conducted with the 1,000 Hz probe.
The results found in this study show that the analysis of the stapedius acoustic relex in newborns from both groups was more eficient with the 1,000 Hz probe.
CONCLUSION
Based on the presented results, it is possible to state that the occurrence of acoustic relex in newborns was higher, whereas thresholds were lower, when the analysis was conducted with the 1,000 Hz probe in comparison to the 226 Hz probe, both for healthy and at risk newborns.
ACKNOWLEDGEMENTS
We would like to thank the National Council for Scientiic and Technological Research (CNPq) for the support.
*LCBJC and KFA were in charge of the study project and design, as well as of the general guidance of the stages of execution and elaboration of the
manuscript; LCBJC was in charge of data collection; JLD, FZ, and LDFM collaborated with data collection, structure of results, and elaboration of the manuscripts; JRPL was responsible for the statistical analysis of data and collaborated with the elaboration of the manuscript.
REFERENCES
1. Lopes-Filho O. Tratado de Fonoaudiologia. São Paulo: Rocca; 1997. 2. Margolis RH, Schacern PL, Fulton S. Multi-frequency tympanometry
and histopathology in Chinchilles with experimentally produced middle ear pathologies. Acta Otolaryngol. 1998;118:216-25.
3. Carvallo RMM, Sanches SGG, Ravagnani MP. Amplitude das emissões otoacústicas transientes e por produto de distorção em jovens e idosos. Rev Bras Otorrinolaringol. 2000;66(1):38-45.
4. Lidén G. Impedance audiometry. Ann Otol Rhinol Laryngol Suppl. 1980;89(5 Pt 2):53-8.
5. Camboim ED, Correia AMN, Vasconcelos D, Torres R, Scharlach RC, Azevedo MF. Análise comparativa das emissões otoacústicas com a timpanometria em lactentes de 0 a 6 meses. Rev CEFAC. 2012;14(3):403-12.
6. Emanuel DC, Henson OEC, Knapp RR. Survey of audiological immittance practices. Am J Audiol. 2012;21(1):60-75.
7. Parra GFA, Carvallo RMM, Nakagawa L. Relexos acústicos eliciados com sonda de 678 e 1000 Hz em adultos sem queixas auditivas. Int Arch Otorhinolaryngol. 2005;9(1):27-36.
8. Tatinazzio TG, Diniz TA, Marba STM, Colella-Santos MF. Emissões otoacústicas e medidas de imitância acústica com tons de sonda de 226 e 1000 Hz em lactentes. Rev CEFAC. 2011;13(3):479-88.
9. Teixeira BN, Sleifer P, Pauletti LF, Krimberg CFD. Estudo das medidas de imitância acústica com tom de sonda de 226 e 1000 Hz em neonatos. Audiol Commun Res. 2013;18(2):126-32.
10. Mazlan R, Kei J, Hickson L. Test-Retest reliability of the acoustic stapedial reflex test in healthy neonates. Ear Hear. 2009;30(3):295-301.
11. Jerger S, Jerger J, Mauldin L, Segal P. Studies in impedance audiometry II. Children less than six years old. Arch Otolaryngol. 1974;99:1-9. 12. Jerger J, Harford E, Clemis J, Alford B. The acoustic relex in eighth
nerve disorders. Arch Otolaryngol. 1974;99:409-13.
13. Niemeyer W, Sesterhenn G. Calculating the hearing threshold from the stapedius reflex threshold for different sound stimuli. Audiol. 1974;13:421-9.
14. Soares JC, Carvallo RMM. Redução do limiar de relexo acústico em neonatos sem risco auditivo. Rev Bras Otorrinolaringol. 2006;72(1):49-54.
15. Hall III JW, Swanepoel DW. Aural immittance measurements. In: Hall III JW, Swanepoel DW. Objective assessment of hearing. San Diego: Plural Publishing; 2010.
16. Keefe DH, Levi E. Maturation of the middle ear external ears: acoustic power-based responses and reflectance tympanometry. Ear Hear. 1996;17(5):361-73.
17. Andre KD, Sanches SGG, Carvallo RMM. Middle ear resonance in infants: age effects. Int Arch Otorhinolaryngol. 2012;16(3):353-7. 18. Holte LA, Margolis RH, Cavanaugh RM. Development changes in
multifrequency tympanograms. Audiology. 1991;30(1):1-24.
19. Kei J, Allison-Levick J, Dockray J, Harrys R, Kirkegard C, Wong J, et al. High frequency (1000 Hz) tympanometry in normal neonates. J Am Acad Audiol. 2003;14(1):20-28.
20. Joint Committee on Infant Hearing. Year 2007 Position Statement: principles and guidelines for early hearing detection and intervention programs. Pediatrics. 2007;120(4):898-921.
21. Swanepoel DW, Werner S, Hugo R, Louw B, Owen R, Swanepoel A. High frequency immittance for neonates: a normative study. Acta Otolaryngol. 2007;127(1):49-56.
23. Feeney MP, Sanford CA. Detection of the acoustic stapedius relex in infants using wideband energy relectance and admittance. J Am Acad Audiol. 2005;16(5):278-90.
24. Linares AM, Carvallo RMM. Acoustic immittance in children without otoacoustic emissions. Rev Bras Otorrinolaringol. 2008;74(3):410-6. 25. Plinkert PK, Sesterhenn G, Arold R, Zenner HT. Evaluation of
otoacoustic emissions in high-risk infants by using an easy and rapid objective auditory screening method. Eur Arch Otorhinolaryngol. 1990;247(6):356-60.
26. Hall III JW. Handbook of auditory evoked responses. Boston: Allyn and Bacon; 1992.
27. Matas CG. Medidas eletrofisiológicas da audição. Audiometria de tronco encefálico. In: Carvallo RMM, organizadora. Fonoaudiologia: informação para a formação - procedimentos em Audiologia. Rio de Janeiro: Guanabara Koogan; 2003. p. 43-57.
28. Sleifer P, Costa SS, Cóser PL, Goldani MZ, Dornelles C, Weiss K. Auditory brainstem response in premature and full-term children. Int J Pediatr Otorhinolaryngol. 2007;71(9):1449-56.