ANALYSING THE GYRATORY COMPACTION DESIGN LEVEL FOR
A DENSE MIXTURE AND A STONE MASTIC ASPHALT
Dinis Gardete
Escola Superior de Tecnologia de Castelo Branco Av. Empresário, 6000-077 CASTELO BRANCO, Portugal
E-mail: dgardete@ipcb.pt Luís de Picado Santos
CESUR-DECivil, Instituto Superior Técnico da Universidade Técnica de Lisboa Av. Rovisco Pais 1, 1049-001 LISBOA, Portugal
E-mail: picado.santos@civil.ist.utl.pt Silvino Capitão
Instituto Superior de Engenharia, I. Politécnico de Coimbra & CESUR-DECivil IST Rua Pedro Nunes - Quinta da Nora, 3030-199 COIMBRA,Portugal
E-mail: capitao@isec.pt
ABSTRACT
The achievement of a desired level of bituminous mixtures’ performance is an important issue to increase the durability of pavements and to reduce maintenance costs as well as its impacts. A decisive stage is the mixture design process, in particular the choice of bitumen content to be used. This parameter can affect all the major performance properties of the mixtures. In Portugal, the Marshall method is used for bituminous mixtures design. This is an empirical method which has some drawbacks in the design of non-traditional mixtures as well as some limitations to represent in-service conditions (for example the compaction of the mixtures). Many countries have been using a volumetric design method to overcome these drawbacks. The adoption of a more efficient design methodology can improve the durability of pavements, leading to important costs saving and environmental impact reduction throughout the pavement’s life cycle. However, there is a great experience with the use of the current mix design methods and the mixture’s in-service performance is thought to be generally adequate in most cases. Therefore, the compositions obtained with the current methods are regarded as a reference in the analysis of the volumetric design method. In this project a Portuguese typical dense graded bituminous mixture used in base and binder layers as well as a Stone Mastic Asphalt (SMA) mixture were formulated by the Marshall method and by the volumetric design method. The mixture’s volumetric properties were evaluated and compared with threshold values from available standards and other specifications. The results of the design processes are compared regarding the volumetric properties of the mixtures.
1 INTRODUCTION
The traditional methods used for bituminous mixture design have major drawbacks which result essentially from the empirical nature of the tests on which they were based. To overcome this problem the design methodologies are including performance or fundamental tests. However some of these tests are to some extent expensive, require complex equipment and in some cases there is a lack of experience with their use. Even with the implementation of this type of tests, a simple base design process that can provide a reasonable estimation of the binder content that could achieve a desired level of performance for the in-service
conditions, should be regarded as a essential part of the design methodology because it can save time and effort in the following performance analysis of the mixtures. The Strategic Highway Research Program (SHRP) has developed the Superpave system. In this process the optimum bitumen content is selected on the basis of the mixtures’ volumetric properties obtained from specimens moulded by a gyratory compactor. Some authors indicate that lower optimum bitumen contents were obtained with this methodology (Neubauer and Partl, 2004).
This is in part because the Ndesign levels defined imply high compaction effort. This has led to
mixtures with good permanent deformation resistance but lacking adequate fatigue resistance (TRB, 2005).
Since the implementation of the original Superpave specifications the levels of compaction for mixture design have decreased. Studies indicated that the recommended levels reached densities above the values measured in pavements and they were also higher than the values of the locking point which generally is between 60 and 90 gyrations. Some authors have recommended that for a better balance between permanent deformation resistance and fatigue
resistance Ndesign should be in the range of 75 to 85 gyrations (NCHRP, 2007; Prozzi and
Aguiar, 2007).
The use of a more flexible design method that can be applied to a broad range of bituminous mixtures can contribute to reduce the variability and complexity of procedures and equipments used. It is advisable that new methodologies should give optimum bitumen content values in the range of the currently used. In this study two mixtures, a typical Portuguese dense mixture and a SMA, where designed with the current methods and with a volumetric design method. The objective was to analyze the range of values for the compaction effort in the gyratory compactor that produce mixtures with an expected performance similar to the ones obtained with the current design methods.
2 MATERIALS
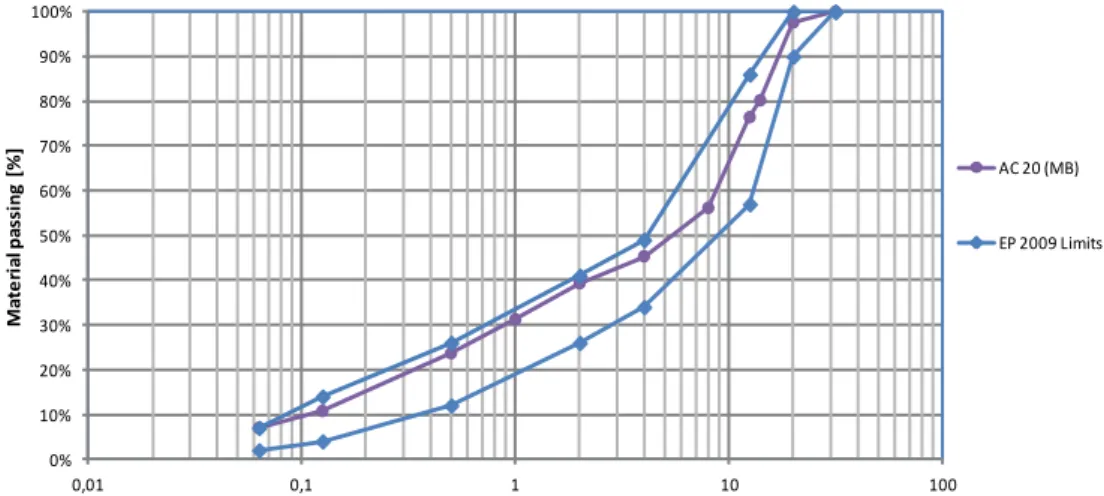
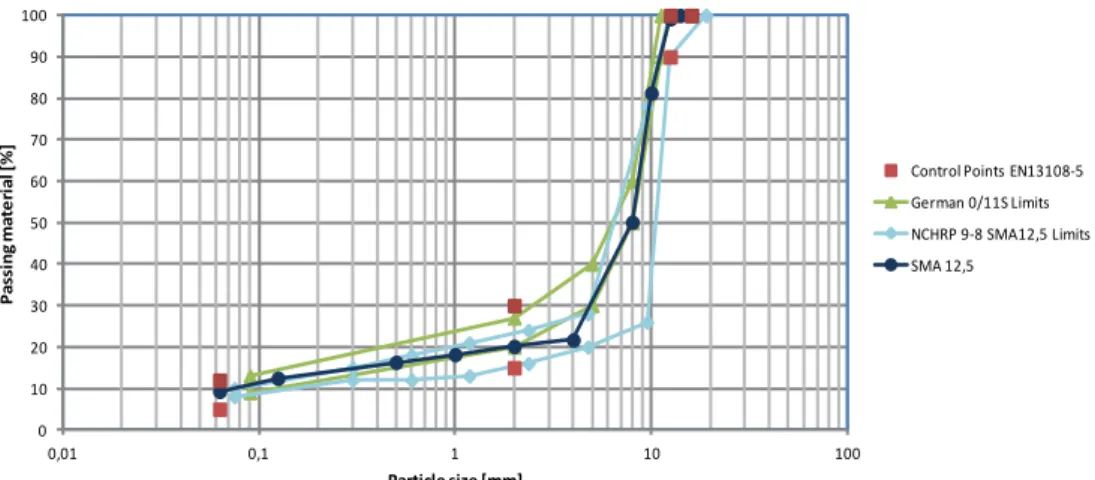
Two mixtures were used in this project: a typical Portuguese mixture AC 20 (MB), which is used in base or binder layers, and a SMA 12.5 mixture for wearing course layers. The mixtures were produced with granitic aggregates and a 35/50 paving grade bitumen with a penetration of 42.2 0.1 mm and a softening point of 53.5 ºC. The gradation limits used for the AC 20 mixture are defined in the Portuguese road administration specifications (Estradas de Portugal, 2009) and for the SMA the gradation follows the standard EN 13108-5 (CEN, 2006), the German specifications (Drüschner and Schäfer, 2000) and the NCHRP 9-8 specifications (Prowell et al., 2009) as reference. The gradation curves of the mixture AC 20 (MB) and the SMA 12.5 are presented in Figure 1 and Figure 2, respectively.
Figure 1: Gradation of the mixture AC 20 (MB). 0% 10% 20% 30% 40% 50% 60% 70% 80% 90% 100% 0,01 0,1 1 10 100 M at e ri al p assi n g [ % ] Particle size [mm] AC 20 (MB) Gradation AC 20 (MB) EP 2009 Limits
Figure 2: Gradation of the mixture SMA 12.5.
Cellulosic fibers were used in the SMA mixture as stabilizing additive to prevent the drainage of the bitumen. The percentage of fibers used was 0.3% (total weight of the mixture). The fibers are supplied in pellets obtained by mixing the cellulosic fibers with bitumen. In the pellets the bitumen can reach 10% of the weight. Taking this fact into account the percentage of incorporation of the pellets was 0.33%. In asphalt production plants the pellets are added to the aggregate before the bitumen. The heat and mechanical action of the mixture process causes the pellets to break down and the fibers are spread in the mixture. In laboratory the mixing process tends to be less effective. Therefore the pellets were dried at 105 °C and then mashed manually. The fibers were first mixed with the hot aggregate and the bitumen was added after.
3 MARSHALL DESIGN METHOD
The Marshall Design Method is currently used in the design of hot bituminous mixtures in Portugal. In this method cylindrical specimens with a diameter of 101.6 mm and 63.5 mm are moulded. The compaction of the specimens is carried out by an impact compactor. The number of blows can vary with the traffic estimated for the pavement between 35 and 75 blows on each side of the specimen. In Portugal the number of blows does not vary with the expected traffic for the pavement and, hence, for traditional mixtures 75 blows on each side are always used (Estradas de Portugal, 2009). In this project, the mixing and compaction temperatures used in the laboratory were 155 °C and 145 °C, respectively.
3.1 Mixture AC 20 (MB)
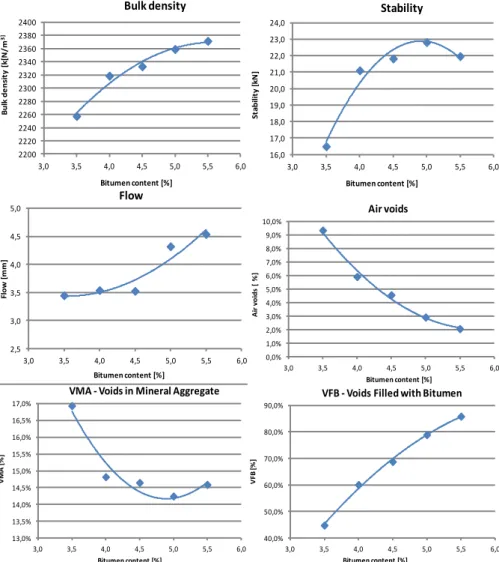
This is a traditional dense graded hot bituminous mixture. Five bitumen contents were tested, from 3.5 to 5.5% with steps of 0.5%. The results obtained are presented in Figure 3.
0 10 20 30 40 50 60 70 80 90 100 0,01 0,1 1 10 100 Pa ssi n g m at e ri al [% ] Particle size [mm] SMA 12,5 Garadation
Control Points EN13108-5 German 0/11S Limits NCHRP 9-8 SMA12,5 Limits SMA 12,5
Figure 3: Results from the Marshall design method for the mixture AC 20 (MB).
The optimum bitumen content determined as the average of the bitumen contents that gives the maximum bulk density (taken as 5.5%), maximum stability (taken as 4.8%) and the median air void content. The Portuguese road administration specifications refer that for this mixture the air voids should be between 3 and 6%, thus the median value is 4.5% (corresponding to a bitumen content of 4.4%). The optimum bitumen content obtained is 4.9%.
3.2 Mixture SMA 12.5
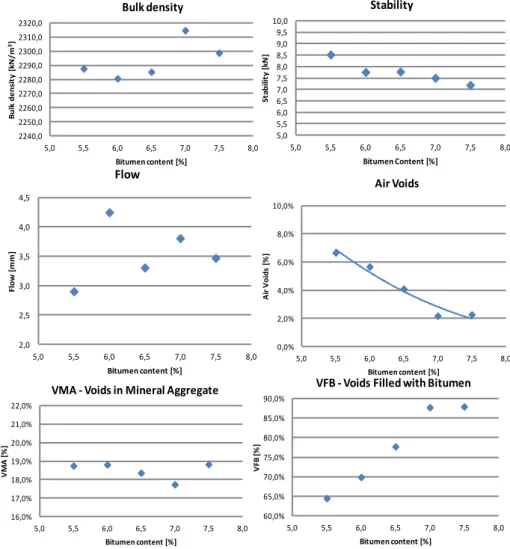
SMA mixtures are generally designed using recipe type methodologies in which the optimum bitumen content is determined by analysis of the voids in Marshall specimens (Drüschner and Schäfer, 2000). This was the method adopted in this project. According to this procedure the mixture porosity is determined on Marshall specimens compacted with 50 blows on each side. This was carried out for five bitumen contents from 3.5 to 5.0% with steps of 0.5%.
The standard EN 12697-6 (IPQ, 2003) states that the determination of bulk density, in the case of mixtures type SMA, must be performed on sealed specimens if the air voids content is greater than 4%. Therefore, the specimens were sealed by immersion in melted paraffin at a temperature of 60 °C. This creates a paraffin coat which seals the specimen, preventing the entry of water into its internal voids in order to better evaluate the bulk density. Since Marshall specimens were produced to carry out the aforementioned procedure, it was decided to perform the whole Marshall design methodology. Thus, specimens were tested in a
2200 2220 2240 2260 2280 2300 2320 2340 2360 2380 2400 3,0 3,5 4,0 4,5 5,0 5,5 6,0 Bulk density Bitumen content [%] B ul k de ns it y [k [N /m 3] 16,0 17,0 18,0 19,0 20,0 21,0 22,0 23,0 24,0 3,0 3,5 4,0 4,5 5,0 5,5 6,0 Stability Bitumen content [%] St abi lit y [k N ] 2,5 3,0 3,5 4,0 4,5 5,0 3,0 3,5 4,0 4,5 5,0 5,5 6,0 Flow Bitumen content [%] Fl ow [ m m ] 0,0% 1,0% 2,0% 3,0% 4,0% 5,0% 6,0% 7,0% 8,0% 9,0% 10,0% 3,0 3,5 4,0 4,5 5,0 5,5 6,0 Air voids Bitumen content [%] A ir v oi ds [ % ] 13,0% 13,5% 14,0% 14,5% 15,0% 15,5% 16,0% 16,5% 17,0% 3,0 3,5 4,0 4,5 5,0 5,5 6,0 VMA - Voids in Mineral Aggregate
Bitumen content [%] V M A [ % ] 40,0% 50,0% 60,0% 70,0% 80,0% 90,0% 3,0 3,5 4,0 4,5 5,0 5,5 6,0 VFB - Voids Filled with Bitumen
Bitumen content [%]
V
FB
[%
Marshall stabilometer for determining their stability and flow values. Figure 4 shows the results obtained, namely, the variation with the bitumen content of the bulk density, Marshall’s stability, Marshall’s flow, volume of air voids, voids in mineral aggregate (VMA) and voids filled by bitumen (VFB).
Figure 4: Results from the Marshall design method for the mixture SMA 12.5.
In Germany it is recommended a minimum bitumen content of 6.5% for 0/11S SMA mixtures. The optimum bitumen content is selected so that the volume of voids in the Marshall specimens is between 3.0 and 4.0% (Drüschner and Schafer, 2000). Therefore, for the studied mixture the bitumen content should be in the range of 6.5 to 7.0%. As the design target volume of voids was 4% consequently the optimum bitumen content was 6.5%.
It can be observed in Figure 4 that the traditional Marshall formulation is not adequate for SMA mixtures. It is often referred to that low values of the Marshall stability can suppose, incorrectly, these mixtures to have poor permanent deformation resistance (Drüschner and Schafer, 2000). The stability values are between 7.0 and 8.5 kN which are considerably lower than the values found for the AC 20 (MB) mixture. Due to the high bitumen content the stability values decrease as bitumen content increases. Although the opposite tendency is observed for the flow values and they are very similar to the ones obtained for the dense mixture. These results can indicate that the SMA has an aggregate structure with good stone to stone contact. Moreover, the trend observed for the bulk density is not clear, while the values of VMA are higher than those obtained in the dense mixture, as expected.
2240,0 2250,0 2260,0 2270,0 2280,0 2290,0 2300,0 2310,0 2320,0 5,0 5,5 6,0 6,5 7,0 7,5 8,0 B ul k de ns it y [k N /m 3] Bitumen content [%] Bulk density 5,0 5,5 6,0 6,5 7,0 7,5 8,0 8,5 9,0 9,5 10,0 5,0 5,5 6,0 6,5 7,0 7,5 8,0 St abi lit y [k N ] Bitumen Content [%] Stability 2,0 2,5 3,0 3,5 4,0 4,5 5,0 5,5 6,0 6,5 7,0 7,5 8,0 Fl o w [ m m ] Bitumen content [%] Flow 0,0% 2,0% 4,0% 6,0% 8,0% 10,0% 5,0 5,5 6,0 6,5 7,0 7,5 8,0 A ir V oi ds [ % ] Bitumen content [%] Air Voids 16,0% 17,0% 18,0% 19,0% 20,0% 21,0% 22,0% 5,0 5,5 6,0 6,5 7,0 7,5 8,0 V M A [ % ] Bitumen content [%]
VMA - Voids in Mineral Aggregate
60,0% 65,0% 70,0% 75,0% 80,0% 85,0% 90,0% 5,0 5,5 6,0 6,5 7,0 7,5 8,0 V FB [% ] Bitumen content [%]
The design of SMA mixtures requires the analysis of the bitumen drainage. The bitumen drainage can occur during hot storage or during transport and this fact can affect the mixtures and cause pathologies to the pavement. To evaluate the drainage of the bitumen the Schellenberg test was performed, as described in the EN 12697-18 (CEN, 2004).
This test is performed at a temperature 25 ° C above the mixing temperature. Thus, the test was performed for the composition with the optimum binder content, 6.5% of bitumen, and at a temperature of 180 °C. A drainage value of 0.28% was measured. Despite that this value is within the admissible range defined in some specifications, it should be reduced for pavement construction by increasing the fibber content.
4 VOLUMETRIC DESIGN METHOD
In the same way as in the Marshall method, in the volumetric design method, for a given gradation, trial compositions with different binder contents are tested. In the volumetric method the mixtures are compacted by a gyratory compactor. The determined densities of specimens allow drawing compaction curves. The optimum binder content is selected as the one that yields a target air voids content in the mixture for the compaction level defined for design.
The production of the specimens was similar to that used for the Marshall specimens. For both mixtures the mixing temperature was 155 °C. After mixing the mixture was placed in an oven for 2 hours at 145 ºC, which was the compaction temperature, according to the short-term aging procedure set in the AASHTO R30 (AASHTO, 2002). Compaction was performed according to the standards AASHTO T312 (AASHTO, 2004) and EN 12697-31 (CEN, 2007). The compaction pressure was 600 kPa, the dynamic angle was 1.25º (corresponding to an internal dynamic angle (DIA) of 1.16º) and the rotation speed of 30 rpm. Specimens of 150 mm diameter and 115 mm of height were produced in this phase of the study.
4.1 Mixture AC 20 (MB)
The results achieved in the volumetric design are shown in Figure 5Fel! Hittar inte
referenskälla.. The gyratory compactor measures the evolution of voids during the
compaction process, which depends on the variation of specimen’s height. Using this data it is possible to estimate the optimum bitumen percentage which would be obtained considering
different values Ndesign. This process induces errors in estimating the volume of voids because
densities tend to be higher than estimated in particular for SMA because the lateral surface of the specimen has a significant amount of voids (Mallick et al., 1998). However, since the
analysis was made for values close to the selected Ndesign one can consider that the estimated
values will be similar to those that would be actually measured, therefore, the errors obtained from the applied approach are not significant. For this mixture the compaction was carried out until 125 gyrations, which is the value used in many American state Departments of
Figure 5: Results of the volumetric design method for the mixture AC 20 (MB).
From the results the optimum binder content for Ndesign of 125 gyrations is 4.3%.This
bitumen content is lower than the achieved in the Marshall method. The use of high levels of compaction in the gyratory compactor leads to the use of lower bitumen contents. This confirms the aforementioned idea that the mixtures generally have more resistance to permanent deformation but lower fatigue resistance. Some authors refer that the use of lower levels of compaction can offer a better equilibrium in the properties of the bituminous mixtures. The optimum binder contents for a range of compaction levels were determined. The results are shown in Figure 6. An optimum binder content of 4.9%, equal to the Marshall
method, is achieved for an Ndesign of 53 gyrations. Therefore, for the studied mixture this level
of compaction would provide a composition similar to the used in the current practice.
Figure 6: Optimum bitumen content as a function of the number of gyrations for the AC 20 (MB) mixture.
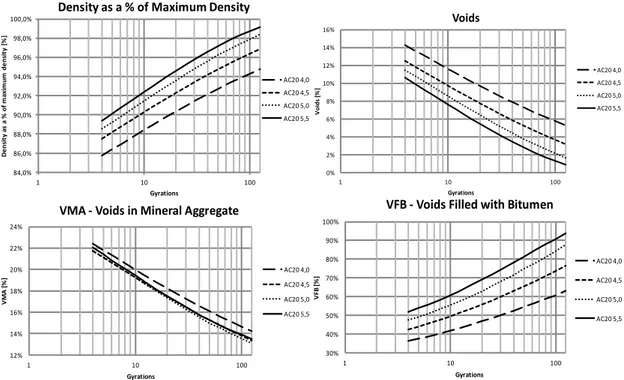
Figure 7 and Figure 8 show the variation of voids, VMA and VFB in the mixture with the number of gyrations for the bitumen contents used. The figures also display the results obtained for the Marshall specimens. It can be seen that the volumetric properties of the
84,0% 86,0% 88,0% 90,0% 92,0% 94,0% 96,0% 98,0% 100,0% 1 10 100 D e ns it y as a % of m ax im um de ns it y [% ] Gyrations
Density as a % of Maximum Density
AC20 4,0 AC20 4,5 AC20 5,0 AC20 5,5 0% 2% 4% 6% 8% 10% 12% 14% 16% 1 10 100 V oi ds [ % ] Gyrations Voids AC20 4,0 AC20 4,5 AC20 5,0 AC20 5,5 12% 14% 16% 18% 20% 22% 24% 1 10 100 V M A [ % ] Gyrations
VMA - Voids in Mineral Aggregate
AC20 4,0 AC20 4,5 AC20 5,0 AC20 5,5 30% 40% 50% 60% 70% 80% 90% 100% 1 10 100 V FB [% ] Gyrations
VFB - Voids Filled with Bitumen
AC20 4,0 AC20 4,5 AC20 5,0 AC20 5,5 0 20 40 60 80 100 120 140 4,2% 4,4% 4,6% 4,8% 5,0% 5,2% N um be r of G yr at ion Bitumen Content
Optimum Bitumen Content
Optimum Bitumen Content
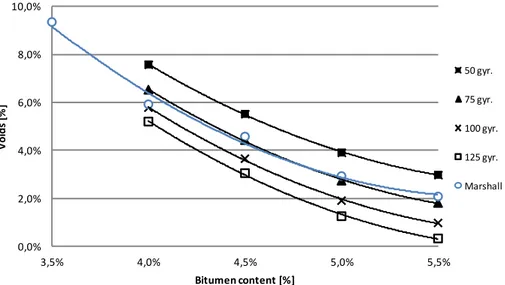
Marshall specimens are very close to the achieved in gyratory compaction for 75 gyrations. This occurred for all the bitumen contents used.
Figure 7: Variation of voids with bitumen content in the AC 20 (MB) mixture moulded with different levels of compaction (gyratory compactor) and compacted with 75 blows on each side (Marshall method).
Figure 8: VMA and VFB in the AC 20 (MB) mixture.
4.2 Mixture SMA 12.5
In 1994 a Task Force of the FHWA published guidelines for the design of SMA mixtures, the "Guidelines for Materials, Production, and Placement of Stone Matrix Asphalt (SMA)". The guidelines recommended the design using Marshall specimens compacted with 50 blows per side. In 1999 these guidelines were revised in the publication "Designing and Constructing SMA Mixtures - State-of-the-Practice" in which it was included a volumetric design based on
gyratory compaction with Ndesign of 100 gyrations. Later studies, conducted mostly by the
DOT’s of Texas and Georgia, indicated that a compaction level of 100 gyrations was excessive because it led to optimal bitumen contents lower than the desired, recommending
the use of values between 50 and 75 gyrations for NDesign (Xie, 2006). Although the most
common Ndesign level in the American DOT’s is 50 gyrations, the levels actually vary between
50 and 100 gyrations. The selected level of compaction used in the specimen’s production here was 50 gyrations. A target volume of voids of 4% was used to select the optimum bitumen content.
As done in the Marshall method, the gyratory specimens were also sealed with paraffin to determine their density. The sealing of the specimens is more difficult when compared to Marshall specimens because of their size.
0,0% 2,0% 4,0% 6,0% 8,0% 10,0% 3,5% 4,0% 4,5% 5,0% 5,5% V o id s [% ] Bitumen content [%] 50 gyr. 75 gyr. 100 gyr. 125 gyr. Marshall 12,0% 12,5% 13,0% 13,5% 14,0% 14,5% 15,0% 15,5% 16,0% 16,5% 17,0% 3,5% 4,0% 4,5% 5,0% 5,5% V M A [ % ] Bitumen content[%] 50 gyr. 75 gyr. 100 gyr. 125 gyr. Marshall 40,0% 50,0% 60,0% 70,0% 80,0% 90,0% 100,0% 3,5% 4,0% 4,5% 5,0% 5,5% V FB [% ] Bitumen Content [%] 50 gyr. 75 gyr. 100 gyr. 125 gyr. Marshall
The results obtained for the volumetric properties of the gyratory compactor specimens are
shown in Figure 9. It can be seen that for an Ndesign level of 50 gyrations the optimum binder
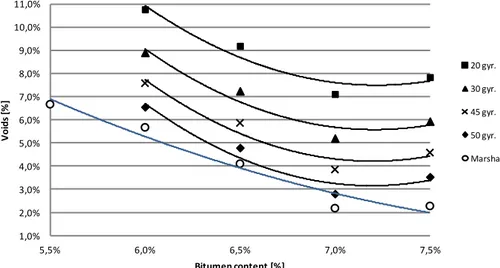
content is 6.6%. This value is slightly higher than that obtained with the Marshall specimens which was 6.5%. Comparing the results for both methods, with the mixture and procedures described before, it can be concluded that the results obtained for the design with the Marshall specimens will be achieved with a compaction effort slightly higher than 50 gyrations (52 gyrations) in the gyratory compactor. In Figure 10 and Figure 11 the variations of the volume of voids, VMA and VFB are shown for different levels of compaction.
Figure 9: Results of the volumetric design method for the mixture AC 20 (MB).
Figure 10: Variation of voids with bitumen content in the SMA 12.5 specimens for several levels of compaction (gyratory compactor) and compacted with 50 blows on each side (Marshall’s specimens). 80,0% 82,0% 84,0% 86,0% 88,0% 90,0% 92,0% 94,0% 96,0% 98,0% 1 10 D e nsi ty a s a % of m ax im um de nsi ty [% ] Gyrations
Density as a % of Maximum Density
SMA 6,0 SMA 6,5 SMA 7,0 SMA 7,5 2% 4% 6% 8% 10% 12% 14% 16% 18% 20% 1 10 V o ids [% ] Gyrations Voids SMA 6,0 SMA 6,5 SMA 7,0 SMA 7,5 17% 19% 21% 23% 25% 27% 29% 31% 1 10 V M A [% ] Gyrations
VMA - Voids in mineral Aggregate
SMA 6,0 SMA 6,5 SMA 7,0 SMA 7,5 30% 40% 50% 60% 70% 80% 90% 1 10 V FB [% ] Gyrations
VFB - Voids Filled with Bitumen
SMA 6,0 SMA 6,5 SMA 7,0 SMA 7,5 1,0% 2,0% 3,0% 4,0% 5,0% 6,0% 7,0% 8,0% 9,0% 10,0% 11,0% 5,5% 6,0% 6,5% 7,0% 7,5% V oi ds [ % ] Bitumen content [%] 20 gyr. 30 gyr. 45 gyr. 50 gyr. Marshall
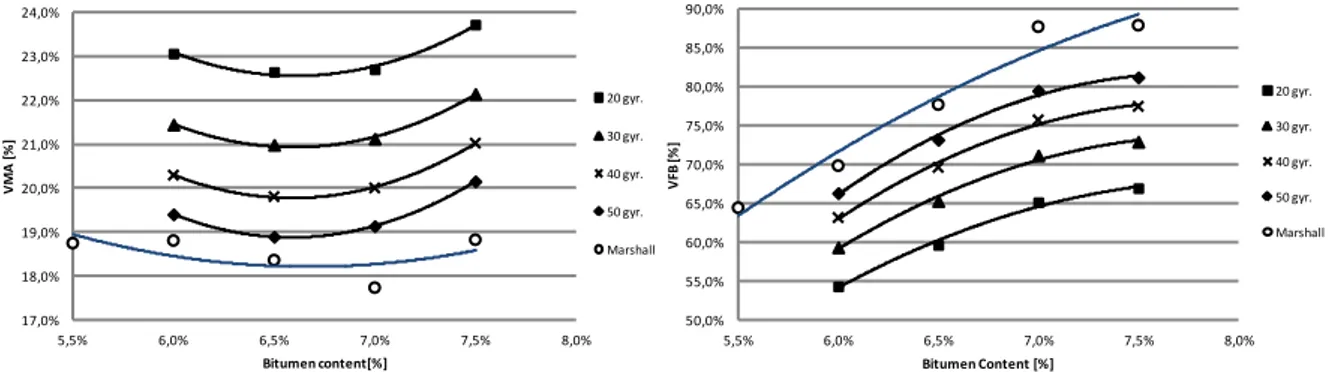
Figure 11: Variation of the VMA and VFB for the SMA 12.5 mixture.
Albeit the optimum binder content is very similar in both procedures, the compaction level used in the gyratory compactor for design should be higher than 50 gyrations to be achieved an optimum binder equal to the one achieved with the Marshall specimens. Differences
between the two methods seem to be more significant for VMA and VFB. However, an Ndesign
level of 50 is thought to be adequate to SMA mixtures.
4.3 Analysis of results
The results obtained with the two methods and for several design parameters were compared with the limit values defined in standards specifications. Table 1 shows the results obtained for the AC 20 (MB) mixture. As mentioned before, the number of gyrations that provides the same optimum bitumen content than the one obtained in the Marshall method is 53 gyrations. However, a level of compaction of 75 gyrations leads to volumetric properties closer to the obtained by the Marshall design method. The contribution of the Marshall’s stability and bulk density to the determination of the optimum binder content, together with the fact that the compaction methods have significant differences can explain this difference.
Table 1: Properties of the AC 20 (MB) mixture for different design procedures and limit values defined in specifications for similar mixtures.
Properties EP 2009 AC 20 (MB) specifications AC 20 (MB) (Marshall) AC 20 (MB) (50 gyr.) AC 20 (MB) (60.gyr.) AC 20 (MB) (75.gyr.) Bitumen content [%] ≥3.5 4.9 5.0 4.8 4.6 Marshall stability [kN] 7.5≤ S ≤21* 22.9 --- --- --- Marshall flow [mm] 2≤ F ≤4 4.0 --- --- --- Marshall quotient [kN/mm] ≥2 5.7 --- --- --- Volume of voids* [%] 3≤ V ≤6 3.1 4.0 4.0 4.0 VMA [%] ≥14 14.2 15.0 14.7 14.3 VFB [%] --- 77.2 79.9 73.3 67.5
* - Maximum value defined for granite aggregates
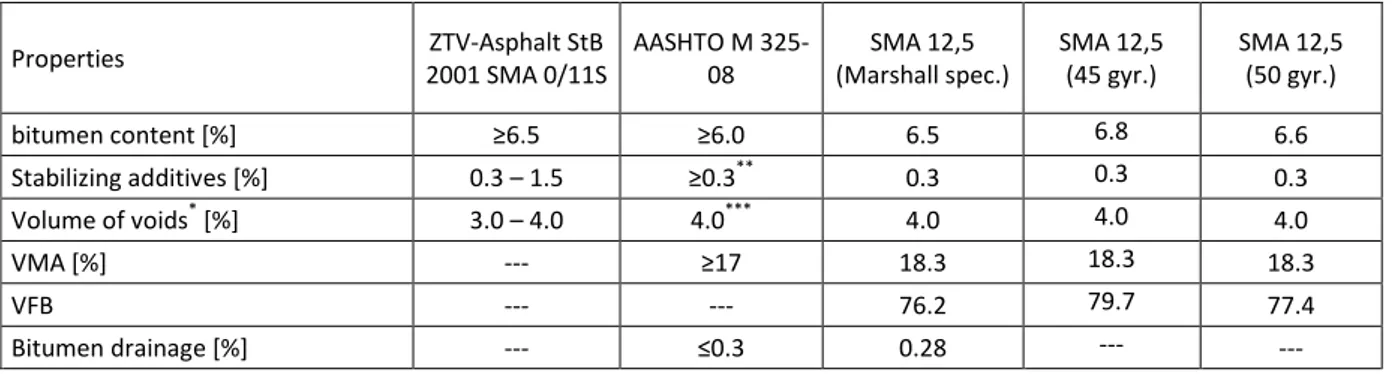
Table 2 presents the comparison of the values obtained for the designed SMA 12.5 mixture, determined from different design procedures, with threshold values defined in existing specifications, namely ZTV-Asphalt StB 01 (Drüschner and Schäfer, 2000) and AASHTO M 325-08 (AASHTO, 2008). A level of compaction of 50 gyrations gives a mixture with similar volumetric properties than those obtained from the Marshall specimens.
17,0% 18,0% 19,0% 20,0% 21,0% 22,0% 23,0% 24,0% 5,5% 6,0% 6,5% 7,0% 7,5% 8,0% V M A [ % ] Bitumen content[%] 20 gyr. 30 gyr. 40 gyr. 50 gyr. Marshall 50,0% 55,0% 60,0% 65,0% 70,0% 75,0% 80,0% 85,0% 90,0% 5,5% 6,0% 6,5% 7,0% 7,5% 8,0% V FB [% ] Bitumen Content [%] 20 gyr. 30 gyr. 40 gyr. 50 gyr. Marshall
Table 2: Properties of the SMA 12.5 mixture for different design procedures and limit values defined in specifications for similar mixtures.
Properties ZTV-Asphalt StB 2001 SMA 0/11S AASHTO M 325-08 SMA 12,5 (Marshall spec.) SMA 12,5 (45 gyr.) SMA 12,5 (50 gyr.) bitumen content [%] ≥6.5 ≥6.0 6.5 6.8 6.6 Stabilizing additives [%] 0.3 – 1.5 ≥0.3** 0.3 0.3 0.3 Volume of voids* [%] 3.0 – 4.0 4.0*** 4.0 4.0 4.0 VMA [%] --- ≥17 18.3 18.3 18.3 VFB --- --- 76.2 79.7 77.4 Bitumen drainage [%] --- ≤0.3 0.28 --- ---
* - In Marshall specimens compacted with 50 blows in each side ** - In the case of mineral fibers it is recommended a minimum of 0.4% *** - In roads with light traffic in can be use a target volume of voids of 3%
The locking point of the mixtures was determined, as shown in Table 3. The locking point can be defined as the point where the sample being gyrated loses less than 0.1 mm in height between three successive gyrations. For the AC 20 (MB) mixture the values were between 74 and 81. There is a slight increase of the locking point with the bitumen content. However this parameter is essentially related to the actual gradation characteristics of the mixtures.
Therefore a maximum Ndesign of 75 to 80 gyrations could be adequate to this mixture even for
heavy duty pavements. For the SMA 12.5 the locking point was not reached in 50 gyrations in none of the samples tested.
Table 3: Locking point values and bulk density (as a percentage of the maximum density) for the locking point, mixture AC 20 (MB).
Properties AC 20 (MB) Pb =4.0% AC 20 (MB) Pb =4.5% AC 20 (MB) Pb =5.0% AC 20 (MB) Pb =5.5%
Locking point [gyrations] 74 78 79 81
Bulk density % of maximum density [%] 93.6 95.9 97.4 98.4
5 CONCLUSIONS AND FUTURE WORK
Two very different bituminous mixtures were evaluated in this study based on the Ndesign level, which would provide mixtures with similar properties than those obtained from the current design methods. For the AC 20 (MB) mixture tested in this project the same optimum
bitumen content would be reached with an Ndesign of 50 gyrations, despite that the same
volumetric properties would be reached with an Ndesign of 75 gyrations. The values obtained
for the locking point are also in the range of 75 to 80 gyrations. Therefore, an Ndesign in line
with these values could be adequate for the design of this type of mixture. These values are lower than the currently recommended in the Superpave specifications but they agree with other referred in some studies made, regarding the use of volumetric design methods.
For the SMA 12.5 mixture there is a similarity between the optimum binder content obtained with the Marshall specimens and using gyratory compacted specimens with 50 gyrations. In both methods the designed mixtures have values for the volumetric properties within the range expected to SMA and they generally meet the allowable range defined in the specifications.
In the future, it is intended to analyze the performance of mixtures in laboratory, in particular, regarding permanent deformation, fatigue, water sensitivity and stiffness. With these results it will be possible to correlate the design parameters with the mixtures’
laboratory performance and draw recommendations on the adequate design values that will meet the expected performance of the mixtures.
REFERENCES
AASHTO (2008). Standard Specification for Stone Matrix Asphalt (SMA). AASHTO standard M-325. American Association of State Highway and Transportation Officials, Washington D. C.
AASHTO (2004). Standard Method of Test for Preparing and Determining the Density of Hot-Mix Asphalt (HMA) Specimens by Means of the Superpave Gyratory Compactor. AASHTO standard T 312. American Association of State Highway and Transportation
Officials, Washington D. C.
AASHTO (2002). Standard Practice for Mixture Conditioning of Hot-Mix Asphalt (HMA). AASHTO standard R-30. American Association of State Highway and Transportation
Officials, Washington D. C.
CEN (2007). Bituminous Mixtures - Test Methods For Hot Mix Asphalt - Part 31: Specimen Preparation By Gyratory Compactor. EN 12697-31. European Committee For
Standardization, Brussels.
CEN (2006). Bituminous mixtures – Material Specifications – Part 5: Stone Mastic Asphalt. EN 13108-5, European Committee for Standardization, Brussels.
CEN (2004). Bituminous Mixtures - Test Methods for Hot Mix Asphalt - Part 18: Binder drainage. EN 12697-18, European Committee for Standardization, Brussels.
Drüschner, L. and Schäfer, V. (2000). Stone Mastic Asphalt. German Asphalt Association, Bonn.
Estradas de Portugal (2009). Caderno de Encargos Tipo Obra. Estradas de Portugal, Almada. IPQ (2003). Misturas Betuminosas - Métodos de ensaio para misturas betuminosas a quente -
Parte 6: Determinação da baridade de provetes betuminosos. NP EN 12697-6, Instituto
Português da Qualidade, Caparica.
Mallick, R., Buchanan, S., Brown, E. and Huner, M. (1998). An Evaluation of Superpave Gyratory Compaction of Hot Mix Asphalt. NCAT Report No. 98-5, National Center for
Asphalt Technology, Auburn.
NCHRP (2007). Report 573 - Superpave Mix Design: Verifying Gyration Levels in the Ndesign Table (NCHRP 9-9). Transportation Research Board, Washington D.C.
Neubauer, O. and Partl, M. (2004). Impact of Binder Content On Selected Properties Of Stone Mastic Asphalt. Proceedings of the 3rd Eurasphalt & Eurobitume Congress, Vienna. Prowell, B, Watson D., Hurley G. and Brown, E. (2009). Evaluation of Stone Matrix Asphalt
(SMA) for Airfields Pavements. AAPTP 04-04 Final Report, National Center for Asphalt
Technology, Auburn.
Prozzi, J. and Aguiar, J. (2007). Método de Optimización del Número de Giros de Diseño Mediante Desempeño Relativo. Revista Infraestructura Vial. N.º 17, p. 35-45.
TRB (2005). SUPERPAVE – Performance by Design - Final Report of the TRB Superpave Committee. Transportation Research Board, Washington D. C.
Xie, H., Watson, D. and Brown, R. (2006). Evaluation of Two Compaction Levels for Designing Stone Matrix Asphalt. Transportation Research Record: Journal of the