Universidade de
Aveiro
2014
Departamento de Biologia
Sara Raquel Amaral
Mesquita
Biochar amendment as a strategy to reduce hydric
stress in Eucalyptus
Biochar como estratégia na redução do efeito da
seca em Eucalyptus
DECLARAÇÃO
Declaro que este relatório é integralmente da minha autoria, estando
devidamente referenciadas as fontes e obras consultadas, bem como
identificadas de modo claro as citações dessas obras. Não contém, por isso,
qualquer tipo de plágio quer de textos publicados, qualquer que seja o meio
dessa publicação, incluindo meios eletrónicos, quer de trabalhos académicos.
Universidade de Aveiro 2014
Departamento de Biologia
Sara Raquel Amaral
Mesquita
Biochar amendment as a strategy to reduce hydric
stress in Eucalyptus
Biochar como estratégia na redução do efeito da seca
em Eucalyptus
Dissertação apresentada à Universidade de Aveiro para cumprimento dos requisitos necessários à obtenção do grau de Mestre em Biologia Aplicada, realizada sob orientação científica da Doutora Glória Catarina Pinto, investigadora no CESAM (Centro de Estudos do Ambiente e do MAR) e do Departamento de Biologia da Universidade de Aveiro, e co-orientação do Doutor Franciscus Gert Anton Verheijen, investigador em pós doutoramento do CESAM e Departamento de Ambiente e Ordenamento da Universidade de Aveiro
Apoio financeiro da FCT – Fundação para a Ciência e Tecnologia, no âmbito do projeto EXPLOCHAR (PEst-C/MAR/LA0017/2013)
o júri
Presidente Professor Doutor João António de Almeida Serôdio
Professor Auxiliar do Departamento de Biologia da Universidade de Aveiro
Arguente principal Doutora Ana Catarina Gomes Marcelo Bastos
Bolseira de Pós-Doutoramento do CESAM da Universidade de Aveiro
Co-Orientador Doutor Franciscus Gert Anton Verheijen
Agradecimentos A concretização desta tese, concluindo mais uma etapa nesta vida, não teria sido possível sem a contribuição, direta ou indireta, de muitos aos quais devo um especial agradecimento:
Em primeiro lugar e aos mais importantes, ao papá e à mamã pela oportunidade e força que me deram e continuam a dar em seguir os meus sonhos e objetivos, pelas bases sólidas de valores humanos e éticos que me incutiram e por serem, indiscutivelmente, os melhores exemplos de vida a seguir. Ainda à Anita pelas gargalhadas, parvoíces e noites partilhadas e aos avós pelo carinho, preocupação e presença constantes, que em momentos de desânimo sempre me incentivaram a nunca a desistir.
Ao Dr. Jacob Keizer pela oportunidade e por me receber como parte da sua equipa de trabalho.
À Drª Glória Pinto e Dr. Frank Verheijen um enorme obrigado pela oportunidade e confiança depositadas, pela disponibilidade constante, cordialidade, recomendações e por serem, para mim, referências profissionais a seguir.
Agradeço também ao Grupo Leal & Soares – SIRO por me facultarem o espaço e condições necessárias à realização deste trabalho, em especial ao Eng. Hartmut Nestler pela amabilidade e disponibilidade constantes durante a realização do mesmo.
Um enorme obrigada à Cláudia Jesus, Joana Amaral e Pedro Monteiro pela preciosa e inesgotável alegria, força e espírito de companheirismo diários, fundamentais na execução deste trabalho. Ainda ao Flávio Silva e Hugo Vieira pela incansável ajuda prática e orientação estatística.
Ao Rui Costa, por me ter aparecido na vida e me ter mostrado o valor do trabalho, força e dedicação. Pelo carinho e incentivo contantes e por nunca ter duvidado de mim.
A eles, os melhores de todos: Catarina Domingues, Patrícia Fresco, Tânia Costa, Tânia Silva e Raul van Breda. Dos sorrisos às lágrimas e a todos os momentos de brincadeira, amizade e alegria que partilhamos. Obrigada pela vida e pela cor que trazem a todos os dias da minha existência!
palavras-chave Biochar, Ecofisiologia , Eucalyptus globulus, Seca, Nutrientes.
Resumo As concentrações de CO2 atmosférico têm atingido níveis alarmantes nas últimas décadas resultando no aquecimento global em conjunto com alterações climatéricas generalizadas. O stress hídrico é uma das maiores consequências destas alterações, constituindo um disruptor direto dos fluxos hídricos e de carbono com efeitos na produção primária e equilíbrio de ecossistemas terrestres. Afeta as plantas a diferentes níveis dependendo da intensidade, duração e níveis de progressão, conduzindo a respostas a níveis fisiológicos, bioquímicos e moleculares. Estudos recentes, suportam a aplicação de biochar nos solos como estratégia de mitigação, visando promover a retenção de água e nutrientes. Assumindo a importância económica da espécie Eucalyptus globulus em Portugal e o crescente aumento de períodos de seca na região mediterrânica, o objetivo deste estudo foi avaliar o efeito de mitigação do biochar em Eucalyptus globulus sujeitos a limitação hídrica. Comparamos também o seu efeito com a utilização de fertilizantes sintéticos e da conjugação da utilização de ambos. Deste modo, 136 plantas de E.globulus foram sujeitas a um período experimental de 6 semanas, divididas por 2 grupos (sem limitação de água – 80% de capacidade de campo e com limitação de água – 30% de capacidade de campo), cada um constituído por 4 tratamentos: sem biochar, com biochar (6%), sem biochar+ fertilizante e com biochar+fertilizante. No final do ensaio, as plantas foram avaliadas ao nível morfológico, fisiológico e bioquímico. Os resultados deste estudo indicam um decréscimo na maioria dos parâmetros analisados em condições de limitação de água, nomeadamente ao nível das trocas gasosas, potencial hídrico, altura, níveis de transpiração, fotossíntese, número de folhas, área das folhas, peso de biomassa aérea e peso das raízes, o que sugere que a limitação de água afeta severamente a performance da planta. A aplicação do biochar promove o aumento de área das folhas e níveis fotossintéticos, juntamente com uma diminuição no conteúdo de açucares totais (TSS) e um ligeiro aumento dos valores de potencial hídrico, sugerindo que em condições limitantes de água, a aplicação de biochar a 6% promove a habilidade de retenção de água pelos solos, reduzindo os efeitos gerais de stress nas plantas. Em condições de controlo, sem limitação de água, as plantas sujeitas a aplicação de biochar apresentaram sinais atípicos de murchidão apical, bem como baixos níveis de fotossíntese e morfológicos gerais, quando comparados com a utilização de fertilizantes, nas mesmas condições, sugerindo que em condições de rega abundante a aplicação de fertilizante é preferível ao biochar. Os resultados da conjugação do biochar+ fertilizantes mostraram baixa performance da planta, comparativamente à aplicação em separado, nomeadamente ao nível da área folear, número de folhas, peso das raízes, fotossíntese, trocas gasosas e carotenoides, em condições de limitação de água. Em conclusão, os nossos resultados indicam que o biochar tem um efeito mitigante em condições de limitação de água para E.globulus, no entanto a sua aplicação não representa uma mais valia em condições de rega abundante ou quando aplicado em conjugação com fertilizantes.
keywords Biochar, Ecophysiology, Eucalyptus globulus, Drought, Nutrients.
Abstract keywords
Atmospheric CO2 concentrations are higher than any time in the last decades, resulting in global warming along with general climactic changes. Drought stress is one of the most important effect of climactic alterations and directly disrupts water and carbon fluxes, with effects on primary production and terrestrial ecosystems equilibrium. It affects plants at different levels depending on intensity, duration and progression of drought, leading to responses at physiological, biochemical and molecular levels. The biochar application to the soils as a mitigation agent, by enhancing water and nutrient availability, has been well documented. Assuming the economic importance of Eucalyptus globulus in Portugal and the rising demand of dry periods in mediterranic region, the main goal of this study was to evaluate the ability of biochar to reduce the stress effects in Eucalyptus globulus plants, under water limiting conditions. We also evaluate the application of fertilizers in plant performance and the conjugation of both. For this propose, 136 plants of Eucalyptus globulus were subjected to a 6 weeks period assay, divided by 2 groups (well watered – 80% of field capacity and water stress - 30% of field capacity), which one with 4 treatments: without biochar, with biochar (6%), without biochar+fertilizer and with biochar+fertilizer. At the end of the experimental period, the plants were evaluated at morphological, physiological and biochemical levels. Our results showed a significant decrease in most of analysed parameters with water limitation, as gas exchanges, hydric potential, height, transpiration, lateral branches, leaf area and number of leaves, photosynthesis (except WSb), above ground biomass (fresh and dry) and weight of roots, suggesting that the water limitations severely affect plants performance. Biochar application improve leaf area and photosynthesis rates along with decreases the total soluble sugars content and slight higher values of water potential, suggesting that in water stress conditions it is beneficial to applied biochar into soils to enhance their ability to store and use water, reducing overall stress levels in the plants. In well watered conditions, the biochar showed wilting signals In well watered conditions the use of biochar promoted lower photosynthetic rates and lower values of all morphological parameters as above ground biomass, number of lateral branches and leaf area when compared with nutrients application, along with apical wilting signals suggesting that in in well water conditions, the use of biochar is not a better option. The results of conjugation of both biochar and fertilizers were contradictory. In well water conditions we found a higher values of Fv/Fm along with chlorophylls and lower values of number of leaves, leaf area, photosynthesis and TSS. Otherwise, in water stress conditions and besides the lower performance in all gas exchanges parameters, we noticed higher above ground biomass, when compared with biochar and fertilizer applied alone. In conclusion, our results shows that biochar amend water limitation conditions in E.globulus, but is not a main value for plant performance in well water conditions or when applied together with fertilizer. In either case, further studies are needed.
Table of Contents
Chapter I ... 25
General Introduction, Research Aims and Relevance ... 25
Economic importance of Eucalyptus globulus ... 25
Water deficit and its impacts on forests ... 27
Biochar as a strategy to mitigate hydric stress ... 31
Relevance and applications of the results ... 34
Aim and objective of this Study ... 35
Hypothesis ... 35
Organization of the thesis ... 35
Chapter II ... 37
Biochar amendment as a strategy to reduce hydric stress in Eucalypt plants ... 37
Abstract ... 37
Introduction ... 39
Materials and methods ... 41
Results ... 46
Discussion ... 59
Conclusions ... 67
Chapter III ... 69
Concluding Remarks, On-going Research and Recommendations for Future Studies ... 69
List of Figures
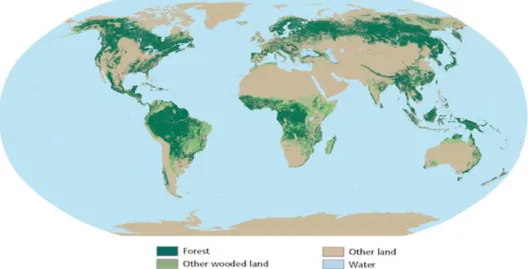
Fig.1- World forest area, wooded land and water in the world ... 25
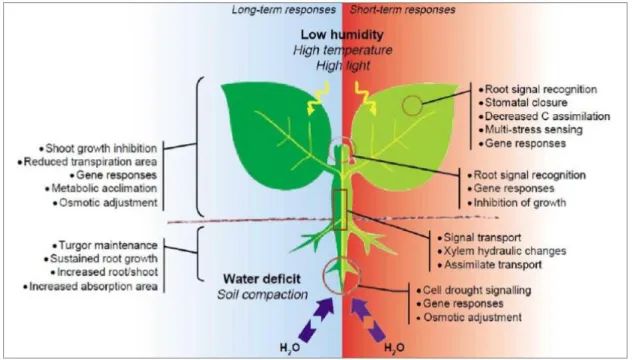
Fig.2-General plant responses to drought stress ... 31
Fig.3- Particle size distribution of soil and biochar (%)... 47
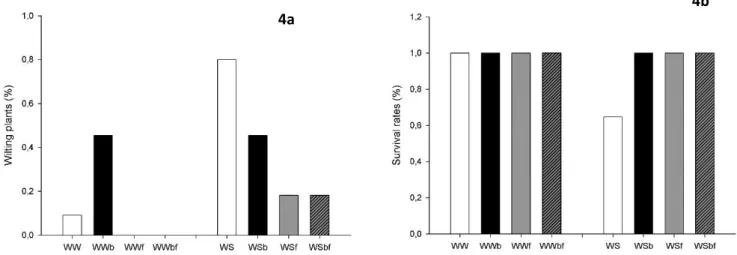
Fig.4- Wilting and Survival rates ... 48
Fig.4a- Wilting plants……….………..48
Fig.4b- Survival rates ……….……….48
Fig.5- Detailed of WSb wilting signals ... 48
Fig.6-General visual aspect plants ... 49
Fig.7-Morphological Parameters ... 50
Fig.7a- Lateral Branches ………50
Fig.7b- Weight of dry roots ……….50
Fig.7c- Leaf area ……….50
Fig.7d- Above ground biomass fresh ………...50
Fig.7e- Number of leaves ……….50
Fig.7f- Above ground height ………..……50
Fig.8-Hydric Potential ... 51
Fig.9-Gas exchanges ... 52
Fig.9a- Internal concentration of CO2 – Ci ……….…52
Fig.9b- Transpiration - E………..……….………….52
Fig.9c- Stomatal conductance - gs……….……….52
Fig.9d- Photosynthesis - A ………....…….52
Fig.10-Chlorophyll fluorescence ... 53
Fig.10a- Effective quantum yield - фPSII……….……….…53
Fig.10b- Maximum quantum yield – Fv/Fm………..…….……….………….53
Fig.11-Total content of Pigments ... 54
Fig.11a- Chlorophyll a ……….…54
Fig.11b- Chlorophyll b ………..…………..……….………….54
Fig.12-MDA content ... 55
Fig.13-Total soluble sugars ... 56
Fig.14-Variation coeffitient ... 56
Fig.15-Principal component analysis –PCA ... 58
List of Tables
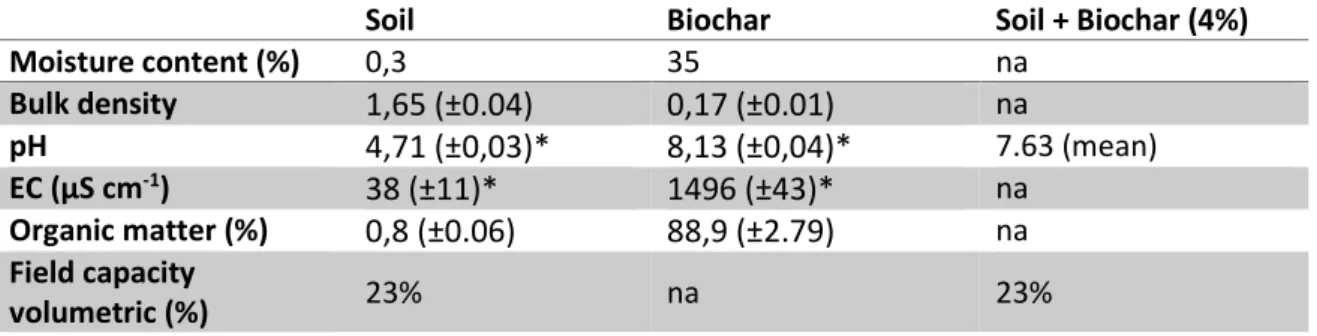
Table 1- Soil, biochar and biochar amended soil characterization ... 46List of Abbreviations
A – Photosynthesis
CEC – Cation exchange activity Ci – Internal concentration of CO2
Chla – Chlorophyll a Chlb – Chlorophyll b E – Transpiration
EC – Electric conductivity
Fv/Fm – Maximum quantum yield gs – Stomatal condutance
ha – hectare N - North
PCA – Principal component analysis фPSII – Effective quantum yield ROS – Reactive oxygen species TSS – Total soluble sugars UV – Ultra violet radiation W – West
WS - (Water Stress – no biochar) WSb - (Water Stress- with biochar)
WSbf - (Water Stress – with biochar and fertilizer) WSf - (Water Stress – with fertilizer)
WW - (Well Watered – no biochar) WWb - (Well Watered – with biochar);
WWbf - (Well Watered – with biochar and fertilizer) WWf - (Well Watered – with fertilizer)
List of Elements and Chemicals
Ca – Calcium
CO2 – Carbon dioxide
Cu – Copper K – Potassium
MDA – Malondialdehyde acid
N - Nitrogen P - Phosphorous
TBA – Thiobarbituric acid TCA - trichloroacetic acid Zn - Zinc
25
Figure 1- Representation of forest area, other wooded land, other land and water in the world (Source: FAO, 2010)
Chapter I
General Introduction, Research Aims and Relevance
Economic importance of Eucalyptus globulus
The world’s total forest area (Figure 1) was estimated to be over 4 billion hectares in 2010 (about one-third of the total land area in the world), providing a complex array of vital ecological, social and economic goods and services (FAO, 2010). Forests constitute the main terrestrial biodiversity repository and currently, about one billion people around the world depending on their resources for survival supplies (FAO, 2010). Also, forests can store more than a 650 billion tons of carbon mostly in biomass and soil (FAO, 2010), and their destruction or degradation contribute to 10-30% of all CO2 emissions to the atmosphere (Abril et al.,
2011). Both wood and manufactured forest products contributed with more than $450 billion to the world economy each year (Abril et al., 2011).
26
While sustainable management, planting and rehabilitation can conserve or increase the forests productivity, deforestation, degradation and poor forest management can reduce them (FAO, 2010). Industrial and agricultural revolutions, urbanization and other natural occurrences (such as fires and pests) have caused higher levels of deforestation, which caused in the last 20 years a loss of 95 million hectares of forests (Abril et al., 2011). Planted forests constitutes nearly 7% of world forests and they provide essential related forest products and services to follow the increasing growth demand population, allowing environmental benefits as a climate change mitigation (FAO, 2010).
The Eucalypt genus includes 900 species native to Australia. and is characterized by it fast growth and a high tolerance to arid environments, leading it to support many adverse conditions as drought, fire, insects and soil acidity, allowing to a high success as an exotic plant (Rockwood et al., 2008). Eucalyptus globulus is the main hardwood specie that grows in temperate Mediterranean regions and it is one of the most popular members of the genus in the forestry industry due its relatively high fibre yield and rapid growth (Warren et al., 2011). It was discovered in Tasmania in 1792 and it was the first eucalypt species to be formally described (Potts et al., 2004).
Eucalypt wood has been applied as a source of energy, once its biomass can be converted to produce petrochemical products such as a lubricants, textiles, biodegradable plastics, celluloses (Sims et al., 2010), plywood, veneer (Gorrini et al., 2004), essential oils and providing natural shade and windbreaker (Foley et al., 2004). Once eucalypt has a fast growth, its productivity is maximized by short rotations. Some species also have wood properties (high density) that allow its application for charcoal production, paper manufacturing and lumber (Rockwood et al., 2008). Eucalyptus spp. plantations have been estimated to cover a total area of about 20 million ha around the world in South America, South Africa, Asia, Australia and Southwestern Europe (Flynn et al. 2010). In Portugal, 700,000 ha of E. globulus has been established as a key species (Chaves et al., 2003), and due its higher growth rates, superior pulp properties and environmental adaptability, it has been extensible used for pulpwood production (David et al., 1996), representing 6% of the total value of national exports, constituting a major value in the country’s economy (Silva et al., 2004). Due to increased anthropogenic activities and the consequent effect on global climacteric patterns, water limitation has become a main disruptor of terrestrial ecosystem
27
dynamics once it will affect the textural properties and compositions of the soils influencing the water retention ability (Pereira et al. 2007).
Water deficit and its impacts on forests
The increasing need to supply the growing population in the last decades has dramatically increased the general world pollution, leading to global warming which largely contributes to alterations in the composition and equilibrium of the atmosphere and land around the globe. Extreme events such as rainstorms and drought periods are predicted, increasing the risks of wildfires which may severely impact on plant productivity, causing the mortality of trees and contributes to soil degradation (Santos et al., 2001).
The 21st century is characterized by increasing drought events (Barriospedro, et al., 2010) and
the consequences for the plant water relations and general yield has been studied and is well documented (Leuzinger et al., 2005, Bréda et al., 2006, Granier, et al., 2007). According with the economic, agronomic and ecological importance of agriculture and forestry, drought periods and its effects on plants has evoked interest beyond scientific proposes, namely at governments and environmental organizations (Trigo et al., 2000). Along with the influences in agricultural aspects, the incidence of pests and diseases affected by climacteric alterations may influence the geographical distribution of crops (Santos et al., 2001) and recurrent severe droughts over the time may change the composition of species in ecosystem (Granier et al., 2007).
Mainland Portugal is characterized by a mild temperate climate, with average annual temperatures varying from 7°C to 18°C and average annual precipitation ranging from 500 mm to over 3000 mm (Santos et al., 2001). In the last years, the climacteric patterns exhibited temporally and spatially irregular behaviours (Daveau et al. 1977; Trigo et al., 2000), with severe winters and lower precipitation rates in spring, summer and autumn months, leading to more and severe drought periods (Guidi et al., 2013).
Plants often deal with biotic and abiotic stressors that may compromise their health and performance (Leuzinger et al., 2005). Among all variation factors of temperature, salinity and nutrients, hydric stress is probably the most limiting factor. It is determined by the increasing temperatures and/or heat waves associated with low levels of precipitation, leading to a long dry periods and high demands of plant transpiration rates (Ryer et al., 2013). Drought stress is a direct disruptor of water and carbon fluxes with effects on primary production and
28
terrestrial ecosystems dynamics once it could affect the soil functions namely at organisms activity level (Bréda et al., 2006).
The lack of water supplies affect plants at different levels depending on intensity, duration and progression of drought, and it can lead to responses at physiological, biochemical and molecular levels (Seyed, S. et al., 2012), as can be seen in Figure 2. As a primary response, plants tend to close the stomata and reduce foliar areas, leading to lower levels of transpiration by avoiding water losses (Pita et al., 2001). Also, when the stomata close, the gas exchanges in plants are seriously compromised leading to a lower CO2 uptake (Anjum et
al., 2011) affecting photosynthetic rates and, consequently, tissue growth and differentiation (Shao et al., 2008).
The water balance of any plant is driven by their ability to absorb water from the soil and the efficiency of transport along the vessels, both ensured by transpiration rates. The water flow continuum between soil-plant is a result from a water potential gradient between roots-soil and leaves-transpiration, leading to a decrease in leaf water potential as evaporation increases and also as soil dries (Martinková et al., 2014).
The efficiency of soil water absorption largely depends both by extension and density of root systems and their distribution and growth also depends on physical soil properties such as bulk density or moisture content, directly linked with climate dynamics (Bréda et al., 2006). Thus, in drought conditions, plants develop a deep and dense root system, providing access to larger soil water reserves (Leuschner et al., 2004). Enhancing root system could also be described by a recovery strategy to re-establish the water potential equilibrium over night, when the deeper roots reach the water displayed as a gradual downward shift as the soil dries and supports transpiration supplies during stomatal closure periods (Bréda et al., 1995). Maintenance of turgor values provides a chance to preserve metabolic processes and growth. Turgor is a result from osmotic adjustments or decreases in cell wall elasticity, which allows plants to take up water at low soil water potentials (Pita et al., 2000). The enhancement of root systems is reported by some studies, which emphasise an increasing of root/shoot ratio under drought conditions (Xu et al., 2010; Chaves et al., 2003).
Plants react to hydric stress by avoiding losses of water also by growth inhibition as a way to maintain water levels and plant carbon assimilation at healthy rates. To minimize water losses, plants also reduce the light absorbance through rolled leaves, by a dense trichome layer which increase reflectance rates, steeping leaf angles, decreasing canopy leaf area or
29
shedding older leaves (Chaves et al., 2003). They also respond by accumulating somatically active compounds also known as compatible solutes, which ensure a physical replacement of water (hydrophilic nature) near cellular compounds, preventing desiccation (Bohnert et al., 1999), stabilizing the photosystem II complex, protecting enzymes and proteins, maintaining membrane integrity and lower levels of ROS (Chen et al., 2007).
Elevated soluble sugar content (TSS), known as the most important compatible cellular solute in plants, are reported by many authors as a main physiological response of hydric deficit, once it will lower the hydric potential of cells which may facilitate the absorption of water from de soils. Increasing the TSS content may also maintain cell turgor, gas exchanges levels and growth rates at stress conditions (Chaves et al., 2003; Guarnaschelli et al., 2006), support biological stabilization of membranes, proteins and enzymes and it is related with a repression of the photosynthetic-associated genes expression (Chaves et al., 2003).
Cellular growth is the main direct physiological process constrained by drought conditions. With reduction of turgor pressure and assimilation of carbon, cells cannot ensure their development, limiting plant performance and productivity. Thus, during the acclimation phase, water stress typically leads to low growth rates. Some studies show that aboveground biomass can decrease in order to carbon partitioning favour root system development (Silva et al., 2004, Charp and Davis, 1979). Some studies in Eucalyptus spp. also reported significant decreases in shoot, basal diameter, total leaf area, foliage and number of branches (Demming-Adams et al., 1996, Chaves et al, 2003). Chlorophyll are thylakoids pigments responsible for the absorption and delivery of the light energy to the photosynthetic apparatus, along with carotenoids and anthocyanins that protect photosynthetic machinery from excess of light or UV light, respectively. Carotenoids are also an essential compounds of thylakoid membranes, supplying a variety of functions as a reactors with quench triplet chlorophyll, singlet oxygen and superoxide anions, harvest light to photosynthesis process and play an important role as a precursor for abscisic acid biosynthesis (growth regulator) (Cunningham and Gantt, 1998). When subjected to stress conditions, namely water limitations, plants tended to loose chlorophyll being forced to divert the absorb light by other ways like thermal dissipation to protect the photosynthetic apparatus, by carotenoids (Reddy et al. 2004). Due to their importance for the leaf and photosynthetic success, variation on pigment content may provide important information about the physiological state of the leaves. Usually, the values of both pigments decrease with hydric stress (Alberte et al., 1977).
30
The decrease of chlorophyll content under hydric stress is well documented as a result of photo-oxidation and degradation (Anjum et al., 2011), nevertheless Michelozzi et al. (1995) and Correia et al. (2014) found an increasing of chlorophylls and carotenoids content under drought conditions along with the maintenance of their volume, which seems to be a defence mechanism response in E.globulus, to prevent chloroplasts injury from toxic concentrations of ions.
The lack of water under stress conditions will increase the solute concentrations once the protoplast volume shrinks, which can cause serious structural and metabolic consequences. As a direct effect from desiccation are the membranes integrity and proteins damages, which leads to metabolic dysfunctions in lipid bilayer causing displacement of membrane proteins which, with solute leakage, contributes to a loss of selectivity and activity of membrane-based enzymes (Anjum et al. 2011).The Malondialdehyde acid (MDA), is a secondary product of lipid peroxidation, produced by oxidation and enzymatic degradation of cellular membranes in the presence of Reactive Oxygen Species (ROS) and it has been an extensively studied indicator of the prevalence of free radicals reactions and tissue damages in plants.
ROS are commonly produced and accumulated in response to stress, which may cause
oxidative damages to lipids, proteins and nucleic acids, seriously compromising cellular health. It is used as a direct indicator of oxidative stress (Arcoverde et al., 2011). Some studies have reported increasing MDA contents in response to ROS production as a consequence of moderate and sever hydric stress in plants (Arcoverde et al., 2011, Cechin et al., 2010, Lima et al., 2010) and Correia et al. (2014) reported a direct relation between increasing hydric stress levels and the MDA content, in Eucalyptus globulus.
Studies have been made in Eucalyptus spp. to access the water limitation stress levels:
Significant decreases in most of morphological parameters such as growth rates, total biomass, leaf area, number of lateral branches and root length (Silva et al. 2004, Li et al. 2003);
Decline in stomatal conductance (gs), photosynthesis (A) and transpiration reates (E) were also reported under drought stress (Guarnaschelli et al. 2006, Lima et al. 2003);
Decreasing water potential in response to water limitations has been also reported for
Eucalyptus globulus plants (Guarnaschelli et al. 2006, Correia, et al. 2014);
Increasing total chlorophylls and carotenoids concentration with increasing water deficit (Michelozzi et al.1995, Correia et al.2014). Regarding to MDA content, Correia
31
Figure 2- General plant responses to drought stress (short and long term). Source: Chaves et al.2003
et al. (2014) also reported an increase of MDA content in E.globulus exposed to different levels of water deficit.
Biochar as a strategy to mitigate hydric stress
Biochar is considered as a new and promising approach to improve soil quality and crop productivity. After application, biochar can influence soil aggregation, porosity and density, which in turn affect the soil aeration, water holding capacity, microbial and nutritional rates. Some studies reported biochar benefits in climate mitigation, reducing the effects of global warming and drought conditions (Lehman et al., 2007, Ogawa et al., 2006, Laird et al., 2008, Woolf et al., 2010).
Biochar is usually defined as a charred organic matter material, produced with the intent to be deliberately applied to soils to sequester carbon and improve their properties (Lehmann et al., 2009). It has a heterogeneous composition and its surfaces can exhibit both hydrophilic or hydrophobic, acidic or basic properties, allowing biochar to react with soil components (Amonette et al., 2009). Biochar is degraded on a timescale of centuries depending on original
32
feedstock, production strategy, environmental and management conditions (Cheng et al., 2008, Lehmann et al., 2011).
Biochar consists of a carbonaceous material with polycyclic aromatic hydrocarbons, with an array with other functional groups (Kookana et al., 2011). Heteroatoms can be found within the aromatic rings, such as hydrogen, oxygen, nitrogen, phosphorus and sulphur which largely contribute for the heterogeneous and reactive nature of biochar’s surface. Carbonaceous material, volatile matter, mineral matter and moisture are the main compounds of any biochar, wherein carbonaceous and ash materials constitute the solid part of biochar and a mix of air and volatiles constitute the gaseous fraction (Verheijen et al., 2010).
In the distant past, Amazonian communities promoted in-field fires producing extremely productive soils with dark colour named ‘Terra Preta do indio’. It is defined as an anthropogenic dark soil, characterized for enhancing the soil fertility and yield performance (Lehmann et al., 2007). Recently, the potential relevance of Terra Preta has been studied with the intent of developing strategies or soils whose properties would enhance those ancient findings. Darker soils may absorb more solar energy (Verheijen et al., 2013) increasing the overall soil temperature, directly affecting the physicochemical and biological processes. Sohi et al. (2009) reported that those characters may extend the growing season with optimal growing conditions.
Biochar is produced by thermal alteration of biomass under oxygen-limited conditions. This process is named pyrolysis and is characterized by using low levels of oxygen, with variable rates of heating and temperature peaks (Sohi et al., 2009). This process produces a solid structured material with a higher surface area, reduced oxygen and hydrogen contents and a higher nutrient concentration, compared to the original feedstock (Gaskin et al., 2008). The wide variability of biochar’s chemical and physical properties depends on the feedstock used, as well as the pyrolysis dynamic between available oxygen and temperature achieved during the process. There is a large variety of different feedstock’s used in biochar production, varying from crops residue (e.g. corn, cereals, wood, pellets, palm oil, oilseed rape, wheat straw, hazelnut shells) to manure or organic household wastes (Sohi et al., 2009).
The interaction of biochar with soil components is directly linked with the distribution and connectivity of pores in the soil and with the charged surface character dynamics over time (Joseph et al., 2010). Fresh biochar can show hydrophobic behaviour, but when natural oxidation occurs (in biochar contacts with air and water), it surface assumes a reactive
33
hydrophilic nature (Basso et al., 2013). When in contact with soil, biochar surface oxidizes leading to a formation of hydrophilic carbonyl, carboxyl and phenolic surface groups, promoting further active interactions with soil biotic and abiotic constituents (Cheng et al., 2006). When oxidation occurs, the cation exchange capacity (CEC) increases by improving the reactivity at the surface of biochar particles (Cheng et al., 2006).
Biochar porosity determines its specific surface area. The size of biochar pores can vary from nano to macro pores (<0.2nm to >50nm) (Downie et al., 2009) and this feature characterizes its functionality in soils: aeration, hydrology and a niche for microorganisms such as mycorrhizae and bacteria (Pietikainen et al., 2000). Otherwise, the pores also allow molecular adsorption and transport (Thompson et al., 2005), improving the surface area and promoting nutrient retention (Liang et al., 2006). The porosity degree is determined by pyrolysis temperature and nature of feedstock. It will decline in the presence of lipids, fluvic and humic acids from original feedstock (Atkinson et al., 2010).
Soil aggregation can be increased by biochar application to soils due the interactions between biochar’s internal and external surfaces with soil organic matter and surrounding biota (Abel et al., 2013). This promotes the decreasing of bulk density leading to a better aeration, drainage and water holding capacity (Lei et al., 2013, Mulkahya et al., 2013). Bulk density is one of the most important factors affecting the water infiltration in the soils and the ability of biochar to change this character will improve root systems and microbial respiration (Basso et al., 2013).
One of the most important agronomic benefits of biochar in soil application is the extraordinary sorption ability associated with the improvement of water retention (Atkinson et al., 2010), which may increase crop production in non-irrigated drought periods (Jeffery et al., 2011). The negative surface charge of oxidized biochar allows electrostatic bonding with the positively charged side of dipolar water molecules (Thomas et al., 2008). Some studies reported that irrigation requirements decline in biochar amended soils, when compared to controls (Novak et al., 2013; Chan et al., 2007), with more water retained, increasing the available moisture favouring crop development during critical drought stress in growing seasons (Laird et al., 2010).
Biochar addition increases overall accumulation of osmotic active substances in plant tissues (like K+), leading to an improvement of water uptake by plants (Gaskin et al., 2010). Furthermore, biochar may not only modify the availability of water in soils, but also the
34
physical advantageous location of water within the soil matrix, near the plant roots (Sohi et al., 2009). When applied to soils, some studies reported that biochar can improve water availability in sandy soils (Basso et al., 2013; Busscher et al., 2010; Novak et al., 2009; Pereira et al., 2012), while for loamy soils a moderate improvement has been observed (Laird et al., 2010; Karhu et al., 2011). Bornemann et al. (2007) also recognized the ability of biochars to sorb pollutants in soil/sediments and reducing pesticide toxicity (Cui et al., 2009; Wang et al., 2010).
Biochar is also considered as a nutrient source when it provides macro and micronutrients to plants, conferring it a fertilizer character in short-term application (Thomas et al., 2013). Regarding the surrounding biota, this nutrients may not be available as an energy source but, they can be leached and mineralized and, therefore, stimulate microbial activity (Lehmann et al., 2011). Biochar has also been directly linked with increasing uptake rates of Phosphorus (P), Potassium (K), Calcium (Ca), Zinc (Zn) and Cupper (Cu) by plants (Lehman et al., 2006). Recent meta-analyses have shown that in most instances plant biomass increased after application of biochar into the soils (Jeffery et al., 2011; Liu et al., 2013). Oram et al. (2014) suggested that, in legumes after char application under N-limiting conditions, biological nitrogen fixation enhanced the plant performance and, thus increased the overall biomass. The mechanical impedance is the most determining factors for root elongation and proliferation in soil. In conditions of water limitation, this may play an important role in reaching deeper moisture and maintain vital levels of water into the plant. Lehmann et al. (2011) also reported an overall reduced tensile strength of the soil when amended with biochar, leading to an easier way for plant roots to reach water.
Relevance and application of the results
Due the economic and environmental importance of Eucalyptus globulus around the world and assuming the increasing of drought periods arising from climate changes which constitutes a main disruptors to Eucalyptus globulus performance, it is extremely important to study and develop adaptation strategies to maintain or improve plant productivity, ensuring that environmental and human needs will be supplied along the time. The soil used in this study was a typical sandy soil from eucalypt plantations in Portugal and the drought stress imposed (30% of field capacity) represent a medium stress, equivalent to a dry periods in natural conditions in a temperate climate as Portugal.
35 Aim and objective of this study
The main objective of this study is to evidence that biochar can be used as an adaptation agent, diminishing drought effects of climate change in Eucalyptus globulus. Thus, plants with biochar exposed to hydric stress will show lower stress levels (at physiological, morphological and biochemical levels) compared to plants without biochar.
Hypothesis
Eucalypts plants will experience less hydric stress and show better physiological performance under water limitation conditions, when planted in biochar-amended soil and there is no need for additional fertilizer addition to improve this performance.
Organization of the thesis
This thesis comprises three parts. Chapter I introduces a brief literature review as a background and framework. Chapter II consists of a paper, where the experimental results of this work are presented and discussed, titled “Biochar amendment as a strategy to reduce hydric stress in eucalypt seedlings”. Chapter III comprises the general conclusions and future perspectives on this work.
37
Chapter II
Biochar amendment as a strategy to reduce drought in
eucalypt plants
Mesquita, R.1, Pinto, G.1, Verheijen, F.2,Keizer, J.2.
1Department of Biology - University of Aveiro, Campus Universitário de Santiago, 3810-193 Aveiro, Portugal
2
Departement of Environment and Ornament - Centre for Environmental and Marine Studies (CESAM), University of Aveiro, Aveiro 3810-193, Portugal
* Corresponding author: [email protected]; [email protected]
Abstract
Drought events are the most important disruptor in plant performance, due the climacteric alterations, with a straight effect on primary production and terrestrial ecosystem dynamics. It affects plants at different levels depending on intensity, duration and progression of drought, leading to responses at physiological, biochemical and molecular levels. It is well documented that the application of biochar as a strategy to amend soils in drought conditions, once it enhance water and nutrient retention. Thus, the main objective of this study was to evidence that biochar can be used as a mitigation agent, diminishing the drought effects in Eucalyptus globulus and there is no need further fertilizer addiction to improve that. The experimental design comprises 136 plants of Eucalyptus globulus exposed to a water limitation period (Water Stress - WS) of 6 weeks at 30% of field capacity and a control group at 80% of field capacity (Well Watered - WW), each one with four treatments: no biochar, biochar (4%), fertilizer and biochar+fertilizer. In the end of the experiments, 6 plants of each treatment were evaluated in morphological, physiological and biochemical parameters. Our results showed a significant decrease in levels of all measured parameters between well watered and water stress, leading us to conclude that the hydric stress severely affect plants performance. In water stress, biochar improve leaf area and photosynthesis rates along with lower values of total soluble sugars and slight higher values of water potential, suggesting
38
that in water stress conditions it is beneficial to applied biochar into soils to enhance their ability to store and use water, reducing overall stress levels in the plants. In well watered conditions the use of biochar promoted lower photosynthetic rates and lower values of all morphological parameters as above ground biomass, number of lateral branches and leaf area when compared with nutrients application, suggesting that under well-watered conditions, the use of biochar is not a better option. The results of conjugation of both biochar and fertilizers were contradictory. In well water conditions we found a higher values of Fv/Fm along with chlorophylls and lower values of number of leaves, leaf area, photosynthesis and TSS. Otherwise, in water stress conditions, besides the lower performance in all gas exchanges parameters, we noticed higher above ground biomass, when compared with biochar and fertilizer applied by their own. In either case, further studies are needed.
39
Introduction
Drought stress is a directly disruptor of water and carbon fluxes, with straight effects on primary production and network terrestrial ecosystems (Bréda et al., 2006). It results from climacteric alterations and directly affects the primary production and network terrestrial ecosystems (Granier et al., 2007). It affect plants at different levels depending on intensity, duration and progression of drought, and it can lead responses at physiological, biochemical and molecular levels. To avoid dehydration, plants have to deal with two main issues: minimizing water loss and maximizing water uptake (Chaves et al., 2003). To minimize water loss, plants tend to close the stoma and reduce foliar area, leading to a lower levels of transpiration and therefore preserve internal hydric levels, avoiding xylem cavitation and death (Chaves et al. 2003)). Plants also reduced the light absorbance by producing a dense trichome layer increasing reflectance, steeping leaf angles, decreasing canopy leaf area or shedding older leaves (Chaves et al., 2003; Bohnert et al., 1999). The hydric potential also decrease along with loss of turgor in cells in response to cell wall changes to osmotic adjustments (Shao et al., 2008). The stomatal closure limits the gas exchanges levels, resulting in a reduced transpiration and photosynthesis, which will constrict the assimilation of carbon and compromise overall growing and differentiation of plant tissues (Anjum et al. 2011).Silva et al. (2004) also reported an increasing in below ground biomass, with a development of deep and dense roots that may reach inaccessible moisture in the soil. Due to increased anthropogenic activities and the consequent effect on global climacteric patterns, the water limitations has become the main disruptor of terrestrial carbon sequestration variations and terrestrial ecosystem dynamics (Pereira et al. 2007).
Eucalypt species are native from Australia although is currently worldwide spread (Stackpole et al., 2011), established over than 18 million ha in 90 countries (FAO, 2005), covering the land area of 700 000 ha in Portugal (Chaves et al. 2003)
It shows a fast growth and a high tolerance to arid environments, leading it to support many adverse conditions (Rockwood 2008). Eucalyptus globulus is the main hardwood species that grows in temperate Mediterranean climate, around the world (Potts et al., 2004 ) and its success as a plantation tree species has been attributed to its high productivity and pulp
40
quality (Guarnaschelli et al., 2006). Studies in Eucalyptus spp. reported the effects of hydric limitations, suggesting a decrease of growth rates, leaf area and total plant biomass (Pita et al. 2000; Metcalfe et al. 1990), low rates of photosynthesis, stomatal conductance, internal concentration of CO2 (Warren et al. 2011; Silva et al. 2004), decrease in water potential
(Correia et al. 2014), changes in chlorophylls and carotenoids content (Shvaleva et al. 2006) and increasing in MDA content (Correia et al. 2014) with huge consequences at crop productivity and cultures success. Biochar is charred biomass, produced by controlled conditions (pyrolysis) with the intent to be deliberately applied to soils to improve their properties and functions (Lehmann et al., 2009). Depending on feedstock and pyrolysis conditions, the resulting biochars can greatly differ in their properties and the effects on soils (Sohi et al., 2009). Biochar has been used as an amendment in soils with the purpose to enhance water and nutrients retention and availability to plants in drought periods (Chen et al., 2008). It appears to be the exchange of positively-charged ions on the negatively-charged biochar surface area, which is responsible for the most cases of mitigation of plant stress either by reducing the exposure of plants to contaminants or by ameliorating stress responses (Thomas et al., 2013). Along with this, some studies emphasised their ability to supply nutrients (Silber et al., 2010) and increase their retention by soils (Chen et al., 2007), to improve soil pH associated with dissolution of alkaline minerals from biochar’s surface (Yamato et al., 2006) leading to an increase cation exchange capacity (Cheng et al., 2006), neutralization of phytotoxic compounds (Wardle et al., 2001), increased colonisation of mycorrhizal fungi (Yamato et al., 2006) and alteration in soil microbial equilibrium and functions (Graber et al., 2010).
Due the economic importance of Eucalyptus globulus around the world and considering estimate increases in drought periods arising from anthropogenic activities, it is extremely important to study and develop adaptation strategies to maintain or improve productivity, while ensuring that environmental and economic needs will be maintained. Thus, biochar application to soils could be an answer to allow eucalypt plants an adaptation to a drier climates.
Thus, the main objective of this study is to investigate if biochar can be used as an adaptation strategy, diminishing drought effects of climate change in Eucalyptus globulus. The methodology to explore this objective was a greenhouse randomized pot experiment of eucalypt plants (clones) in pots filled with a typical local sandy soil and pots where this soil
41
had been amended with biochar. It was hypothesized that plants with biochar exposed to water limitations would show lower stress levels (at physiological, morphological and biochemical levels), compared to plants without biochar. We also evaluated the fertilizer character of biochar by including a fertilized treatment in the methodological design.
Materials and methods
Location and soil type
The soil was collected at a Eucalyptus globulus plantation in Vagos, placed in the inner-dune complex of the coastal zone of central Portugal, at 6km distance from the Atlantic Ocean and approximately 10km south of the city of Aveiro (440 42’ N and 80 42’ W). This soil is a Haplic Arenosol Dystric (IUSS, 2006), a sandy and structurless soil. This area has a subhumid meso-Mediterranead climate, with a 15oC of mean annual temperature and 950mm of rainfall (Drarn-centro, 1997).
Soil and Biochar Pre-treatment
About 130kg of soil were collected into plastic bins from the field site at approximate depth pf 20cm, using a pickax and shovel, during a 2 months period. Both biochar and soil were air-dried to ensure uniform moisture contents at ambient temperature in a maximum of 5cm thick layer in cardboard boxes e a closed room. Soil was also sieved (porous lower than 2mm) to take off plant debris, stones, and other particles.
Soil and Biochar Pre-treatment and Characterization
Biochar was purchased from Swiss Biochar gmbh and was produced from mixed wood sieving feedstock in a Pyreg 500 III pyrolysis unit, 620°C maximum temperature, 20 minute duration, 80% C content, H/C 0.18. Loss on ignition was used to measure soil organic matter content. Approximately 10 g of soil sample was placed in a crucible, weighed on a decimal balance and placed in an oven at 105°C for 24 hours. Then, it was placed in a desiccator for 1 hour, weighed and placed in a muffle at 550oC for 4 hours and finally placed in a desiccator for 1 hour and weighed again on the same four decimal balance. The soil organic matter content
42
was expressed as the percentage weight loss at 550°C relative to the oven-dry weight (at 105°C).
For bulk density the soil was placed in a metal cylinder of 251cm3 (soil) and 87cm3 (biochar)
and weighed. The cylinders were then placed in the oven for 24 hours at 105oC. The bulk density values were calculated by dividing the oven-dry weight by the volume of the cylinder. To measure the particle size distribution, the dry soil samples of known weight were sieved over a range of sieves with apertures between 5mm and 50μm.
To achieve the field capacity of the substrates, the pots were filled with oven-dry soil (1097g) and oven-dry soil + biochar (797g + 32g), weighed and saturated with water (from the bottom up) and allowed to freely drain overnight and weighed again. Subsequently, pots dried in an oven for one week at 60oC. The moisture content at field capacity was calculated by dividing
the weight of the water after overnight draining by the oven-dry weight of the soil or soil-biochar mixture. . These values supported the determination of 80% and 30% of well-watered and stress treatments that were used in this experiment.
Experimental Design
The randomized, factorial (3 factors) pot experiment was conducted at the research greenhouse of Siro (Grupo Leal & Soares, S.A.) located in Mira, Portugal. The light, temperature and humidity conditions were controlled and monitored, 48.4 W/m2 mean total
solar irradiance, 17.2oC mean temperature ranged by 5.2oC to 37.8oC, and 78.6% mean
relative humidity (ranging from 61.5% to 95.7%). On the sampling days the mean of total solar irradiance was 67 W/m2 (308 W/m2 maximum), the mean temperature was 20.2oC and
mean relative humidity was 69.4%. A total of 136 one litre pots with eucalypt plants were monitored. Pots were filled with soil and soil+biochar. Half (68) were filled with soil (1097g) and the other half with biochar-amended-soil at a concentration of 4% of oven-dry biochar (797g soil and 32g of biochar). A 4% biochar concentration in the top 15 cm of soil is roughly equivalent to a biochar application rate of 90 t ha-1 (assuming a bulk density of 1.5 kg dm-3
from literature), which is within the range reported by Jeffery et al. (2011). The pots were saturated with water and fertilizer (5ml/L Complesal – Bayer, according to the young eucalypt needs recommendations) from the bottom by immersion in a larger container, to ensure homogeneous wetting and planted with five months old rooted cuttings of Eucalyptus
43
watered daily, to 80% of field capacity, during a 3 month acclimation period. The pots were fertilized once a week and randomly moved around every two days, to ensure that every plant had similar growth conditions.
Two water conditions were tested: Well-Watered (80% of field capacity) and Water Stressed (30% of field capacity). Each water condition comprised of 4 treatments with 17 replicates each:
i) WW (Well Watered – no biochar); ii) WWb (Well Watered – with biochar); iii) WWf (Well Watered – with fertilizer);
iv) WWbf (Well Watered – with biochar and fertilizer); v) WS (Water Stress – no biochar);
vi) WSb (Water Stress- with biochar); vii) WSf (Water Stress – with fertilizer);
viii) WSbf (Water Stress – with biochar and fertilizer).
The pots were weighed and monitored every day during the six week treatment period, and the values of soil water content were maintained by adding the amount of water lost by evapotranspiration every day. Wilting symptoms and plant survival rates were recorded throughout the experiment.
Plants were harvested six weeks after the beginning of the experiment. At this point, six random plants were evaluated for in vivo measurements (gas exchanges and chlorophyll fluorescence parameters) and hydric potential. Additionally six randomly-selected, homogenous leaves were immediately frozen in liquid nitrogen and kept at -80oC for further
physiological and biochemical analysis (pigments, total soluble sugar and lipidic peroxidation). Additionally, measurements were made of plant height, number of leafs and lateral branches by direct counting. The dry weight of aerial portion and roots were measured after drying for 48hours in a 80oC oven. Leaf area was determined by taking photographic images of picked
leaves followed by image analysis using the software Image J.
44
Midday shoot water potential (Ψmd) was measured using a Scholander-type pressure chamber (PMS Instrument Co., Corvallis, OR). Measurements were performed in 6 individuals per treatment at 12h30 (solar time) after 6 weeks of experiment
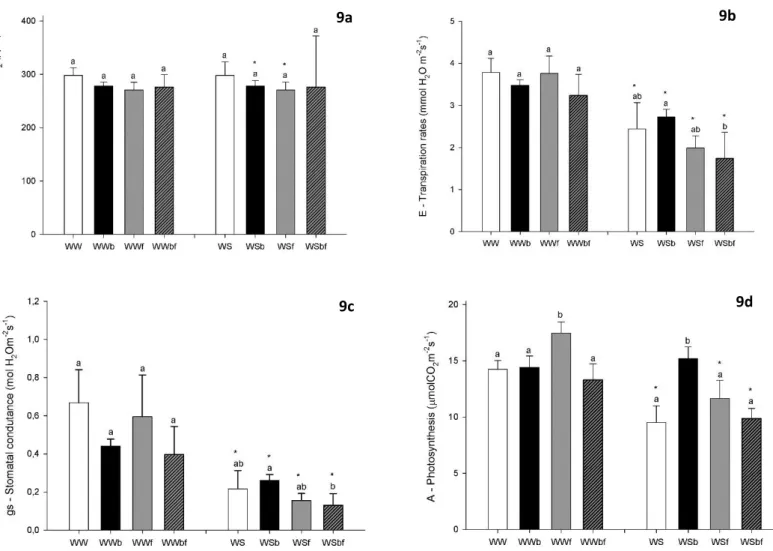
Gas exchange
Leaf gas exchange measurements were performed on fully expanded leaves using an LCpro-SD infrared gas analyzer (ADC BioScientific Ltd., UK). Measurements at saturation light intensity were performed at 350 µmol m-2s-1 and photosynthetic rates – A (µmolCO2m-2s-1),
transpiration –E (mmolH2Om-2s-1), internal concentration of CO2 – Ci (ppm) and stomatal
conductance – gs (molH2Om-2s-1) were determined. Data were recorded when the CO2
remain at constant values.
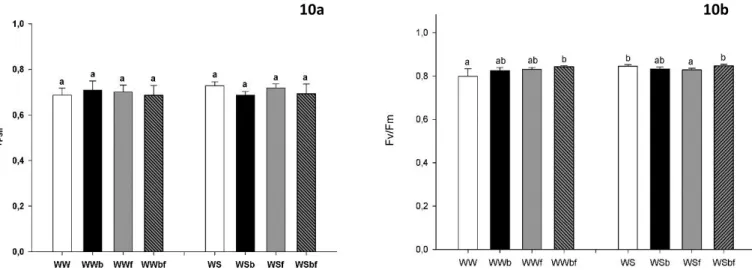
Chlorophyll fluorescence
The Chlorophyll fluorescence was measured on the same leaves as gas-exchange measurements with the support of a portable pulse amplitude modulation fluorometer (Mini-PAM, Walz, Effeltrich, Germany). Steady-state fluorescence (F) and maximal fluorescence (Fm) were measured in light adapted leaves, by which фPSII (Effective Quantum Yield) was determined (equivalent to Fm-F0/Fm). Minimal fluorescence (F0) was measured in 30 minute dark-adapted leaves by applying weak modulated light and maximal fluorescence (Fm) was measured after applying a 0.7 s saturating pulse of white light (> 1500 μmolm-2s-1). Leaves were then dark-adapted for at least 30 minutes to obtain F0 (Minimum Fluorescence), Fm (Maxium Fluorescence), Fv (Variable Fluorescence, equivalent to Fm-F0) and Fv/Fm (Maximum Quantum Yield of PSII photochemistry).
Photosynthetic pigments content
Chlorophyll a, b and carotenoids were quantified according to Sims and Gamon et al., (2002). Chlorophyll a, b and carotenoids were extracted with cold acetone: 50 mM Tris buffer pH 7.8 (80:20) (v/v) and centrifuged for 5 min at 10000g. Supernatant’s absorbance was read at 470, 537, 647 and 663 nm (Thermo Fisher Scientific Spectophotometer, Genesys 10-uv S, Waltham, MA). Pigments contents were calculated according as it described by Alves et al. (2011).
45
Lipid peroxidation
The level of lipid peroxidation was estimated by assessing the amount of malondialdheyde (MDA), following the procedure described by Hodges et al. (1999). About 50 mg of leaves were ground in 2.5 ml cold 0.1% trichloroacetic acid (w/v) and centrifuged. The supernatant was divided in two 250 µl aliquots. To 1 ml of 20% TCA (w/v) in 0.5% TBA (w/v) was added (positive control) whereas to the other 1 ml of 20% TCA (w/v) was added (negative control). Both aliquots were heated at 95ºC for 30 min and the reaction was stopped immediately, and the tubs were placed on ice. After centrifugation, absorbance was read at 440, 532 and 600 nm and MDA equivalents (nmol mL-1) were calculated as (A – B/157 000) × 106, where A = [(Abs 532+TBA) – (Abs 600+TBA) – (Abs 532-TBA – Abs 600- TBA)], and B = [(Abs 440+TBA – Abs 600+TBA) × 0.0571].
Total soluble content of sugars
Total soluble content of sugars (TSS) was determined by using the anthrone method, as described by Irigoyen et al. (1992): TSS extraction from frozen leaves was performed using 80% (v/v) ethanol at 80ºC for 1h. After centrifugation, the supernatant was mixed with 1.5 ml of anthrone and incubated at 100ºC during 10 min period. Absorbance was read at 625 nm and TSS content was calculated against a D-glucose standard curve.
Statistical Analysis
One way ANOVAS (Analysis of Variance) were made separately for Well watered conditions and Water stress (four treatments per group) followed by post hoc multiple comparison test (using Tukey when appropriate) was performed to estimate the significance of the results. The statistical procedures were performed using SIGMAPLOT (Systat Software, Inc. SigmaPlot for Windows 11.0), showed in plots where the different lowercase letters indicates differences in water conditions and the asterisks indicate significant differences between water conditions (p ≤0.05).
The PCA – Principal component analysis was performed with R programming language running with an open-source software RStudio: Integrated development environment for R (RStudio Boston, MA, available from http://rstudio.org/. The PCA was carried out from a matrix data to a bidimentional plot that explains the highest proportion of data variation.
46
Results
1. Soil and Biochar characterization
The chemical and physical characteristics of soil and biochar used in the experiments are reported in Table 1 and Figures 3. In table 1 we can see that the total moisture content of the biochar was 35% and 88,9% of organic matter. The soil had a moisture content of 0.3%, and a soil organic matter content of 0.8%. Regarding to bulk density, soil showed higher values than biochar, from 1,65 to 0,17 respectively. Also, both pH and EC (Electric Conductivity) showed higher values in biochar when compared to soil, as 4,71 to 8,13 for pH, and 38 to 1496 from Electric conductivity, respectively. We didn’t found any difference between Soil and Soil+Biochar (4%) in Field capacity volumetric values, which shows 23% for both.
As we can see in Figure 3, both soil and biochar showed very different patterns in particle size distribution. Thus, biochar showed a very heterogeneous nature regarding to particle size characteristics, with particles varying from 5000 to 50 µm. The particle size distribution of the soil was more homogeneous, varying from 1000 to 250µm.
Table 1- Soil, biochar and biochar amended soil characteristics. Values with "*" were measured by Oliveira et al. (2014); na= not available
Soil Biochar Soil + Biochar (4%)
Moisture content (%) 0,3 35 na Bulk density 1,65 (±0.04) 0,17 (±0.01) na pH 4,71 (±0,03)* 8,13 (±0,04)* 7.63 (mean) EC (µS cm-1) 38 (±11)* 1496 (±43)* na Organic matter (%) 0,8 (±0.06) 88,9 (±2.79) na Field capacity volumetric (%) 23% na 23%
47
Figure 3 - Particle size distribution of soil and biochar (%)
Figure 2 - Particle size distribution in percent of soil and biochar
2. Plant performance
There was made a first sampling point at 4 weeks of experiment where we measured fluorescence of chlorophylls and gas exchanges after four weeks of experiment, without any significant differences. Then, the experiment were kept till six weeks, when all the morphological, physiological and biochemical measurements were taken and evaluated.
2.1 Wilting and Survival Rates
Tree days later from the beginning of stress assay, the plants showed wilting signals with 80% of incidence in WS treatment and only 45% in WSb treatment. This values decrease in treatments with fertilizer, to 18% for WSf and WSbf. In well watered condition, WWb treatment showed higher values of wilting (45%), against 9% for WW. In this condition, neither WWf nor WWbf showed wilting signals (Figure 4a). There were also observed 67.71 % of WS plants of survival rates against 100 % survival rates in othertreatments (Figure 4b).
48
Figure 5- Detailed view of WWb treatment and the apical wilting
Figure 4- Wilting (4a) and Survival Rates (4b), expressed in percent of Well Watered (80%FC) and Water Stress (30%FC) treatments. Different treatments are symbolized by WW – well watered without biochar, WWb – well watered with biochar, WWf – well watered with fertilizer, WWbf – well watered with biochar and fertilizer; WS – water stress without
biochar, WSb – water stress with biochar, WSf – water stress with fertilizer, WSbf – water stress with biochar and fertilizer
Figure 3- Wilting and Survival Rates, expressed in percent of Well Watered (80%FC) and Water Stress (30%FC) treatments. Different treatments are symbolized by WW – well watered without biochar, WWB – well watered with biochar, WWF – well watered with fertilizer, WWBF – well watered with biochar and fertilizer; WS – water stress without biochar, WSB – water stress with biochar, WSF – water stress with fertilizer, WSBF – water stress with biochar and
fertilizer
Also, the plants WWb showed a wilting signals on the top of the plant, characteristic for this treatment. Along with wilting signals, we recorded an atypical wilting symptoms at WWb treatment (Figure 5), where all the plants of this treatments showed only wilting signals at apical leaves. Also, this symptom is not the same wilting that can be seen in water limiting conditions, suggesting that these plants were not suffering from water limitation.
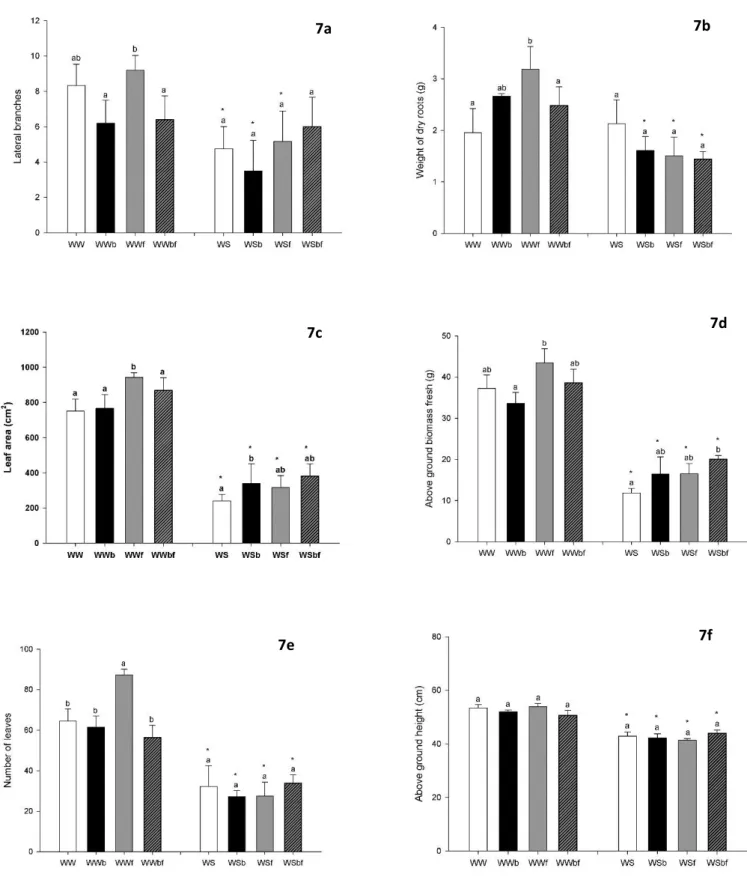
2.2 Morphological Parameters
In Figure 6 are represented the general visual differences between all treatments.
In Figure 7 are represented the results for morphological parameters in this study. As we can see in Figure 7a, the number of lateral branches was also significantly lower in all treatments of water stress when compared to well-watered conditions, except in Biochar+Fertilizer
4a
49
Figure 6 – General visual aspect between Soil and Biochar treatments. Different treatments are symbolized by WW – well watered without biochar, WWb – well watered with biochar, WWf – well watered with fertilizer, WWbf – well watered with biochar and fertilizer; WS – water stress without biochar, WSb – water stress with biochar, WSf – water stress with fertilizer, WSbf – water stress with biochar and fertilizer
Figure 4 – General visual aspect between Soil and Biochar treatments Different treatments are symbolized by Different treatments are symbolized by WW – well watered without biochar, WWB – well watered with biochar, WWF – well watered with fertilizer, WWBF – well watered with biochar and fertilizer; WS – water stress without biochar, WSB –
treatment. There were no differences between treatments in water stress treatment but, under well-watered conditions, WWftreatment showed significant differences compared to the lower values of WWb and WWbf. Underground biomass, represented in Figure 7b by dry roots weight, was lower under water stress than well-water conditions, except for the ‘no biochar’ treatment where no significant differences were found. Between well-watered treatments, WWf showed significant higher values than WW and WWbf. There were no significant differences found between treatments under water stress conditions. The values for leaf area (Figure 7c) were lower in water stress compared to well water condition, with statistical differences in all treatments. In well watered condition the WWf treatment showed significantly higher leaf areas than the other treatments and in water stress condition there was found a statically higher leaf area values in WSb when compared to WS. The above ground biomass fresh (Figure 7d) showed a decrease from well watered to water stress, with a significant differences between all treatments. In WWftreatment show significant higher value than WWb and in WSbf show, as well, significant higher values than WS. The number of leaves was significantly lower in water stress when compared to well watered, in all treatments (Figure 7e). There were no differences between water stress treatments, but under well-water conditions, the WWf treatment showed significantly higher number of leaves than the other treatments.
As can be seen in Figure 7f, the height of above ground biomass suffers a significant decrease from well watered to water stress conditions, with a statistical relevance in all treatments (p<0.05). There were no observed differences between treatments among water status.
WWB WWB WWBF WWBF WS B WS B WSBF WSBF WW WW WWF WWF WS WS WSF WSF