Seasonal variation in the maximum rate of leaf gas
exchange of canopy and understory tree species in
an Amazonian semi-deciduous forest
Kerrie M. sendall
1, george l. Vourlitis
1*, and francisco a. lobo
21 Biological Sciences Department, California State University, San Marcos, California, USA.
2 Departamento de Solos e Engenharia Rural, Universidade Federal de Mato Grosso, Cuiabá, Mato Grosso, Brazil.
* Corresponding Author: George L Vourlitis, Biological Sciences Department, California State University, San Marcos, California, USA. Phone (760) 750-4119; Fax (760) 750-3440; email: [email protected] Received: 31 March 2009; Accepted: 04 June 2009
abstract
Leaf gas exchange, water potential, and specific leaf area of two tropical semi-deciduous tree species, Brosimum lactescens S. Moore and Tovomita schomburgkii Planch & Triana, were quantified to establish how these properties were affected by seasonal variations in rainfall and leaf canopy position. The study was conducted at a site near Sinop Mato Grosso, Brazil, which is located within the
ecotone of savanna and tropical rain forest. Both species exhibited significant declines in leaf water potential (L), specific leaf area, area- and mass-based light saturated photosynthesis and dark respiration, and maximum stomatal conductance during the dry-season, suggesting that leaf structural properties and gas exchange are significantly altered by drought that develops during the 4-month dry season. Internal leaf CO2 concentrations (Ci) were consistently lower during the dry season suggesting that the decline in maximum
photosynthesis was due in part to a decline in stomatal conductance. However, seasonal variations in leaf gas exchange were larger for upper-canopy leaves, indicating an important interaction between drought stress and canopy position. The seasonal variation in leaf gas exchange and morphology was presumably due to a combination of drought stress and leaf lifespan. The results of this study suggest that drought has important implications for the leaf physiology and morphology of semi-deciduous Amazonian forest trees.
Key words: Brazil, Brosimum lactescens, climate change, ecotone, photosynthetic response, Tovomita schomburgkii, tropical transitional forest.
introduction
Amazonian semi-deciduous forests are located within the savanna (cerrado)-rainforest ecotone along the southern and eastern borders of the Amazon Basin. Under current climate conditions the annual carbon budget of these forests appears to be in balance (Vourlitis et al. 2001, 2004, 2005; Keller et al. 2004: Priante et al. 2004). However, semi-deciduous forests of the southern Amazon Basin have experienced significant temperature increases over the last 30 years (Malhi and Wright 2005) and are also subjected to periodic warming and
drought during El Niño (Potter et al. 2004). Drought can reduce net primary production (NPP), net ecosystem production (NEP), and evapotranspiration (Nepstad et al. 2002; Priante et al. 2004; Vourlitis et al. 2002, 2008), and cause an increase tree mortality (Condit et al., 1995). Thus, understanding how drought influences rates of C and H2O exchange is important
for understanding current and future rates of NPP, NEP, and evapotranspiration.
Seasonal patterns of C and H2O exchange are
are regulated by a trade-off between seasonal patterns in rainfall and light availability. While these variations may be small in amplitude, they can significantly alter the physiological behavior of plants (Hogan et al. 1995; Miranda et al. 2005). In general, rates of photosynthesis increase considerably during the wet-season, even though an increase in cloudiness can limit light availability, because plants are exposed to high levels of soil water content, while declines in water availability during the dry season cause an overall reduction in leaf water potential and maximum photosynthesis (Pearcy 1987, Miranda et al. 1996, Sun et al. 1996, Miranda et al. 2005). However, the effects of seasonal drought are not likely to be similar for canopy and understory leaves and trees because of differences in physiology and resource allocation, phenology, and/or canopy growth microclimate (Boardman 1977; Cabral et al. 1996). For example, canopy trees are exposed to higher light, warmer temperatures, and lower atmospheric humidity than understory trees (Cabral et al. 1996), which can limit rates of gas exchange (Chaves et al. 1992). Leaves in the upper-canopy may have higher tissue N concentration, which will afford higher rates of maximum photosynthesis but at a higher respiratory cost (Reich and Walters 1994; Meir et al. 2001). Large trees may also have deep roots with access to water that can sustain high rates of gas exchange during the dry season (Nepstad et al. 1994).
Although a good deal of research has addressed how drought and light availability affect rates of photosynthesis in tropical forests, less is known about how these rates are affected by seasonality. This research is especially important in seasonally dry tropical forests, which experience significant temporal variation in rainfall and soil water content. Climate change from deforestation and fossil fuel combustion is anticipated to increase the magnitude and/or duration of seasonal drought (Cramer et al. 2005; Cowling et al., 2005), and semi-deciduous tropical forests are likely to be very sensitive climate change due to their transitional nature (Longman and Jenik 1992; Arris and Eagleson 1994; Vourlitis et al. 2005). Thus, the objective of this study was to evaluate how leaf gas exchange and related traits were influenced by seasonality and canopy position in a semi-deciduous, tropical transitional forest in the southern Amazon Basin. We hypothesize that seasonal variations in gas exchange
will be large and correlated with variations in rainfall; however, the magnitude of the seasonal variation in gas exchange will be a function of canopy position.
Materials and Methods
Site and species descriptions:The study was conducted
in an intact, mature, upland (terra firme) semi-deciduous forest located near Sinop, Mato Grosso, Brazil (11°24.75’S; 55°19.50’W) at an elevation of 423 m above sea level. This region is within the rainforest-savanna transition zone, which in northern Mato Grosso lies between 9 and 14°S latitude (Ackerly et al. 1989). Maximum canopy height is 25-28 m, and a survey of the area indicated that there are 35 families and 80 species of trees with a diameter > 10 cm, including
Protium sagotianum Marchland, Brosimum lactescens (S. Moore) C. C. Berg, Tovomita schomburgkii Planch & Triana, and Qualea paraensis Ducke. However, three species, P. sagotianum (Burseraceae), B. lactescens (Moraceae), and T. schomburgkii (Clusiaceae), make up about 50% of individuals. Leaf area index (LAI) varies between 6.0 m2m-2 at
the end of the wet season (April) and 2.5 m2m-2 at the end of
the dry season (August) reflecting the semi-deciduous nature of the forest (Vourlitis et al. 2004; Sanches et al. 2008a). The soil is a quartzipsamments with a sandy, porous texture that drains rapidly after rainfall. The mean annual air temperature is approximately 24°C, and average annual rainfall is about 2.0 m (Vourlitis et al. 2002). About half of the annual rainfall is received during the December-February wet season while only about 1% occurs during the June-September dry season (Vourlitis et al. 2002).
Two species located near a 40 m tall tower at the study site were selected for measurement due to their proximity to the tower or because they were short enough to be measured from the forest floor. Brosimum lactescens (Moraceae) is a semi-deciduous canopy emergent tree found in Amazonian evergreen and semi-deciduous forests (Ackerly et al. 1989, Lorenzi 2000). At our study site this species is 25-28 m tall with an average (+ 1 SD) diameter of 24.6 + 11.5 cm.
Gas exchange measurements: Photosynthetic light-response curves were generated using a portable photosynthesis system (model LI-6400, LI-COR, Lincoln, NE., USA). One B. lactescens and three T. schomburgkii
individuals were sampled during each season, because these trees were accessible either from the forest floor or from the tower at varying heights. In order to obtain multiple in situ
measurements high within the forest canopy the leaves had to be readily accessible from the tower, which is why only one B. lactescens individual was sampled.
B. lactescens leaves were measured at canopy heights of 28, 20, and 12 m, while T. schomburgkii leaves were measured at 12, 10, and 1 m. Twelve light curves were generated at each of these heights during both the dry (July 2005) and wet (January 2006) seasons. To determine the effect of humidity on leaf gas exchange half of the light curves (n = 6) were generated at a relative humidity of 40% and half were generated at a relative humidity of 70%. These humidity levels corresponded to a leaf-air vapor pressure deficit of 2.6 kPa and 1.5 kPa, respectively given the temperature conditions associated with the photosynthesis measurements, and are indicative of the mid-day relative humidity and atmospheric vapor pressure deficit that canopy leaves are exposed to during the dry and wet seasons, respectively (Vourlitis et al. 2004; 2005, 2008). Leaves were exposed to 400 µmol mol-1
CO2 and photosynthetic photon flux density (Q) levels of 2000,
1500, 1000, 500, 250, 100, 50 and 0 µmol quanta m-2s-1
using the LI-6400 LED light source. Chamber temperature was held at 28°C for all measurements.
Additional measurements: Leaf water potential (ΨL)
was measured after every light curve using a pressure chamber (model 670, PMS Instrument Company, Albany, OR, USA) on fresh leaves adjacent to those measured for gas exchange. After measurement of ΨL digital photos were
taken of the leaves and the one-sided area was quantified using digital-image processing software (Sigma Scan Pro, version 5.0, Aspire Software International, Leesburg, VA, USA). Leaves were then dried at 70 °C for at least 48 hours to determine dry mass, and the projected specific leaf area (SLA) was calculated as the ratio of one-sided leaf area per unit dry weight.
Data analysis and photosynthesis modeling:
Area-based photosynthetic data were fitted to a model that
estimated net CO2 assimilation (Pnet; µmol CO2 m-2s-1) as a
function of Q:
Pnet = (ΦQ + Pmarea – ((ΦQ + Pmarea)2 - 4θΦQPmarea)0.5) (1)
2θ
where Φ = the maximum quantum yield (µmol CO2 µmol Q-1),
Pmarea = the maximum area-based rate of net photosynthesis
(µmol CO2 m-2s-1), and θ = the dimensionless convexity of
the curve (Thornley 1976, Ögren and Evans 1993). Non-linear least squares regression was used to estimate the model coefficients (θ, Φ and Pmarea). Maximum stomatal
conductance (gmax), and internal CO2 concentrations (Ci) were
calculated using the portable photosynthesis system using the same levels of CO2, irradiance, temperature, and relative
humidity discussed above, while area-based dark respiration (Rdarea) was calculated when Q = 0 µmol quanta m-2s-1.
Mass-based maximum photosynthesis (Pmmass) and dark respiration
(Rdmass) rates were calculated by multiplying area-based rates
by SLA.
Variations in ΨL and SLA across season and canopy
height were statistically evaluated using a two-factor analysis of variance. Multivariate analysis of variance (MANOVA) was used to determine whether there were differences in Pmarea,
Pmmass, Rdarea, Rdmass, gmax, and Ci across season, height, and
relative humidity. The response of these variables as a function of season and canopy height did not differ with humidity, so in further analyses data were pooled across humidity. In the event of a significant season x height interaction a one-way analysis of variance was used to determine whether differences existed across height and/or season.
results
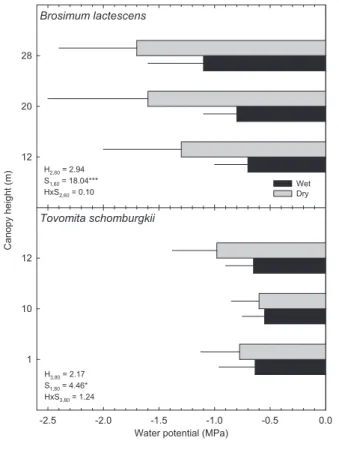
Leaf water potential and specific leaf area: Leaf water potential (ΨL) declined during the dry season for T.
schomburgkii and B. lactescens, but understory leaves experienced a smaller seasonal decline in ΨL than mid-
and upper-canopy leaves (Fig. 1). For example, the ΨL of T.
schomburgkii mid-canopy leaves (12 m) was approximately 0.3 MPa lower during the dry season, while the average decline in ΨL for T. schomburgkii understory leaves (10 m and 1 m)
was only about 0.15 MPa. The ΨL of B. lactescens
Tovomita schomburgkii
Water potential (MPa)
-2.5 -2.0 -1.5 -1.0 -0.5 0.0
Canopy
height
(m)
1 10 12
Brosimum lactescens
12 20 28
Wet Dry H2,60 = 2.94
S1,60 = 18.04***
HxS2,60 = 0.10
H3,80 = 2.17
S1,80 = 4.46*
HxS3,80 = 1.24
figure 1. Mean (+ SD) leaf water potential for Tovomita schomburgkii and
Brosimum lactescens during the wet season (black bars) and the dry season (grey bars). N = 12 measurements per canopy height, season, species combination. Also shown are the results (F-statistics and degrees of freedom) from a 2-way ANOVA for differences between season (S), canopy height (H), and the season x height interaction (H x S). *, p < 0.05; **, p < 0.01; ***, p < 0.001.
The specific leaf area (SLA) of T. schomburgkii differed significantly among seasons and canopy heights; however,
B. lactescens leaves only exhibited statistically significant differences in SLA on a seasonal basis (Fig. 2). During the dry season, the SLA for T. schomburgkii ranged from an average (+ SD) of 198 + 50.1 cm2 g-1 in the forest understory to
73 + 25.8 cm2 g-1 in the mid-canopy, while during the wet
season, the average SLA of mid-canopy leaves increased by almost 30%. Seasonal variation in SLA notwithstanding, the SLA of T. schomburgkii was negatively correlated with height. In contrast, seasonal variations in SLA were significantly positively correlated with leaf water potential for B. lactescens. The SLA of both mid-canopy and upper-canopy leaves of
B. lactescens was approximately 83 cm2 g-1 during the dry
season, but during the wet-season, the SLA of upper-canopy leaves remained at 85 cm2 g-1 while mid-canopy leaves
showed an increase of more than 20% to 110 + 6.3 cm2 g-1
(Fig. 2).
Tovomita schomburgkii
Specific leaf area (cm2/g)
0 50 100 150 200 250
Canopy
height
(m)
1 10 12
Brosimum lactescens
12 20 28
Wet Dry H2,36 = 2.59
S1,36 = 14.30**
HxS2,36 = 0.67
H2,36 = 79.43***
S1,36 = 17.32***
HxS2,36 = 0.41
figure 2. Mean (+ SD) specific leaf area for Tovomita schomburgkii and
Brosimum lactescens during the wet season (black bars) and the dry season (grey bars). N = 8 measurements per canopy height, season, species combination. Also shown are the results (F-statistics and degrees of freedom) from a 2-way ANOVA for differences between season (S), canopy height (H), and the season x height interaction (H x S). *, p < 0.05; **, p < 0.01; ***, p < 0.001.
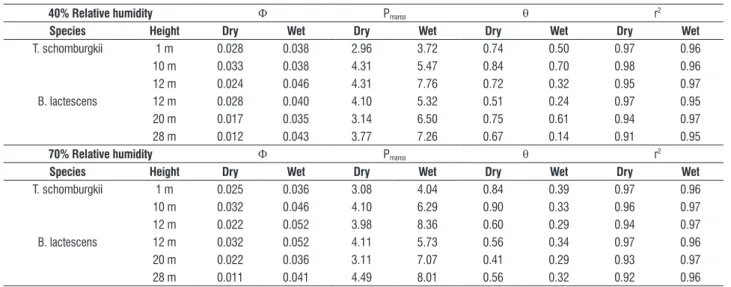
Leaf gas exchange: The photosynthetic light-response of both tree species was well described by equation 1, and the coefficient of determination (r2) values ranging between
0.95-0.97 (Table 1). The effect of humidity on the estimated coefficients was minimal; however, both species exhibited consistent seasonal differences in the quantum yield (Φ), maximum rate of light-saturated photosynthesis (Pmarea),
and the convexity index of the hyperbolic curve (Table 1). Values of the Φ and Pmarea were on average 2 and 1.7-times
table 1. Model coefficients quantum yield (Φ; µmol CO2 µmol Q-1), maximum photosynthesis (Pmarea; µmol CO2 m-2s-1), and convexity (θ; dimensionless) calculated
for Tovomita schomburgkii and Brosimum lactescens trees at 40% and 70% relative humidity using equation 1 (see Methods). Also shown is the coefficient of determination (r2) and average estimated values for each species x height combination (n = 6 measurements).
40% relative humidity Φ Pmarea θ r2
species height dry Wet dry Wet dry Wet dry Wet
T. schomburgkii 1 m 0.028 0.038 2.96 3.72 0.74 0.50 0.97 0.96
10 m 0.033 0.038 4.31 5.47 0.84 0.70 0.98 0.96
12 m 0.024 0.046 4.31 7.76 0.72 0.32 0.95 0.97
B. lactescens 12 m 0.028 0.040 4.10 5.32 0.51 0.24 0.97 0.95
20 m 0.017 0.035 3.14 6.50 0.75 0.61 0.94 0.97
28 m 0.012 0.043 3.77 7.26 0.67 0.14 0.91 0.95
70% relative humidity Φ Pmarea θ r2
species height dry Wet dry Wet dry Wet dry Wet
T. schomburgkii 1 m 0.025 0.036 3.08 4.04 0.84 0.39 0.97 0.96
10 m 0.032 0.046 4.10 6.29 0.90 0.33 0.96 0.97
12 m 0.022 0.052 3.98 8.36 0.60 0.29 0.94 0.97
B. lactescens 12 m 0.032 0.052 4.11 5.73 0.56 0.34 0.97 0.96
20 m 0.022 0.036 3.11 7.07 0.41 0.29 0.93 0.97
28 m 0.011 0.041 4.49 8.01 0.56 0.32 0.92 0.96
The results of the MANOVA indicated a significant main effect of season and height, and a significant season by height interaction on area- and mass-based light saturated photosynthesis (Pmarea, Pmmass), area- and mass-based dark
respiration (Rdarea, Rdmass), maximum stomatal conductance
(gmax), and internal CO2 concentration (Ci) (Table 2). Both
species, regardless of their canopy position, exhibited significantly higher rates of Pmarea during the wet season,
though the smallest increases were seen in understory leaves (Fig. 3). Upper-canopy (20 and 28 m) B. lactescens
and mid-canopy (12 m) T. schomburgkii leaves exhibited the highest rates of Pmarea, with mean (± SD) rates of 7.2 ± 0.84
and 7.9 ± 0.81 µmol CO2 m-2s-1, respectively. Mid-canopy T.
schomburgkii leaves experienced a 40-50% increase in Pmarea
during the wet season, while understory leaves exhibited smaller increases of 15-30%. Upper-canopy leaves of B. lactescens experienced a 40-55% increase in Pmarea, while
mid-canopy leaves increased by 25-30%. Pmarea increased
with canopy height during both the wet and dry seasons in
T. schomburgkii leaves, but increases with height were only observed during the wet season for B. lactescens. Rates of Pmmass responded similarly to rates of Pmarea (data not shown),
increasing significantly during the wet season at all canopy heights; however, canopy position did not have as large an effect on rates of Pmmass.
Tovomita schomburgkii
P max(mol m
-2s-1)
0 2 4 6 8 10
1 10 12
Brosimum lactescens
Canopy
height
(m)
12 20 28
Wet Dry H2,65 = 2.7
S1,65 = 86.3***
H2,89 = 37.0*** S1,88 = 27.7***
table 2. Response of area- and mass-based maximum photosynthesis (Pmarea,
Pmmass), area- and mass-based dark respiration, (Rdarea, Rdmass), maximum
stomatal conductance (gmax), and internal CO2 concentration (Ci) of Tovomita schomburgkii and Brosimum lactescens to variations in humidity, height, and season. Shown are the results of a Multivariate Analysis of Variance (MANOVA) including the probability of type-I error (p-value), the F-statistic calculated using Wilks’ criterion, and the associated effect and error degrees of freedom (effect, error df).
tovomita schomburgkii F-statistic df p
Humidity 1.20 6,73 0.31
Height 141.48 12,146 < 0.001
Season 91.21 6,73 < 0.001
Humidity x Height 0.77 12,146 0.68
Humidity x Season 1.85 6,73 0.10
Height x Season 11.74 12,146 < 0.001
Humidity x Height x Season 0.77 12,146 0.68
Brosimum lactescens F-statistic df p
Humidity 1.00 6,49 0.44
Height 41.98 12,98 < 0.001
Season 446.24 6,49 < 0.001
Humidity x Height 0.55 12,98 0.88
Humidity x Season 1.02 6,49 0.42
Height x Season 33.47 12,98 < 0.001
Humidity x Height x Season 0.26 12,98 0.99
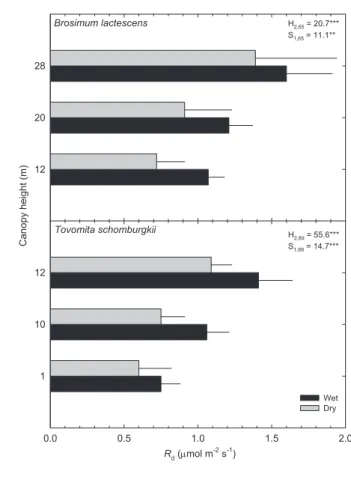
Average rates of Rdarea and Rdmass were also consistently
higher during the wet season for both species. The smallest seasonal variation in Rdarea was observed in the understory
and upper-canopy leaves, which experienced increases of 15-25% in the wet season, whereas mid-canopy leaves displayed seasonal increases of 30-50% (Fig. 4). Rdarea also tended
to increase with height in the forest canopy where leaves were exposed to more sunlight. The Rdmass (data not shown)
response to canopy height in both species was very similar to the response of Pmmass, with B. lactescens exhibiting very little
change with canopy height within season and T. schomburgkii
exhibiting large differences in the dry season only.
During the dry season, maximum stomatal conductance (gmax) was consistently less than 65 mmol m-2s-1 at all canopy
heights; however during the wet season, gmax increased
considerably in leaves higher in the canopy that are exposed to higher levels of irradiance, reaching levels as high as 175 mmol m-2s-1 (Fig. 5). Understory leaves also experienced
an increase in gmax during the wet-season, but it was much
smaller than in leaves exposed to more sunlight. Mid-canopy (12 m) B. lactescens leaves exhibited an increase of 52-57% while the understory leaves of T. schomburgkii had the smallest increase of 18-42%.
Values of Ci were consistently higher in the wet-season
than in the dry season (Fig. 5). The largest seasonal differences in Ci were observed in mid- and upper-canopy plants, which
exhibited increases of 7-12% in the wet season, while smaller increases were observed in the understory, ranging from 0-5%. The average (+ SD) ratio of internal CO2 concentration
(Ci) to ambient atmospheric CO2 (Ca) was 0.64 + 0.03 during
the dry season and 0.71 + 0.03 during the wet season. The optimal ratio for C3 plants is 0.70 (Wong et al.1979),
which indicates that photosynthesis may have been limited by available internal CO2 during the dry season (Miranda et
al.2005).
Brosimum lactescens
Canopy height
(m) 12
20 28
Tovomita schomburgkii
Rd (mol m-2 s-1)
0.0 0.5 1.0 1.5 2.0
1 10 12
H2,65 = 20.7***
S1,65 = 11.1**
H2,89 = 55.6***
S1,88 = 14.7***
Wet Dry
Brosimum lactescens
Canopy
h
eight
(m
) 12
20 28
Wet Dry
Brosimum lactescens
Tovomita schomburgkii
0 50 100 150 200 250 300
Tovomita schomburgkii
gmax (mmol m -2
s-1)
0 50 100 150 200
1 10 12
Ci (mol mol -1
)
H2,65 = 1.7
S1,65 = 189.3***
H2,89 = 19.5***
S1,88 = 57.0***
H2,89 = 3.8*
S1,88 = 13.8***
H2,65 = 3.1
S1,65 = 28.9***
figure 5. Mean (+ SD) area-based stomatal conductance (gmax; left-panels) and internal leaf CO2 concentration (Ci; right-panels) for Tovomita schomburgkii and Brosimum lactescens during the wet season (black bars) and the dry season (grey bars). N = 12 measurements per canopy height, season, species combination. Also shown are the results (F-statistics and degrees of freedom) from individual 1-way ANOVAs for differences between season (S) and canopy height (H). *, p < 0.05; **, p < 0.01; ***, p < 0.001. Data were pooled across humidity because the leaf gas exchange response did not differ with humidity. One-way ANOVAs were conducted because MANOVA analyses revealed a significant season x height interaction.
discussion
We hypothesized that the leaf gas exchange of T. schomburgkii and B. lactescens would be significantly lower in response to seasonal drought; however, the decline in gas exchange would be larger for leaves in the upper canopy. Our results support this hypothesis, as all measures of leaf gas exchange were significantly lower during the dry season and the significant season x height interaction indicates that the sensitivity of seasonal drought was dependent on canopy position (Table 2).
Large seasonal variations in leaf gas exchange were expected given that the majority of the rainfall in this region falls during the wet season, while only 1% falls during the dry season (Vourlitis et al. 2002, Keller et al. 2004). Since the soils in the study site drain rapidly after rainfall, the forest can experience
significant drought during the dry season (Malhi et al. 1998, Williams et al.1998). With drought plants tend to close their stomata due to increasing evaporative demand at the surface of the leaf, which in turn decreases leaf photosynthetic rates (Meinzer et al. 1993), and even slight decreases in leaf water potential (ΨL) can trigger stomatal closing (Wright et al.1992,
Allen and Pearcy 2000). Interestingly, recent data suggests that rates of sap flow for B. lactescens and T. schomburgkii
the dry season, coupled with possible limitations in hydraulic conductance, would lead to a decline in ΨL and gmax (Meinzer
et al. 1993; Vourlitis et al. 2008).
Understory leaves of T. schomburgkii experienced the smallest seasonal variation in Pmarea, Pmmass, and gmax, perhaps
because these leaves are exposed to lower levels of sunlight and experience a lower evaporative demand (Whitehead et al. 1981, Tobin et al. 1999). These tree species also exhibited smaller seasonal variations in sap flow than taller trees in the forest canopy (Vourlitis et al. 2008), suggesting more consistent seasonal rates of leaf gas exchange. The internal CO2 concentrations (Ci) of these understory leaves
remained relatively constant between seasons, decreasing by less that 6% during the dry season, indicating relatively small stomatal limitations to CO2 diffusion. Upper-canopy B.
lactescens leaves and mid-canopy leaves of both species exhibited substantially larger seasonal variation in Pmarea,
Pmmass, and gmax than understory T. schomburgkii leaves. In all
cases, the ΨL in the mid- and upper-canopy was significantly
higher during the wet season, so it appears that these leaves experienced less water stress during the wet season and were able to increase levels of stomatal conductance (Whitehead et al.1981; Yordanov et al. 2000). However, the significant increase in photosynthetic rates that was observed in upper-canopy leaves does not appear to be fully explained by the increased diffusion of CO2 considering that the Ci during the
wet season increased by only as much as 12%. Additionally, the increase in photosynthetic rates during the wet season did not coincide with increased leaf nitrogen (data not shown), which is known to affect the rate at which plants can fix CO2
for use in photosynthesis (Evans 1989).
Large seasonal variation in Pmarea, Pmmass, and gmax may
have been caused in part by differences in leaf age (Hogan 1988; Reich et al.1991; Osada et al.2001). Leaves generally develop and become fully expanded during the wet season when photosynthetic rates, SLA, and stomatal conductance are highest (Miyaji et al. 1997). These leaf traits are negatively correlated with leaf age (Chabot and Hicks 1982; Field and Mooney 1986) and decline throughout the year until the dry season when leaf shedding occurs in response to drought (Reich and Borchert 1984; Sanches et al. 2008b).
Our data suggest that seasonal variations in rainfall distribution and drought significantly alter the leaf gas exchange of tropical understory and canopy tree species.
These data are consistent with other studies in tropical savanna (Franco 1998; Prado et al. 2004), semi-deciduous forest (Hogan et al. 1995; Miranda et al. 2005), and rainforest (de A. Sa et al. 1996; Bonal et al. 2000), and suggest that periodic drought represents a key control on tropical tree productivity. Given the anticipated 3-4ºC increase in average annual temperature for the Brazilian tropics (Giorgi et al. 2001), the potential magnitude and/or duration of seasonal drought is likely to increase. Anticipated changes in precipitation are expected to be small, ranging from 0.0-1.0 mm d-1, but many
models predict an intensification of the dry season in eastern South America (Malhi et al. 1999; Giorgi et al. 2001). Higher temperatures may lead to increased water stress (Malhi et al. 1999), and species that are more vulnerable to decreases in water potential will have a decreased gas exchange and likelihood of survival. Thus, changes in gas exchange may significantly alter the species composition and productivity.
acknowledgments: This research was supported by the National Science Foundation, Division of Environmental Biology-Ecosystem Studies (DEB-0343964). Additional support was provided by the Conselho Nacional de Desenvolvimento Científico e Tecnológico (CNPq), California State University, San Marcos (CSUSM), and the Universidade Federal de Mato Grosso (UFMT). The authors thank O. Borges and P. Bambi for field and laboratory assistance.
references
Ackerly, D.D., W.W. Thomas, C.A.C. Ferreira and J.R. Pirani. 1989. The forest-cerrado transition zone in southern Amazonia: results of the 1985 Projeto Flora Amazônica Expedition to Mato Grosso. Brittonia 41:113-128. Allen, M.T. and R.W. Pearcy. 2000. Stomatal behavior and photosynthetic performance under dynamic light regimes in a seasonally dry tropical rain forest. Oecologia 122:470-478.
Arris LL & PS Eagleson (1994) A water use model for locating the boreal/ deciduous forest ecotone in eastern North America. Water Res. R. 30: 1-9. Boardman, N.K. 1977. Comparative photosynthesis of sun and shade plants. Annual Review of Plant Physiology 28:355-377.
Bonal, D., T. S. Barigah, A. Granier, and J. M. Guehl (2000) Late-stage canopy tree species with extremely low δ13C and high stomatal sensitivity to drought
in the tropical rain forest of French Guiana. Plant, Cell and Environment 23: 445-459.
Chaves MM, ML Osorio, J Osorio & JS Pereira (1992) The photosynthetic response of Lupinus albus to high temperature is dependent on irradiance and leaf water status. Photosynthetica27: 521-528.
Chazdon, R.L. and N. Fetcher. 1984. Light environments of tropical forests.
In Physiological Ecology of Plants in the Wet Tropics. Eds. E. Medina, H.A. Mooney and C. Vasquez-Yanes. Junk, The Hague. pp 27-36.
Condit, R., S.P. Hubbell and R.B. Foster. 1995. Mortality rates of 205 Neotropical tree and shrub species and the impact of a severe drought. Ecological Monographs 65:419-439.
Cowling, S.A., R.A. Betts, P.M. Cox, V.J. Ettwein, C.D. Jones, M.A. Maslin and S.A. Spall. 2005. Modelling the past and future fate of the Amazonian forest. Pages 191-198 in Mahli, Y and O. L. Phillips (eds), Tropical Forests and Global Atmospheric Change, Oxford University Press, Oxford, UK.
Cramer, W., A. Bondeau, S. Schaphoff, W. Lucht, B. Smith, and S. Sitch. 2005. Twenty-first century atmospheric change and deforestation: Potential impacts on tropical forests. Pages 17-30 in Mahli, Y and O. L. Phillips, editors. Tropical Forests and Global Atmospheric Change. Oxford University Press, Oxford, UK.
de A. Sa., T. D., J. de P. R. da Costa, and J. M. Roberts, Forest and pasture conductances in southern Para, Amazonia, pages 241-264 in Gash, J. H. C., C. A. Nobre, J. M. Roberts & R. L. Victoria (eds), Amazonian climate and deforestation. J. M. Wiley and Sons, New York, NY, USA, 1996.
Evans, J.R. 1989. Partitioning of nitrogen between and within leaves grown under different irradiances. Australian Journal of Plant Physiology 16:533-548.
Field, C. and H.A. Mooney. 1986. The photosynthesis–nitrogen relationship in wild plants. In On the Economy of Plant Form and Function. Ed. T.J. Givnish. Cambridge University Press, Cambridge. pp 25-55.
Franco, A. C. 1998. Seasonal patterns of gas exchange, water relations and growth of Roupala montana, an evergreen savanna species. Plant Ecology 136: 69–76.
Giorgi, F., B. Hewitson, J. Christensen, M. Hulme, H. von Storch, P. Whetton, R. Jones, L. Mearns, and C. Fu. 2001. Regional climate information-Evaluation and projections. Pages 585-638 in Houghton, J. T., Y. Ding, D. J. Griggs, M. Nogour, P. F. van der Linder, x. Dai, K. Maskell, and C. A. Johnson, editors. Climate Change 2001: The Sceintific Basis. Intergovernmental Panel on Climate Change, Cambridge University Press, Cambridge, UK.
Hogan, K.P. 1988. Photosynthesis in two neotropical palm species. Functional Ecology 2:371-377.
Hogan, K.P., A.P. Smith and M. Samaniego. 1995. Gas exchange in six tropical semi-deciduous forest canopy tree species during the wet and dry seasons. Biotropica 27:324-333.
Keller, M., A. Alencar, G.P. Asner, B. Braswell, M. Bustamante, E. Davidson, T. Feldpausch, E. Fernandez, M. Goulden, P. Kabat, B. Kruijt, F. Luizão, S. Miller, D. Markewitz, A.D. Nobre, C.A. Nobre, N. Priante-Filho, H. Da Rocha, P. Silva Dias, C. Von Randow and G.L. Vourlitis. 2004. Ecological research in the large-scale biosphere-atmosphere experiment in Amazonia: Early results. Ecological Applications 14:S3-S16.
Longman, K.A. and J. Jenik. 1992. Forest-savanna boundaries: General considerations. In Nature and Dynamics of Forest-Savanna Boundaries. Eds. P.A. Furley, J. Proctor and J.A. Ratter. Chapman and Hall, Inc., New York. pp 3-20.
Lorenzi, H. 2000. Avores Brasileiras, Vol. 1. Instituto Plantarum de Estudos da Flora, Ltd., São Paulo, Brazil.
Malhi, Y. and J. Wright. 2005. Late-twentieth-century patterns and trends in the climate of tropical forest regions. In Tropical Forests and Global Atmospheric Change. Eds. Y. Malhi and O.L. Phillips. Oxford University Press, Oxford. pp 3-16.
Malhi, Y., A.D. Nobre, J. Grace, B. Kruijt, M.G.P. Pereira, A. Culf and S. Scott. 1998. Carbon dioxide transfer over a Central Amazonian rain forest. Journal of Geophysical Research D24:31593-31612.
Malhi, Y., D.D. Baldocchi and P.G. Jarvis. 1999. The carbon balance of tropical, temperate and boreal forests. Plant, Cell and Environment 22:715-740. Mariz, G. 1974. Two new species of Tovomita Aublet (Guttiferae) from northeastern Brazil. Bulletin of the Torrey Botanical Club 101:367-371. Meinzer, F.C., G. Goldstein, N.M. Holbrook, P. Jackson and J. Cavalier. 1993. Stomatal and environmental control of transpiration in a lowland tropical forest tree. Plant, Call and Environment 16:429-436.
Meir, P., J. Grace and A.C. Miranda. 2001. Leaf respiration in two tropical rainforests: constraints on physiology by phosphorus, nitrogen and temperature. Functional Ecology 15:378-387.
Miranda, A.C., H.S. Miranda, J. Lloyd, J. Grace, J.A. Mcintyre, P. Meir, P. Riggan, R. Lockwood and J. Brass. 1996. Carbon dioxide fluxes over a cerrado sensu stricto in central Brazil. In Amazonian deforestation and climate Eds. J.H.C. Gash, C.A. Nobre, J.M. Roberts and R.L. Victoria. J.M. Wiley and Sons, New York. pp 353-361.
Miranda, E.J., N. Priante, P.C. Priante, J.H. Campelo Jr., G.S. Suli, C.L. Fritzen and G.L. Vourlitis. 2005. Leaf and forest CO2 exchange of a transitional tropical
forest in southern Amazonia. Journal of Tropical Ecology 21:451-460. Miyaji, K., W.S. Da Silva and P.T. Alvim. 1997. Productivity of leaves of a tropical tree, Theobroma cacao, grown under shading, in relation to leaf age and light conditions within the canopy. New Phytologist 137:463-472. Nepstad DC et al. (2002) The effects of partial throughfall exclusion on canopy processes, aboveground production, and biogeochemistry of an Amazon Forest. Journal of Geophysical Research107(d20): 8085, doi: 10.1029/2001JD000360.
Ögren, E. and J.R. Evans. 1993. Photosynthetic light-response curves I. The influence of CO2 partial pressure and leaf inversion. Planta 189:182-190.
Osada, N., H. Takeda, A. Furukawa and M. Awang. 2001. Leaf dynamics and maintenance of tree crowns in a Malaysian rain forest stand. Journal of Ecology 89:774-782.
Pearcy, R.W. 1987. Photosynthetic gas exchange responses of Australian tropical forest trees in canopy, gap and understory micro-environments. Functional Ecology 1:169-178.
Potter C, S Klooster, M Steinbach, PN Tan, V Kumar, S Shekhar & CR Carvalho (2004) Understanding global teleconnections of climate to regional model estimates of Amazon ecosystem carbon fluxes. Glob. Chan. Biol.10: 693–703. Prado, C. H. B. A., Z. Wenhui, M. H. C. Rojas, and G. M. Souza. 2004. Seasonal leaf gas exchange and water potential in a woody cerrado species community. Brazilian Journal of Plant Physiology 16: 7-16.
Priante-Filho, N., G.L. Vourlitis, M.M.S. Hayashi, J. de S. Noguiera, J.H. Campelo Jr., P.C. Nunes, L.S.E. Sousa, E.G. Couto, W. Hoeger, F. Raiter, J.L. Trienweiler, E.J. Miranda, P.C. Priante, C.L. Fritzen, M. Lacerda, L.C. Pereira, M.S. Biudes, G.S. Suli, S. Shiraiwa, S.R. Do Paulo and M. Silveira. 2004. Comparison of the mass and energy exchange of a pasture and a mature transitional tropical forest of the southern Amazon Basin during a seasonal transition. Global Change Biology 10:863-876.
Reich, P.B. and M.B. Walters. 1994. Photosynthesis-nitrogen relations in Amazonian tree species. Oecologia 97:73-81.
Reich, P.B. and R. Borchert. 1984. Water stress and tree phenology in a tropical dry forest in the lowlands of Costa Rica. Journal of Ecology 72:61-74.
Reich, P.B., C. Uhl, M.B. Walters and D.S. Ellsworth. 1991. Leaf lifespan as a determinant of leaf structure and function among 23 amazonian tree species. Oecologia 86:16-24.
Sanches L, NLR Andrade, JS Nogueira, MS Biudes & GL Vourlitis (2008a) Índice de área foliar em floresta de transição Amazonia cerrado em diferentes médotos de estimative. Ciência e Natura 30: 57 - 69
Sun, J., J.N. Nishio and T.C. Vogelmann. 1996. High-light effects on CO2
fixation gradients across leaves. Plant, Cell and Environment 19:1261-1271. Thornley, J.H.M. 1976. Mathematical models in plant physiology. Academic Press, London. pp 92-110.
Tobin, M.F., O.R. Lopez and T.A. Kursar. 1999. Responses of tropical understory plants to a severe drought: tolerance and avoidance of water stress. Biotropica 31:570-578.
Vourlitis, G.L., N. Priante-Filho, M.M.S. Hayashi, J.S. Noguiera, F.T. Caseiro and J. Holanda Campelo. 2001. Seasonal variations in the net CO2 exchange
of a mature Amazonian transitional tropical forest (cerradão). Functional Ecology 15:388-395.
Vourlitis, G.L., N. Priante-Filho, M.M.S. Hayashi, J.S. Noguiera, F.T. Caseiro and J. Holanda Campelo. 2002. Seasonal variations in the evapotranspiration of a transitional tropical forest of Mato Grosso, Brazil. Water Resources Research 38:1-11.
Vourlitis, G.L., N. Priante-Filho, M.M.S. Hayashi, J.S. Noguiera, F. Raiter, W. Hoegel and J.H. Campelo. 2004. Effects of meteorological variations on the CO2 exchange of a Brazilian transitional tropical forest. Ecological Applications
14:S89-S100.
Vourlitis, G.L., J.S. Nogueira, N. Priante-Filho, W. Hoeger, F. Raiter, M.S. Biudes, J.C. Arruda, V.B. Capistrano, J.L.B. Faria and F.A. Lobo. 2005. The
sensitivity of diel CO2 and H2O vapor exchange of a tropical transitional forest
to seasonal variation in meteorology and water availability. Earth Interactions 9: 9-027.
Vourlitis, G.L., J.S. Nogueira, F.A. Lobo, K.M. Sendall, J.L.B. Faria, C.A.A. Dias, and N.L.R. Andrade. 2008. Energy balance and canopy conductance of a tropical semi-deciduous forest of the southern Amazon Basin. Water Resources Research 44, W03412, doi: 10.1029/2006WR005526. Whitehead, D., D.U.U. Okali and F.E. Fasehun. 1981. Stomatal response to environmental variables in two tropical forest species during the dry season in Nigeria. Journal of Applied Ecology 18:571-587.
Williams, M., Y. Malhi, A.D. Nobre, E.B. Rastetter, J. Grace and M.G.P. Pereira. 1998. Seasonal variation in net carbon exchange and evapotranspiration in a Brazilian rain forest: a modeling analysis. Plant, Cell and Environment 21:953-968.
Wong, S.C., I.R. Cowan and G.D. Farquar. 1979. Stomatal conductance correlates with photosynthetic capacity. Nature 282:424-426.
Wright, S.J., J.L. Machado, S.S. Mulkey and A.P. Smith. 1992. Drought acclimation among tropical forest shrubs (Psychotria, Rubiaceae). Oecologia 89:457-463.