ISSN: 1809-4430 (on-line)
_________________________
1 Engº Agrônomo, Prof. Doutor, Instituto Federal de Educação, Ciência e Tecnologia Baiano Campus Guanambi, IF Baiano/Guanambi – BA, Fone: (77) 3493-2100, leandro.faria@guanambi.ifbaiano.edu.br
2 Eng° Agrícola, Prof. Doutor, Departamento de Engenharia Agrícola, UFV / Viçosa – MG, aasoares@ufv.br 3 Eng° Agrônomo, Prof. Doutor, Instituto Federal de Educação, Ciência e Tecnologia Baiano Campus Guanambi, IF
Baiano/Guanambi – BA, sergio.donato@guanambi.ifbaiano.edu.br
4 Eng° Agrônomo, Prof. Doutor, Instituto Federal de Educação, Ciência e Tecnologia Baiano Campus Guanambi, IF Baiano/Guanambi – BA, marcelo.rocha@guanambi.ifbaiano.edu.br
5 Engª Agrônoma, Prof.ª Doutora, Departamento de Engenharia agrícola e Solos, UESB / Vitória da Conquista – BA, lugcastro@uesb.edu.br
THE EFFECTS OF IRRIGATION MANAGEMENT ON FLORAL INDUCTION OF
‘TOMMY ATKINS' MANGO IN BAHIA SEMIARID
Doi:http://dx.doi.org/10.1590/1809-4430-Eng.Agric.v36n3p 387-398/2016
LEANDRO N. FARIA1, ANTÔNIO A. SOARES (In memoriam)2, SÉRGIO L. R. DONATO3,
MARCELO R. DOS SANTOS4, LUCIANA G. CASTRO5
ABSTRACT: This study aimed to evaluate reduction strategies of irrigation for proper management of floral induction and production of 'Tommy Atkins' mangoes, in the semiarid region of the Bahia state, Brazil. Five treatments with reduced irrigation levels based on crop evapotranspiration (ETc) were applied in two development stages, FI - flowering and FII – fruiting. Water depths were T1 - 0% of ETc in FI and 100% in FII; T2 - 25% of ETc in FI and 100% in FII; T3 - 50% of ETc in FI and 100% in FII; T4 - 75% of ETc in FI and 100% in FII; and T5 - 100% of ETc in FI and FII. The treatments were arranged in a randomized complete block design with six replications. Photosynthesis and transpiration rates in phases FI and FII were larger at 8 am than at 2 pm, regardless of the strategies used. These strategies lead to smaller values of photosynthesis, transpiration and leaf water potential within flowering stage. Productive characteristics were not affected by irrigation level reduction for flower induction process, only for the cycles evaluated. Strategies with 0% of ETc in FI and 100% in FII or 25% of ETc in FI and 100% in FII are appropriate to flower induction in 'Tommy Atkins' mango.
KEY WORDS:Mangifera, controlled water deficit, irrigation strategies.
MANEJO DA IRRIGAÇÃO NA INDUÇÃO FLORAL DA MANGUEIRA ‘TOMMY ATKINS’ NO SEMIÁRIDO BAIANO
RESUMO: Objetivou-se avaliar estratégias de redução de lâminas de irrigação para manejo adequado da indução floral e produção da mangueira 'Tommy Atkins', na região do semiárido baiano. Cinco tratamentos com redução de lâminas de irrigação, baseadas na evapotranspiração de cultura (ETc), foram aplicados em duas fases de desenvolvimento, FI - floração e FII - frutificação: T1, 0% da ETc na FI e 100% na FII; T2, 25% da ETc na FI e 100% na FII; T3, 50% da ETc na FI e 100% na FII; T4, 75% da ETc na FI e 100% na FII; e T5, 100% da ETc em FI e FII, dispostos num delineamento experimental em blocos casualizados, com seis repetições. As taxas de fotossíntese e de transpiração de mangueira 'Tommy Atkins', nas fases FI e FII, são maiores às 8 que às 14 horas, independentemente das estratégias utilizadas. Essas estratégias conduzem a menores valores de fotossíntese, transpiração e de potencial hídrico foliar da mangueira 'Tommy Atkins' na fase de florescimento. As características produtivas não foram influenciadas pelas estratégias de redução de lâminas de irrigação no processo de indução floral da mangueira 'Tommy Atkins', apenas pelos ciclos avaliados. Estratégias com 0% da ETc na FI e 100% na FII ou 25% da ETc na FI e 100% na FII são adequadas ao processo de indução floral da mangueira 'Tommy Atkins'.
INTRODUCTION
All Brazilian regions grow mangoes, especially those within the semi-arid Northeast. This area has become the largest mango producer, being responsible for 66.54% of the Brazilian production in 2012 - one million one hundred seventy-five thousand tons. Exports, mainly from the state of Bahia that is the second largest producer, accounted for 54% of domestic production (IBGE, 2014), making this state the largest fruit exporter in Brazil (ANUÁRIO BRASILEIRO DE FRUTICULTURA, 2013).
The Brazilian semiarid dry weather, intense insolation for a large part of the year, associated with irrigation and flowering management techniques allow successive production cycles, fruit harvest at any time of year and yield above the national average (LEITE; ALVES, 2010).
Given the expansion of mango crop in a water crisis scenario, researchers in the Brazilian semiarid have undertaken studies to improve irrigation management practices associated with flowering induction (COTRIM et al., 2011; REIS et al., 2011) to enhance local fruit yields and quality between harvests.
Water deficit is used as flowering inducer for mangoes in semiarid regions (BASSOI, 2012). However, irrigation management strategies based on controlled deficit have often been employed empirically; causing many problems such as a lack of differentiation of vegetative buds in inflorescence and physiological disorders caused water stress lack of control. Management based on water deficit, when properly applied, can increase water use efficiency, improving fruit yield and quality without negative long-term effects (SPREER et al., 2009).
Irrigation deficit technique has been studied for several crops by many authors (SAMPAIO et. al., 2010; BASSOI et al., 2011; COTRIM et al., 2011; SANTOS; MARTINEZ, 2013;
ROMERO-CONDE et al., 2014; SAMPAIO et al., 2014; GHRAB et al., 2014;LIMA et al., 2015). Conversely,
information regarding water stress during floral induction in mangoes is scarce, and questions remain on which irrigation reduction strategy is the most appropriate, without impairing this crop. The ideal time to apply water stress varies among regions, according to climate and soil conditions, what justifies these studies in different mango production poles.
The primary impact of water stress on mango is to paralyze growth and prevent vegetative flushing. During floral induction, it decreases gibberellin synthesis, which is considered a growth promoter. The fact that water stress accelerates branch maturation links it directly to ethylene production, which is responsible for plant organ maturation (SANTOS, 2012) as well as synthesis of abscisic acid. This practice enables faster and uniform branch ripening. So in theory, water should not be withheld entirely because plants need to continue photosynthesizing and accumulating reserves without vegetating. Oliveira et al. (2011) pointed out that in case of water deficit use, irrigation ought to be carried out before soil water availability is reduced to levels that alter plant metabolism, leading to decreased yields. In the vegetative stage, limited water availability can lead to a considerable decrease in yield (LEITE et al., 2015).
Regardless of the strategy used for floral induction, whether water stress or growth regulator, temperature has great influence on mango flowering and fruiting, and can condition the reversal of vegetative branches to generative ones and vice versa. Plants exposed to high temperatures (30 °C day/ 25 °C night) during bud initiation period give rise to vegetative branches, while lower temperatures (between 10 °C and 18 °C) promote the development of reproductive buds (NUÑEZ -ELISEA et al., 1996).
MATERIAL AND METHODS
The experiment was conducted in the years 2012 and 2013 in an orchard of Mangifera indica
L. 'Tommy Atkins' cultivar, of 16 years of age, grown with spacing of 8 x 8 m, on a eutrophic fluvic Neosol (Entisol). The area is located in experimental plot of the Irrigated Perimeter in Ceraíma - Bahia, which belongs to the Companhia de Desenvolvimento dos Vales do São Francisco e Parnaíba -CODEVASF (Development Company of the São Francisco and Parnaíba Valleys -
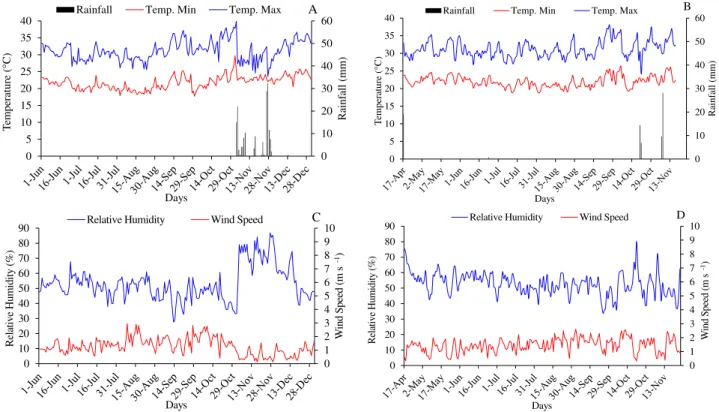
CODEVASF). The altitude is 530 m at geographic coordinates of 14° 17' 26" south latitude and 42° 42' 50" west longitude. The climatic conditions recorded in the area during the two production cycles evaluated are shown in Figure 1.
0 10 20 30 40 50 60 0 5 10 15 20 25 30 35 40 R ainf all (mm ) Te mpe ra tur e ( C) Days A
Rainfall Temp. Min Temp. Max
0 10 20 30 40 50 60 0 5 10 15 20 25 30 35 40 R ainfa ll ( mm ) Te mper ature ( C) Days B
Rainfall Temp. Min Temp. Max
0 1 2 3 4 5 6 7 8 9 10 0 10 20 30 40 50 60 70 80 90 W ind Spee d (m s -1) R elat ive Hum idi ty (%) Days C
Relative Humidity Wind Speed
0 1 2 3 4 5 6 7 8 9 10 0 10 20 30 40 50 60 70 80 90 W ind Spe ed (m s -1) R elative H umi dit y (% ) Days D
Relative Humidity Wind Speed
FIGURE 1. Maximum temperature (Tm ax), minimum temperature (Tm in) and rainfall (A) and (B),
average relative air humidity and average wind speed (C) and (D) during the first evaluation cycle (A) and (C) 06/01/2012 to 12/30/2012 and the second evaluation cycle (B) and (D) 04/17/2013 to 11/25/2013. Guanambi - BA, Brazil.
Irrigation management strategies were applied adopting controlled water stress at floral induction and 100% return at fruiting period. Irrigation was carried out via localized system, using one micro sprinkler per plant at a flow rate of 48 L h-1 and at 150 KPa pressure.
During the experiment period, crop management techniques adopted in public perimeters of irrigation in the semiarid were considered. Plants were pruned to stimulate the growth of axillary buds. Nutritional management was carried out according to the mangoes’ needs. In the first cultivation, cycle plants were fertilized with 100 g of MAP (monoammonium phosphate), 350 g urea, 150 g of potassium chloride, 60 g FTEBR-12, 250 g of magnesium sulfate, and 27.4 kg of manure by plant. In the second cycle, based on leaf analysis, the same fertilizations were repeated, besides two foliar applications of zinc sulfate (40 g 100 L-1).
By the time plant emitted the second vegetative flow during the first cycle, irrigation management was carried out daily, with water levels of 100% crop evapotranspiration (ETc).
The irrigation remained full (100% of ETc) for 20 days, within which PBZ is absorbed by the plant. Then, water depth reductions were applied based on ETc, continuing during water stress period scheduled for floral induction management, i.e. up to 60% of the plants were flowering. Sprayings with calcium nitrate (dosage of 2.5% on seven-day intervals) were initiated 35 days after application of PBZ to break bud dormancy and induce uniform flowering.
In the second cycle, management of flowering induction was conducted only with the effect of water stress, without the use of chemical stress by the growth regulator PBZ. This management, also used in some productive perimeter lots, accelerates and standardizes branch maturation, stimulating flowering. Treatments were applied at the same stage as described in the first cycle, plus three calcium nitrate sprayings (dosage of 2.5% on seven day intervals), beginning when plants had brittle leaves and epinasty of terminal branches, morphological evidence of stress, with the purpose of breaking the dormancy of buds.
Treatments consisted of five irrigation levels based on crop evapotranspiration (ETc): T1 (0% of ETc without irrigation in FI and 100% in FII), T2 (25% of ETc in FI and 100 % in FII), T3 (50% of ETc in FI and 100% in FII), T4 (75% of ETc in FI and 100% in FII) and T5 (100% of ETc in FI and FII). They were arranged in a randomized block design with six replications and one useful plant per experimental plot. Levels were reduced from 100% of the daily crop evapotranspiration during flowering induction period (FI) and 100% return during fruiting phase (FII) in two production cycles.
Water level reduction was obtained by alterations in irrigation time in valve control inserted in each treatment dropline. These levels were obtained from the reference evaporation data (ET0),
crop coefficient (Kc) and landscape coefficient (KI).
The ET0 was determined indirectly by the Penman-Monteith’s method, standard FAO Bulletin
56 (ALLEN et al., 1998), using data of local weather station set near the orchard. Solar radiation values were estimated by the Hargreaves’s equation (ALLEN et al., 1998) due to the absence of actual insolation data measured by the station. This equation considers maximum and minimum temperatures, extraterrestrial radiation and the kRS factor considering location.
The Kc values used to calculate crop evapotranspiration in both crop cycles ranged from 0.3 to 0.8, depending on phenological stage, as adopted by REIS et al. (2011) for a semiarid region. This recommendation was used because treatments were carried out during flowering induction.
The Kl was calculated considering plant shaded areas, reaching a value of 0.96, according to SANTOS (2012) and SANTOS et al. (2014b).
The ETc, in mm day-1, was determined from ET0, in mm day-1, crop coefficient and landscape
coefficient (ALLEN et al., 1998), being subsequently applied for calculations of each treatment irrigation level. Rainfall occurred in the area was quantified and deducted from crop evapotranspiration to estimate irrigation time.
Irrigation time in hours used for each treatment was calculated as described by COTRIM et al. (2011), SANTOS et al. (2013, 2014a and 2014b) and SANTOS & MARTINEZ (2013), considering an application efficiency of 0.90.
0 100 200 300 400 500 600 700 800
Acc
um
ul
ated
gros
s
water
dept
h
(mm
)
Days
A.
0 % Etc 25 % Etc 50 % Etc 75 % ETc 100 % Etc
0 100 200 300 400 500 600 700 800
Ac
cumul
ated
gross
wa
ter
de
pth (mm
)
Days
B.
0 % ETc 25 % ETc 50 % ETc 75 % ETc 100 % ETc
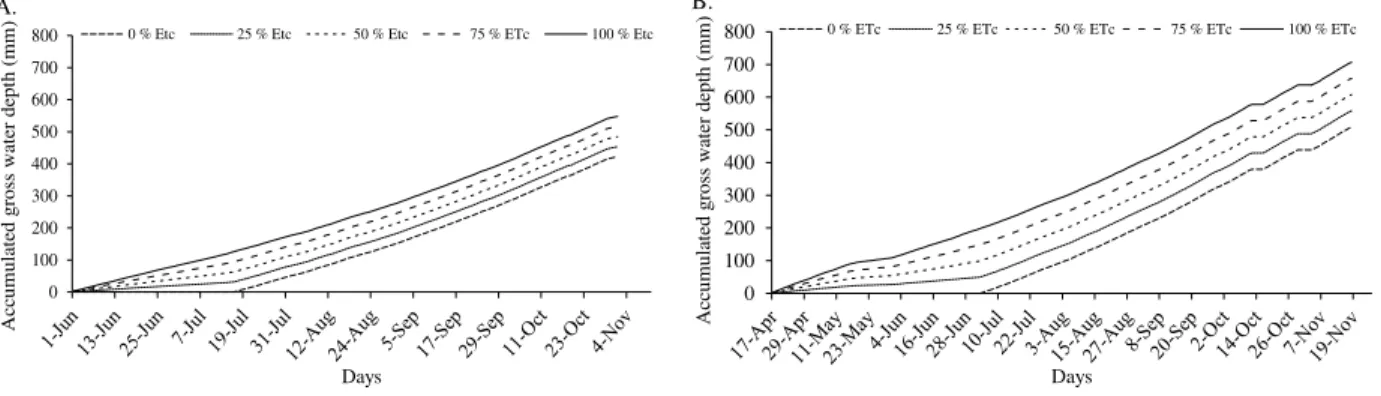
FIGURE 2. Accumulated gross water depths applied in 'Tommy Atkins' mango irrigation, for each treatment in the year of 2012 (A) and of 2013 (B) under microsprinkler irrigation conditions. Guanambi - BA, Brazil.
To evaluate water status in mangoes, we estimated leaf water potential (Ψf), which is also an
important indicator of soil water deficit. It was weekly evaluated and measured before sunrise (predawn leaf water potential) as an indicator of soil water storage, since there is a steady trend between water conditions in plants and in soil. A Scholander chamber model 3005® (Soil moisture Equipment Corp., Santa Barbara, CA, USA) was used for measurements. Samples were comprised of three leaves in each treatment replication, taken from different points of the plant. Readings were taken only in the second crop cycle, due to unavailability of the equipment in the first year of study.
In flowering and fruiting of the first evaluation cycle, net photosynthesis measurements were taken (A) expressed in µmol m-2 s-1 of CO2 and transpiration (E), in mmol m-2 s-1 of H2O.
Measurements were performed at 8 am and 2 pm, with the help of a carbon dioxide analyzer to infrared (IRGA), LCpro+® Portable Photosynthesis System (ADC BioScientific Limited, UK), with temperature, irradiance environment and airflow 200 ml min-1.
At the end of each harvest, the fruit were transported to the shed, selected by treatment considering each replication, counted, weighed and classified into five weight categories for mango: 100 (100 to 200 g), 200 (201 to 350 g), 350 (351 to 550 g), 550 (551 to 800 g) and 800 (> 800 g) as described by COTRIM (2009). The number and weight of each fruit, yield within each weight class, and total yield were compared for each treatment.
For data statistical analysis, we adopted the following parameters: a) First cycle of evaluations on photosynthesis and transpiration, being one at the time of flowering (1) and another at the fruiting (2). The experiments were set in randomized block design (RBD) with three factors arranged in sub-split plot scheme: plots testing five irrigation reduction levels based on ETc,
subplots contrasting two evaluation periods, and sub-subplots comparing two reading times - 8 am and 1 pm; b) Second cycle of evaluations on leaf water potential. The experiment was set in RBD with two factors arranged in sub-split plot scheme: plots testing five irrigation reduction levels based on ETc and subplots comparing flowering and fruiting phenological stages; c) Yield
evaluations regarding fruit classes, accounting number and weight of fruit and total fruit yield during two evaluation cycles. The experiments were set in RBD with two factors arranged in a sub-split plot scheme: plots testing five irrigation reduction levels based on ETc and in the subplots
contrasting first and second production cycles.
All data underwent variance analysis to verify significant interactions among the tested factors with further breakdown of the significant findings and comparison of means by the Tukey’s test at 5% probability.
RESULTS AND DISCUSSION
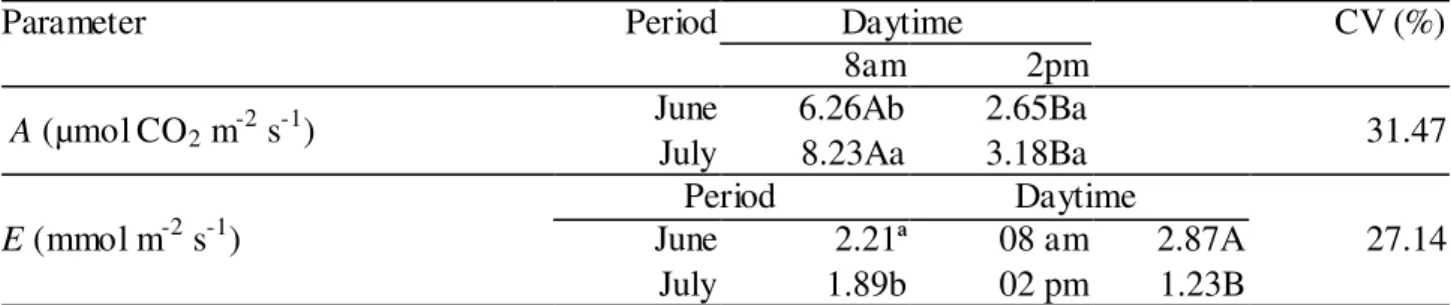
the evaluation period, photosynthesis was higher in July for measurements at 8 am, whereas afternoon readings were similar in both periods. This higher photosynthetic rates recorded in the morning time might have been due to lower temperatures compared to afternoon time, which has influence on stomatal opening, on CO2 inlets and consequently on photosynthetic biochemical
reactions. According to MEDINA et al. (2005), at temperatures above 30 °C, as shown here, photosynthesis rate is decreased, as Q10 of photosynthetic reactions is nearly two in temperatures
between 12 and 30 °C.
TABLE 1. Photosynthetic rates (A, µmol m2 s-1 of CO2) and transpiration rates (E, mmol m-2 s-1)
measured in 'Tommy Atkins' mangoes at different periods and daytimes in the flowering stage. Guanambi - BA, Brazil, 2012.
Parameter Period Daytime CV (%)
8am 2pm
A (µmol CO2 m-2 s-1) June July 6.26Ab 8.23Aa 2.65Ba 3.18Ba 31.47
E (mmol m-2 s-1)
Period Daytime
27.14
June 2.21ª 08 am 2.87A
July 1.89b 02 pm 1.23B
For photosynthesis, means followed by the same lowercase letter within columns and capital letter within rows do not differ by the Tukey’s test at 5% probability. For transpiration, means followed by the same lowercase letter within columns for periods and daytimes do not differ by the Tukey’s test at 5% probability.
Table 1 also shows that mango transpiration rates were higher at 8 am as found for photosynthesis. This similarity is related to improved water and thermal conditions during morning time, regardless of the irrigation strategies applied. In contrast to photosynthesis, transpiration rate was higher in the first evaluation period (June), than it was in the second (July). Temperature rising from 8 am to 2 pm reduced transpiration rates, highlighting a stomatal interference.
The total or partial soil water deficit lowered mango photosynthetic and transpiration rates, corroborating SANTOS et al. (2013). Measurements made by SANTOS (2012) at 138 days after flowering in 'Tommy Atkins' mangoes under water deficit showed no significant differences for the treatments studied; the author justified this result with rainfall occurrence in the area, which might have mitigated water stress to the plants, since IRGA gas-exchange analyzer make punctual photosynthesis measurements. These assessments may vary with environmental and atmospheric conditions, as well as soil moisture level at the time of measurement, which may not faithfully reflect what plants had been undergone.
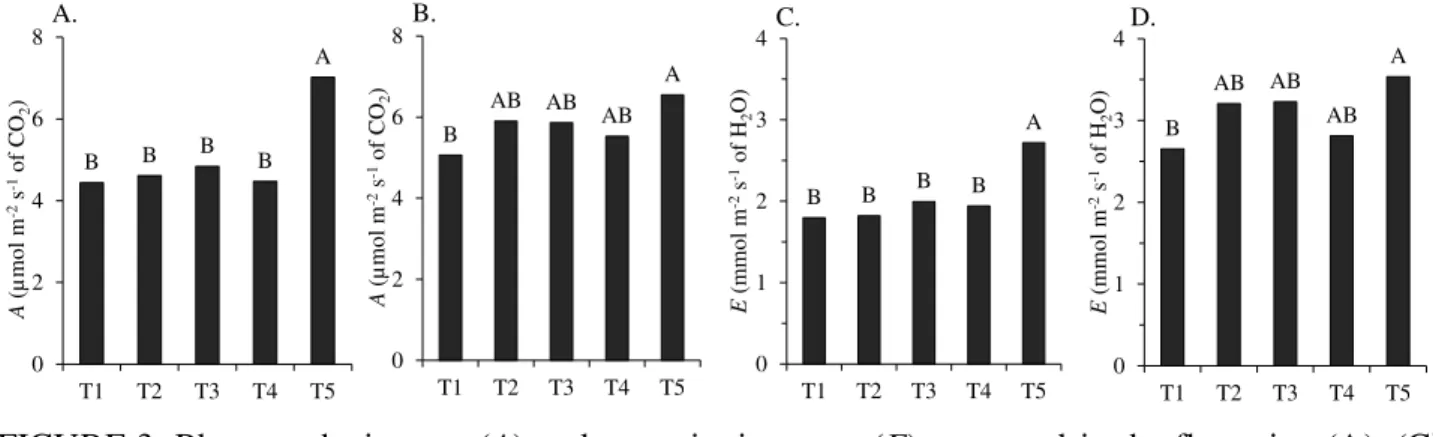
Photosynthetic rates of the 'Tommy Atkins' mangoes in the flowering and fruiting stages were also influenced by irrigation reductions based on evapotranspiration of cultivation, regardless of the period and reading time (Figure 3A, B).
B B B B A 0 1 2 3 4
T1 T2 T3 T4 T5
E (mmol m -2s -1of H2 O) C. B AB AB AB A 0 1 2 3 4
T1 T2 T3 T4 T5
E (mm ol m -2s -1of H2 O) D.
B B B B
A 0 2 4 6 8
T1 T2 T3 T4 T5
A (µ mol m -2s -1of C O2 ) A. B
AB AB AB A
0 2 4 6 8
T1 T2 T3 T4 T5
A (µ m ol m -2s -1of C O2 ) B.
FIGURE 3. Photosynthetic rates (A) and transpiration rates (E) measured in the flowering (A), (C)
and fruiting (B) stages, (D) in 'Tommy Atkins' mangoes under different irrigatio n reduction levels based on evapotranspiration of cultivation (ETc). Guanambi - BA,
Brazil, in 2012.
T1 (0% of ETc without irrigation in Phase I and 100% in Phase II), T2 (25% of ETc in FI and 100% in FII), T3 (50% of ETc in FI and 100% in FII), T4 (75% of ETc in FI and 100% in FII) and T5 (100% of ETc in FI and FII). M eans followed by the same capital letter or no letter in the group do not differ by the Tukey test at 5% probability.
As found for photosynthesis, transpiration rates at the flowering was higher in plants that received full irrigation (100% ETc) and lower in plants under different irrigation reductions (Figure 3C); again, it might have been derived from stomatal closure promoted by water deficit. In the fruiting stage, transpiration rates of plants under full irrigation were higher than those of plants under full water deficit were (Figure 3D). The transpiration rates of plants subjected to the other irrigation reduction levels were similar to each other, and to those of plants that received full irrigation and total water deficit at the time of floral induction.
Leaf transpiration decreases in crops under water stress may be explained by plant adaptations to avoid water losses. Stomatal closure is activated by sort of a signal emitted from the roots, which synthetizes abscisic acid (ABA) that is transported to shoot via xylem vessels in response to a soil water deficit. This mechanism is to hold water inside the plant; however, it interferes with CO2
assimilation and hence crop yield (TAIZ & ZEIGER, 2013).
In short, mango transpiration rates varied independently with irrigation reductions (Figure 3C) and with evaluation period and reading time (Table 1) in the flowering stage, and solely with irrigation strategies in the fruiting stage (Figure 3D). Additionally, both photosynthesis and transpiration rates were influenced by the interaction between evaluation period and reading time in the fruiting stage (Table 2).
TABLE 2. Photosynthetic (A) and transpiration (E) rates measured at different evaluation periods
and reading times in the fruiting stage of 'Tommy Atkins' mangoes. Guanambi - BA, Brazil, in 2012.
Period
Photosynthesis (µmol m2 s-1 of CO2) Transpiration (mmol m-2 s-1 of H2O)
Reading times
8 am 2 pm 8 am 2 pm
July 20th 9.37Aabc 2.56Bb 2.51Acd 1.71Bc
August 10th 9.97Aab 4.24Ba 2.39Ad 2.58Abc
August 28th 8.63Abcd 2.45Bb 2.96Acd 2.23Bc
September 14th 7.91Acd 2.33Bb 3.19Acd 2.21Bc
October 2nd 10.43Aa 2.83Bab 3.47Abc 3.53Aab
October 23rd 7.76Ad 2.41Bb 4.33Aab 3.36Bab
November 13th 6.11Ae 3.91Bab 4.98Aa 3.70Ba
CV (%) 36.72 41.14
Table 2 displays that the photosynthetic (A) and transpiration (E) rates measured in
'Tommy Atkins' mangoes in the fruiting stage were higher at 8 am compared to 2 pm in all the months of evaluation, regardless of the irrigation level reduction. Exceptions were found for transpiration rates on the days of August 10th and October 2nd, when transpiration was similar at both times; temperature rise might have caused a reduction in photosynthesis, as well as in transpiration.
At 8 am, photosynthesis was higher on October 2nd compared to the measurements made on August 28th, September 14th, October 23rd and November 13th (Table 2). In contrast, at 2 pm, it was higher on August 10th compared to July 20th, August 28th, September 14th and October 23rd. For
transpiration, 8 am reading on November 13th was similar to that of October 23rd, but higher than all other evaluation periods. At 2 pm, transpiration rate differed among the evaluation dates of November 13th, August 10th, September 14th and July 20th; of these, the last two had the lowest recorded values.
Environmental conditions have influence on plant water and thermal status, and consequently, bias gas exchanges when associated with different periods and times, as evidenced. Machado et al. (2010) pointed out that the highest values of A and E for 'Valencia' orange trees occur in the
morning, decreasing in the course of the day.
The results of our study, in which lower photosynthesis and transpiration rates were recorded in treatments with reductions of irrigation level, show that water stress alters mango plant physiology at the time of flowering and corroborates the findings of FONSECA et al. (2005). This author stated that water stress has potential to flowering induction and may replace stress caused by applications of Paclobutrazol (PBZ) in semi-arid tropical conditions, particularly during dry seasons.
Regarding leaf water potential, there was interaction at 5% probability among the different ETc based irrigation reductions, and between both phenological phases as displayed in Table 3).
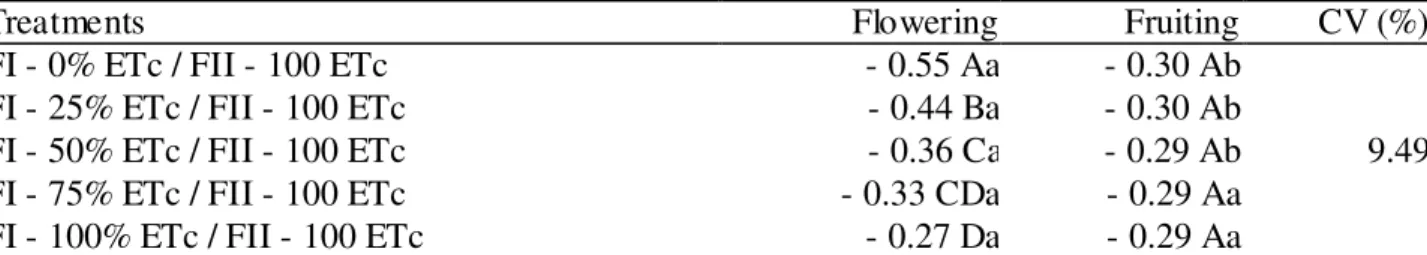
TABLE 3. Average values of predawn leaf water potential (MPa) measured in the flowering and fruiting periods of 'Tommy Atkins' mangoes under different irrigation reduction levels based on evapotranspiration of cultivation (ETc). Guanambi - BA, Brazil, in 2013.
Treatments Flowering Fruiting CV (%)
FI - 0% ETc / FII - 100 ETc - 0.55 Aa - 0.30 Ab
9.49
FI - 25% ETc / FII - 100 ETc - 0.44 Ba - 0.30 Ab
FI - 50% ETc / FII - 100 ETc - 0.36 Ca - 0.29 Ab
FI - 75% ETc / FII - 100 ETc - 0.33 CDa - 0.29 Aa
FI - 100% ETc / FII - 100 ETc - 0.27 Da - 0.29 Aa
T1 (0% of ETc without irrigation in Phase I and 100% in Phase II), T2 (25% of ETc in FI and 100% in FII), T3 (50% of ETc in FI and 100% in FII), T4 (75% of ETc in FI and 100% in FII) and T5 (100% of ETc in FI and FII) .Means followed by equal letters, lowercase in rows and uppercase in columns, do not differ by the Tukey test at 5% probability.
During the flowering stage and near irrigation reduction time, we could note significant differences, at 5% probability by the Tukey’s test, for leaf water potential among all strategies (Table 3). On the other hand, at the fruiting stage, water potentials were similar among all different strategies, which is justified because of an irrigation level return at 100% ETc. Differences among
the strategies T1, T2, T3 and T5 are observed at the flowering, with increasing values in this order, lower values of water potential associated with greater reductions in the levels and similarity between T3 and T4, and T4 and T5. The water potential was lower for the no irrigation strategy (T1) when compared to the strategy (T5) with full irrigation.
Predawn water potential measures presuppose a balance between soil water and plant water, with the plant being at its maximum hydration state for the soil water conditions considered (COTRIM, 2009). Leaf water potential is highly variable depending on soil humidity, being an indicative factor of the water level stored in soil. Wind speed, vapor pressure deficit, solar radiation, temperature and relative humidity may contribute to changes in plant water potential. These factors acting alone or jointly with soil water deficit could intensify plant water stress, causing stomatal closure, and thus influencing the potential values (KOBAYASHI et al., 2008). However, it is noteworthy mention that mango is taken as water deficit tolerant, since it has a high leaf water potential under deficit conditions. In contrast with that, our results showed a lower leaf water potential at soil stress conditions; therefore, we can conclude that water stress altered mango physiology at the time of flowering. Such outcomes corroborate the findings of FONSECA et al., who suggested that water stress has potential for flowering induction and can replace stress caused by the application of PBZ in mangoes in tropical semi-arid conditions.
In a study by COTRIM (2009) with mangoes, the author found differences in irrigation management with controlled deficit by assessing plant water potential. Other than that, studies with mangoes have shown that a minimum potential value can be an indicator of optimum irrigation management when there is restriction in crop water supply (LIMA FILHO, 2004). NALDLER et al. (2006), in researches with mangoes subjected to induced water stress, reported that measurements of plant water potential play an important role as water stress indicators. These authors studied water potential variation throughout the day, and pointed that a recovery of the plant water status occur during the night.
There was no interaction (p < 0.05) among the different irrigation reduction levels based on ETc, as well as between the production cycles evaluated for 'Tommy Atkins' mango production
characteristics. Only the cycles (p < 0.05) influenced productive characteristics, regardless of the irrigation strategies used for floral induction (Table 4).
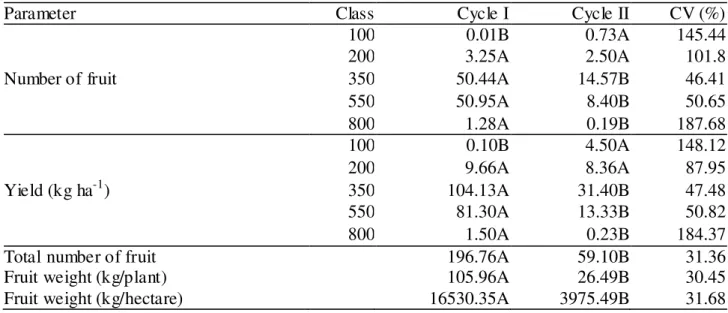
TABLE 4. Number of fruit and yield (kg ha-1) per fruit weight class and productive characteristics of 'Tommy Atkins' mangoes in two crop cycles. Guanambi - BA, Brazil, 2012-2013.
Parameter Class Cycle I Cycle II CV (%)
Number of fruit
100 0.01B 0.73A 145.44
200 3.25A 2.50A 101.8
350 50.44A 14.57B 46.41
550 50.95A 8.40B 50.65
800 1.28A 0.19B 187.68
Yield (kg ha-1)
100 0.10B 4.50A 148.12
200 9.66A 8.36A 87.95
350 104.13A 31.40B 47.48
550 81.30A 13.33B 50.82
800 1.50A 0.23B 184.37
Total number of fruit 196.76A 59.10B 31.36
Fruit weight (kg/plant) 105.96A 26.49B 30.45
Fruit weight (kg/hectare) 16530.35A 3975.49B 31.68
Means followed by the same capital letters in columns do not differ by the Tukey’s test at 5% probability.
The long period between the treatments until the time of floral induction and harvest, since in phase II (fruiting) the water depth was 100% of ETc, contributed to explain the effect absence of irrigation reductions on yield characteristics.
the respective classes. On the other hand, for weight class 100, the highest value occurred in cycle II, showing the increased presence of smaller fruit in this production cycle.
In cycle I, full irrigation occurred for 107 days, whereas in cycle II for 130 days. As a result of plant stress conditions, fruit growth phases I, II and III were delayed for cycle II. The lower fruit growth in the second cycle might have occurred due to several consecutive years of stressing conditions. In the years 2010, 2011 and 2012, local rainfall remained below the historical average (680 mm), being of 602.62, 621.60 and 562.90 mm, respectively. Yet during the experiment, rainfalls were on average 170.5 and 157.8 mm for cycle I and cycle II, respectively. Such water shortage might have favored an environmental stress worsened by high temperatures and low wind speed. Despite being irrigated, cultivations under semi-arid conditions show stress in most months by a high vapor pressure deficit, resulting from low relative humidity, high temperatures, high wind speed and solar radiation, particularly after a period of three consecutive years with rainfall below average.
Similarly, 'Tommy Atkins' mango yields of the weight classes 350, 550 and 800 differed at 5% probability by the Tukey’s test, expressing higher values in the first evaluation cycle. Meanwhile, yield was higher in the second evaluation cycle for the weight class 100 (Table 4). The coefficients of variation can explain this high variability, which may be associated with an intensive use of paclobutrazol in the previous years. This floral inducer might have favored an imbalance between vegetative and reproductive activities of plants, going into an intense stress state that impaired the performance of such activities.
Table 4 demonstrates differences for number of fruit and average weight per plant as well as per unit area between both production cycles (p < 0.05). Higher values were recorded for all the analyzed characteristics in cycle I. This variation in yield possibly occurred due to a physiological standstill in the second cycle; when there was no vegetative flushing, which assuredly interfered with crop yields.
The lack of effect of irrigation reductions over production characteristics in addition to the reasons discussed is possibly a result of cultivation stresses, added to climatic stresses experienced by the orchard in the previous production years. Until 2008, the Irrigated Perimeter of Ceraíma had most of the crop irrigation systems by surface, furrow, raising the water table to levels which supplied the crop water demand (COTRIM, 2009). Furthermore, the intensive use of PBZ might not have caused residual effect on plants, once variations in the water table could have moved this product throughout the soil profile.
Likewise, COTRIM et al. (2011) did not observe differences among water depths applied and respective yields in this same area, in the periods 2006 and 2007. These authors also highlighted the influence of the water table rise action. Moreover, the authors found an average yield of 26.82 t ha-1 and 31.71 t ha-1 for the two crop cycles, respectively. SANTOS (2012), also studying the same mango orchard in 2010 and 2011, did not identify any water table action; however, they reported average yields of 15.35 t ha-1 and 17.43 t ha-1 respectively, being lower than the findings of COTRIM et al. (2011) and higher than those found in the second evaluation cycle of our study (3.97 t ha-1). For the first evaluation cycle, although there is no influence of irrigation reduction levels, the yield of 16.53 t ha-1 was similar to that found by SANTOS (2012) in the same production area.
CONCLUSIONS
1. Irrigation level reduction for flower induction leads to lower values of photosynthesis, transpiration and leaf water potential for 'Tommy Atkins' mangoes in the flowering stage.
2. Productive characteristics were not affected by irrigation reduction for flower induction of 'Tommy Atkins' mangoes, particularly during the evaluated cycles.
3. An irrigation level reduction at 0% or 25% ETc in the flowering stage and 100% ETc in the
REFERENCES
ALLEN, R.G.; PEREIRA, L.S.; RAES, D.; SMITH, M. Crop evapotranspiration: guidelines for computing crop water requirements. Rome: FAO, 1998. 300 p. (Irrigation and Drainage Paper, 56). ANUÁRIO BRASILEIRO DA FRUTICULTURA. Santa Cruz do Sul: Gazeta Santa Cruz, 2013. 136 p. BASSOI, L.H. Oportunidade para irrigação com déficit no semiárido. In: WORKSHOP
INTERNACIONAL DE INOVAÇÕES TECNOLÓGICAS NA IRRIGAÇÃO, 4, 2012, Fortaleza. Anais...2012. Ilha Solteira: Departamento de Fitossanidade, Engenharia Rural e Solos, UNESP, 2012. BASSOI, L.H.; GONÇALVES, S.O.; SANTOS, A.R.L.; SILVA, J.A.; LIMA, A.C.M. Influência de manejos de irrigação sobre aspectos de ecofisiologia e de produção da videira cv. Syrah/Paulsen 1103. Irriga, Botucatu, v. 16, n. 4, p. 395-402, 2011.
COTRIM, C.E. Otimização da irrigação localizada em pomares de manga no semi-árido
baiano. 2009. 164 f. Tese (Doutorado em Engenharia Agrícola) – Universidade Federal de
Viçosa, Viçosa, 2009.
COTRIM, C.E.; COELHO FILHO, M.A.; COELHO, E.F.; RAMOS, M.M.; CECON, P.R. Regulated
deficit irrigation and ‘Tommy Atkins’ mango orchard productivity under microsprinkling in Brazilian
semiarid. Engenharia Agrícola, Jaboticabal, v. 31, n. 6, p. 1052-1053, 2011.
FONSECA, N.; CASTRO NETO, M.T.; LEDO, C.A.S. Paclobutrazol e estresse hídrico no
florescimento e produção da mangueira (Mangifera indica L.) 'Tommy Atkins'. Revista Brasileira de
Fruticultura, Jaboticabal, n. 1, v. 27, p. 21-24, 2005.
GHRAB, M.; AYADI, M.; GARGOURI, K.; CHARTZOULAKIS, K.; GHARSALLAOUI, M.; BENTAHER. H.; PSARRAS, G.; MIMOUN, M. B.; MASMOUDI, M. M.; MECHLIA, N. B. Long-term effects of partial root-zone drying (PRD) on yield, oil composition and quality of olive tree (cv.
Chemlali) irrigated with saline water in arid land. Journal of Food Composition and Analysis,
London, v. 36, p. 90-97,2014.
IBGE - INSTITUTO BRASILEIRO DE GEOGRAFIA E ESTATÍSTICA. Disponível em:
<http://www.ibge.gov.br/estadosat/temas.php?sigla=ba&tema =lavourapermanente> Acesso em: 4 mar. 2014.
KOBAYASHI, E.S.; SAKAI, E.; SILVA, E.A.; ARRUDA, F.B.; SILVEIRA, J.M.C.; SOUZA, P.S.; PIRES, R.C.M. Variação sazonal do potencial da água nas folhas de cafeeiro em Mococa, SP. Bragantia, Campinas, v. 67, n. 2, p. 421-428, 2008.
LEITE, K. N.; MARTÍNEZ-ROMERO, A.; TARJUELO, J. M.; DOMÍNGUEZ, A. Distribution of limited irrigation water based on optimized regulated deficit irrigation and typical metheorological year concepts. Agricultural Water Management, Amsterdamv. 148, p. 164-176, 2015.
LEITE, A.A.M.; ALVES, P.L. A modernização da agricultura no semiárido brasileiro: o caso da fruticultura irrigada do vale do São Francisco. In: ENCONTRO NACIONAL DE ENGENHARIA DE PRODUÇÃO, 30, 2010, São Carlos. Anais...
LIMA, R. S. M.; FIGUEIREDOA, F. A. M. M. A.; MARTINSA, A. O.; DEUSA, B. C. S.; FERRAZA, T. M.; GOMESA, M. M. A.; SOUSAB, E. F.; GLENNC, D. M.; CAMPOSTRINI, E. Partial rootzone
drying (PRD) and regulated deficit irrigation (RDI) effects on stomatal conductance, growth,
photosynthetic capacity, and water-use efficiency of papaya. Scientia Horticulturae, Amsterdam, v.
183, p. 13-22, 2015.
LIMA FILHO, J.M.P. Methodology for water potential measurement on mango using the pressure chamber. Acta Horticutural, The Hague, n. 645, p. 459-461, 2004.
MACHADO, D.F.S.P.; MACHADO, E.C.; MACHADO, R.S.; RIBEIRO, R.V. Efeito da baixa
temperatura noturna e do porta-enxerto na variação diurna das trocas gasosas e na atividade fotoquímica
MEDINA, C.L.; MACHADO, E.C.; RENA, A.B.; SIQUEIRA, D.L. Fisiologia dos citros. In:
MATTOS JÚNIOR, D.; DE NEGRI, J.D.; PIO, R.M.; POMPEU JÚNIOR, J. (Ed.). Citros. Campinas: IAC, 2005. p. 147-195.
NADLER, A.; RAVEH, E.; YERMIYAHU, U.; GREEN, S. Stress induced water content variations in mango stem by time domain reflectometry. Soil Science Society of America, Madison, v. 70, p. 510-520, 2006.
NUÑEZ-ELISEA, R.; DAVENPORT, T.L.; CALDEIRA, M.L. Control of bud morphogenesis in
mango (Mangifera indica L.) by girdling defoliation and temperature modification. Journal of
Horticultural Science, Ashford, v. 71, n. 1, p. 25-40, 1996.
OLIVEIRA, E. C.; CARVALHO, J. A.; SILVA, W. G.; REZENDE, F. C.; ALMEIDA, W. F. Effects of water deficit in two phenological stages on production of Japanese cucumber cultived in greenhouse. Engenharia Agrícola, Jaboticabal, v.31, n.4, p.676-686, 2011.
REIS, J.B.R.S.; JESUS, A.M.; DIAS, M.S.C.; CASTRICINI, A.; DIAS, J.R. Efeito de lâminas de irrigação e doses de pbz na pós-colheita da mangueira cv. Haden no norte de Minas Gerais. Revista Brasileira de Agricultura Irrigada, Fortaleza, v. 5, n. 3, p. 214-224, 2011.
ROMERO-CONDE, A.; KUSAKABE, A.; MELGAR, J. C. Physiological responses of citrus to partial
rootzone drying irrigation. Scientia Horticulturae, Wageningen Amsterdam, v. 169, p.234-238, 2014.
SAMPAIO, A.H.R.; COELHO FILHO, M. A ; COELHO, E. F.; DANIEL, R. Indicadores fisiológicos da lima ácida tahiti submetida à irrigação deficitária com secamento parcial de raiz. Irriga, Botucatu, v. 19, p. 292, 2014.
SAMPAIO, H. R.; COELHO FILHO, M. A.; COELHO, E. F.; DANIEL, R.; MACHADO, V. V.; CARVALHO, G. C.; SANTANA JUNIOR, E. B. Déficit hídrico e secamento parcial do sistema radicular em pomar de lima ácida. Pesquisa Agropecuária Brasileira, Brasília, v. 45, n. 10, p. 1141-1148, 2010.
SANTOS, M.R. Irrigação com déficit controlado na cultura da mangueira (Mangifera indica L.)
no semiárido baiano. 2012. 92 f. Tese (Doutorado em Engenharia Agrícola) – Universidade Federal de
Viçosa, Viçosa, 2012.
SANTOS, M.R.; MARTINEZ, M.A. Soil water distribution and extraction by ‘Tommy Atkins’ mango
(Mangifera indica L.) trees under different irrigation regimes. Idesia, Arica, v. 31, n. 3, p. 7-16, 2013.
SANTOS, M.R.; MARTINEZ, M.A.; DONATO, S.L.R. Gas exchanges of ‘Tommy Atkins’ mango
trees under different irrigation treatments. Bioscience Journal, Uberlândia, v. 29, p. 1141-1153, 2013.
SANTOS, M.R.; MARTINEZ, M.A.; DONATO, S.L.R.; COELHO, E.F. Fruit yield and root system
distribution of 'Tommy Atkins' mango under different irrigation regimes. Revista Brasileira de
Engenharia Agrícola e Ambiental, Campina Grande, v. 18, p. 362-369, 2014a.
SANTOS, M. R.; MARTINEZ, M. A.; DONATO, S. L. R.; COELHO, E. F. Tommy Atkins mango yield and photosynthesis under hydric deficit in semiarid region of Bahia. Revista Brasileira de Engenharia Agrícola e Ambiental, Campina Grande, v. 18, p. 899-907, 2014b.
SPREER, W.; ONGPRASERT, S.; HEGELE, M.; WUNSCHE, J.N.; MULLER, J. Yield and fruit
development in mango (Mangifera indica L. cv. Chok Anan) under different irrigation regimes.
Agricultural Water Management, Amsterdam, v. 96, p. 574-584, 2009.