Universidade de Aveiro 2018
Departamento de Ambiente e Ordenamento
Catarina Lima Correia Utilização de geopolímeros para controlo de pH em
processos anaeróbios de valorização de resíduos
orgânicos
Application of geopolymers as pH buffering materials
in anaerobic processes treating organic waste
Universidade de Aveiro 2018
Departamento de Ambiente e Ordenamento
Catarina Lima Correia Utilização de geopolímeros para controlo de pH em
processos anaeróbios de valorização de resíduos
orgânicos
Application of geopolymers as pH buffering materials
in anaerobic processes treating organic waste
Dissertação apresentada à Universidade de Aveiro para cumprimento dos requisitos necessários à obtenção do grau de Mestre em Engenharia do Ambiente, realizada sob a orientação científica da Doutora Maria Isabel Aparício Paulo Fernandes Capela, Professora Associada do Departamento de Ambiente e Ordenamento da Universidade de Aveiro e da Doutora Maria Paula da Silva Seabra, Investigadora do Instituto de Materiais de Aveiro (CICECO) da Universidade de Aveiro.
o júri
presidente Prof.a Doutora Ana Isabel Couto Neto da Silva Miranda
Professora Catedrática do Departamento de Ambiente e Ordenamento da Universidade de Aveiro
Prof.a Doutora Margarida Maria João de Quina
Professora Auxiliar do Departamento de Engenharia Química da Universidade de Coimbra (Arguente)
Prof.a Doutora Maria Isabel Aparício Paulo Fernandes Capela
Professora Associada do Departamento de Ambiente e Ordenamento da Universidade de Aveiro (Orientadora)
agradecimentos Gostaria de agradecer às minhas orientadoras, Professora Isabel Capela e Doutora Paula Seabra, pelo acompanhamento e disponibilidade ao longo deste ano.
À Tânia pela ajuda no laboratório, esclarecimento de dúvidas e principalmente por todo o apoio.
A todos os amigos que fiz que durante estes 6 anos e que à sua maneira me marcaram. Especialmente às maiores tones que alguma vez conheci, Luce, Tina, Ana Isabel, Alda e Andreia, que têm o talento de tornar um dia normal numa verdadeira aventura.
Finalmente, um agradecimento especial aos meus pais pela paciência, compreensão e por todos os sacrifícios que permitiram que conseguisse terminar este curso.
palavras-chave Tratamento de águas residuais industriais, digestão anaeróbia, metano, geopolímeros, pH, soro de leite.
resumo Num processo anaeróbio, o pH é um dos parâmetros que mais influencia o funcionamento dos sistemas, afetando tanto as reações bioquímicas como a atividade microbiológica, devido à sensibilidade dos microorganismos a variações de pH. Assim, é essencial o controlo do pH para que haja estabilidade de todo o processo anaeróbio, especificamente quando se tratam substratos facilmente biodegradáveis.
Este trabalho teve como principal objetivo estudar a utilização, a longo prazo, de geopolímeros para o controlo de pH em processos anaeróbios para produção de metano, tratando substratos facilmente acidificáveis. Foram usados reatores descontínuos anaeróbios com 1 L de volume de trabalho e soro de leite como substrato, e efetuados dois estudos. No primeiro estudo, e de modo a selecionar a concentração e tipo de geopolímeros que permitiam a maior produção de metano, utilizaram-se três reatores com adição de geopolímeros com diferente porosidade e em diferentes concentrações e um reator com adição de alcalinidade química (referência). O segundo estudo, com o objetivo de avaliar o comportamento e a reprodutibilidade da ação dos geopolímeros a longo prazo, foi dividido em quatro fases, com adições sucessivas de substrato. Para tal utilizou-se um reator como referência e dois reatores com as condições selecionadas no primeiro estudo do trabalho (tipo e concentração de geopolímeros).
No primeiro estudo observou-se que o reator em que se adicionou o tipo de geopolímeros mais poroso na concentração de 16 g/L foi o que produziu maior volume de metano.
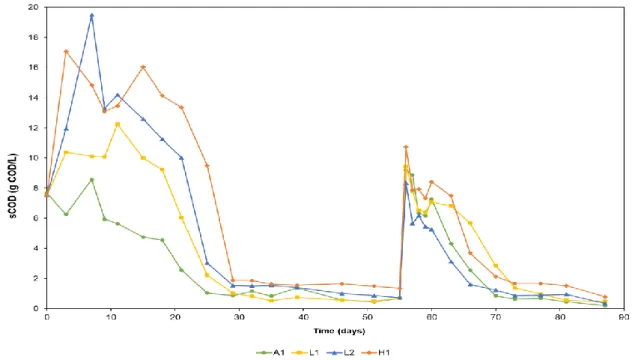
Em ambos os estudos, e de um modo geral, os reatores apresentaram um comportamento semelhante em termos de evolução de pH e CQO, observando-se um aumento nos valores de CQO no período inicial (fase 1) nos reatores com adição de geopolímeros, o qual se deve à lixiviação dos seus componentes orgânicos. Após as várias adições sucessivas de substrato, a diminuição mais rápida dos valores de CQO demonstrou a capacidade de remoção de matéria orgânica e de recuperação do sistema. O rápido consumo dos ácidos orgânicos voláteis sugeriu uma boa adaptação da cultura microbiana para a produção de metano.
Os resultados obtidos confirmam que é possível controlar o pH para produção de metano em processos anaeróbios, utilizando geopolímeros à base de cinzas volantes. Assim, este trabalho pode trazer novas perspetivas para os atuais problemas relacionados quer com o controlo de pH em processos de digestão anaeróbia, quer com a deposição de cinzas volantes em aterro e aos respectivos problemas ambientais associados a este tipo de resíduos.
keywords Industrial wastewater treatment, anaerobic digestion, methane, fly-ash based geopolymers, pH, cheese whey.
abstract In an anaerobic process, pH is one of the parameters which greatly influence the performance of these systems, affecting both chemical reactions and microbial activity, due to the microorganisms sensitivity to pH variations. Hence, it is essential pH control to the entire anaerobic process stability, especially when dealing with easily biodegradable substrates.
The present work had as main objective the study of the long-term utilization of geopolymers for pH control in anaerobic processes for methane production, treating easily acidifiable substrates. It was used anaerobic batch reactors with 1 L of working volume and cheese whey as substrate, and performed two studies. In the first study, in order to select the concentration and type of geopolymers that promote a higher methane volume production, it were used three reactors with the addition of geopolymers with different porosity and concentrations and one reactor with the addition of chemical alkalinity (reference). The second study, in order to evaluate the long-term geopolymers performance and reproducibility, it was divided in four phases, with successive additions of substrate. So, it was used one reactor as reference and two reactors with the selected conditions in the first study (type and concentration of the geopolymers).
In the first study, it was observed that the reactor with the addition of 16 g/L of geopolymers with higher porosity produced the highest methane volume.
In both studies, and in general, the reactors presented a similar pH and COD performance, with an increase in COD values in the start-up period (phase 1) in the reactors with addition of geopolymers, due to the lixiviation of organic compounds from the spheres. After the various successive substrate additions, the fastest decrease in the COD values showed the capacity of organic matter removal and recovery of the system. The rapid VFA consume suggested a good adaptation of the microbial culture methane production.
The results herein obtained confirm that the fly-ash containing geopolymers allow the control of pH for methane production in anaerobic processes. In light of this, this work could bring new insights to the current problems either related with pH control in AD process, or landfill disposal of fly ash and the associated environmental problems of this type of residues.
i
Contents
Chapter 1. Contextualization ... 1
Chapter 2. State of art ... 3
2.1. Introduction ... 3 2.2. Anaerobic Digestion ... 4 2.2.1. Hydrolysis ... 6 2.2.2. Acidogenesis ... 7 2.2.3. Acetogenesis ... 7 2.2.4. Methanogenesis ... 8
2.3. Anaerobic Digestion Process Parameters ... 8
2.3.1. Volatile Fatty Acids ... 9
2.3.2. Temperature ... 11
2.3.3. Carbon to Nitrogen Ratio ... 13
2.3.4. Ammonia ... 14
2.3.5. Organic Loading Rate... 16
2.3.6. Retention Time ... 17
2.3.7. pH... 18
2.4. Geopolymers ... 20
Chapter 3. Materials and Methods ... 23
3.1. Experimental Set-up ... 23
3.1.1. Operation Mode ... 24
3.2. Inoculum and Substrate Characterization ... 26
3.3. Geopolymers Preparation ... 27
3.4. Analytical Procedures and Calculations ... 28
3.4.1. pH and Alkalinity ... 28
3.4.2. Total and Volatile Suspended Solids ... 28
ii
3.4.4. Volatile Fatty Acids ... 29
3.4.5. Total Organic Carbon ... 30
3.4.6. Biogas ... 31
Chapter 4. Results and Discussion ... 33
4.1. Optimization of the concentration and type of geopolymers ... 33
4.1.1. pH Evolution... 33
4.1.2. Soluble Chemical Oxygen Demand Evolution ... 35
4.1.3. Total Organic Carbon Evolution ... 36
4.1.4. Methane and Biogas Production ... 37
4.1.5. Volatile Fatty Acids Production ... 40
4.1.6. Total and Volatile Suspended Solids ... 42
4.1.7. Geopolymers Mass Loss ... 43
4.2. Long term geopolymers performance ... 45
4.2.1. pH Evolution... 45
4.2.2. Soluble Chemical Oxygen Demand Evolution ... 46
4.2.3. Methane and Biogas Production ... 48
4.2.4. Volatile Fatty Acids Production ... 50
4.2.5. Total and Volatile Suspended Solids ... 53
4.2.7. Geopolymers Mass Loss ... 54
Chapter 5. Conclusions ... 55
Chapter 6. Future Perspectives ... 59
References ... 61 Appendices ... a
iii
List of Figures
Figure 1: Schematic representation of the anaerobic digestion process, adapted from
(Almeida Streitwieser, 2017; Zhang et al., 2014)... 6
Figure 2: Representation of the experimental set-up. ... 23
Figure 3: Representation of the conditions applied in the first study... 25
Figure 4: Representation of the conditions applied in the second study. ... 25
Figure 5: Geopolymer spheres used in the experimental work. ... 27
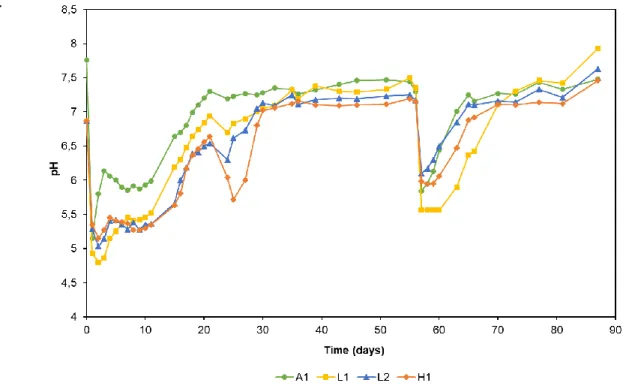
Figure 6: pH variation as a function of time in anaerobic reactors with the addition of chemical alkalinity and different concentrations and types of geopolymers. ... 33
Figure 7: sCOD evolution in anaerobic digesters as a function of time, with addition of chemical alkalinity and different concentrations and types of geopolymers. ... 35
Figure 8: TOC and COD concentrations during time in anaerobic digesters. ... 37
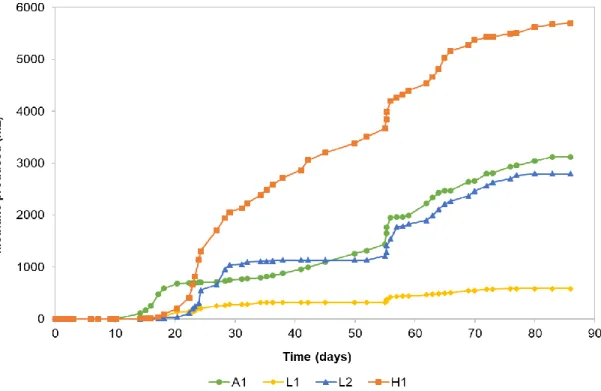
Figure 9: Cumulative methane produced in anaerobic reactors, with the addition of chemical alkalinity and different concentrations and types of geopolymers. ... 38
Figure 10: VFA composition during time in anaerobic digesters for the distinct systems, in the first study. ... 41
Figure 11: pH, VFA, sCOD and methane evolution during time in anaerobic digesters for the distinct systems, in the first study. ... 41
Figure 12: Total suspended solids concentration obtained in anaerobic reactors during the first study. ... 43
Figure 13: Volatile suspended solids concentration obtained in anaerobic reactors during the first study. ... 43
Figure 14: pH evolution in the different phases during the second study as function of time, with addition of chemical alkalinity and geopolymers spheres with higher porosity. 45 Figure 15: sCOD evolution in the different phases during the second study, as a function of time, with addition of chemical alkalinity and geopolymers spheres with higher porosity. ... 47
Figure 16: Cumulative methane produced in the different phases during the second study, with addition of chemical alkalinity (A2) and geopolymers spheres with higher porosity (H2 and H3). ... 48
Figure 17: VFA composition during time in the different phases for the distinct systems, in the second study. ... 51
Figure 18: pH, VFA, sCOD and methane evolution during time in anaerobic reactor for the distinct systems, in the second study... 51
iv
Figure 19: Total suspended solids concentration obtained in the different phases during the second study. ... 53
Figure 20: Volatile suspended solids concentration obtained in the different phases during the second study. ... 54
Figure 21: Calibration curve of acetic acid. ... a
Figure 22: Calibration curve of propionic acid. ... a
Figure 23: Calibration curve of i-butyric acid. ... b
Figure 24: Calibration curve of n-butyric acid. ... b
Figure 25: Calibration curve of i-valeric acid. ... b
Figure 26: Calibration curve of n-valeric acid. ... c
v
List of Tables
Table 1: Conditions for anaerobic microorganisms growth, adapted from (P. Wang et al., 2017; Zhang et al., 2014). ... 12
Table 2: Effects of ammonia levels on anaerobic digestion process (Rajagopal et al., 2013). ... 15
Table 3: Optimum pH range to different types of microorganisms involved in anaerobic digestion process. ... 18
Table 4: Micro and macro nutrients added to the reactors, as described by (van Lier et al., 1997). ... 24
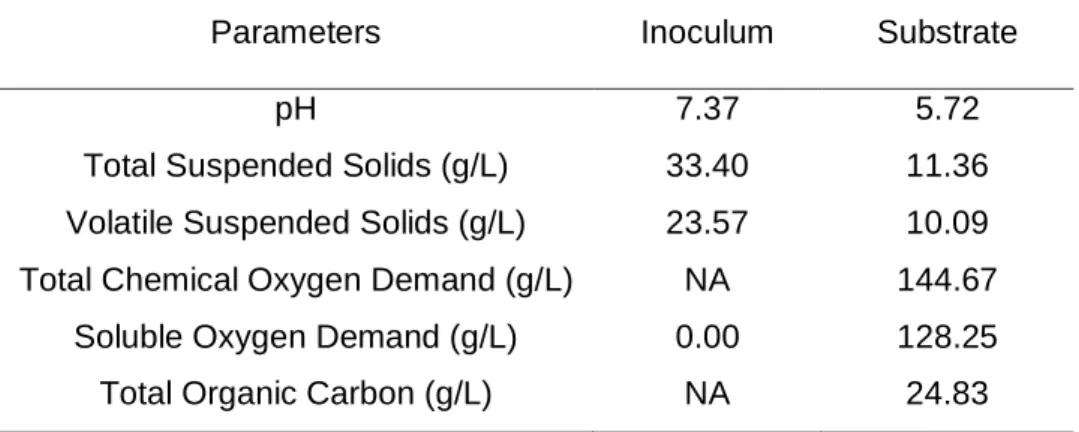
Table 5: Characterization of the inoculum and substrate used in the experimental work. 26
Table 6: Mixture composition utilized in geopolymers preparation. ... 27
Table 7: Values of oxidation stoichiometry for VFA in mg COD mg-1. ... 30
Table 8: Organic matter removal (%) in the two phases of the study. ... 36
Table 9: Accumulated volume of methane and biogas produced in the two phases of the study. ... 39
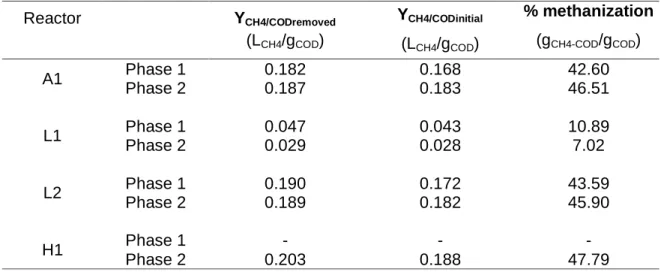
Table 10: Methane production yields and degrees of methanization for both phases of the study. ... 39
Table 11: Maximum degrees of acidification and VFA yields in the two phases of the first study. ... 42
Table 12: Difference in geopolymers mass between the start and the end of the first study. ... 44
Table 13: Organic matter removal (%) in the four phases of the study. ... 47
Table 14: Volume of methane and biogas produced in the four phases of the study. ... 49
Table 15: Methane production yields and degrees of methanization in the four phases of the study. ... 50
Table 16: Maximum degrees of acidification and VFA yields in the different phases of the second study. ... 52
vii
Abbreviations
AD Anaerobic Digestion C/N Carbon to Nitrogen GC Gas Chromatography
BOD Biochemical Oxygen Demand COD Chemical Oxygen Demand
sCOD Soluble Chemical Oxygen Demand tCOD Total Chemical Oxygen Demand DA Degree of Acidification
FA Fly Ash
FAN Free Ammonia Nitrogen GHG Greenhouse Gasses HRT Hydraulic Retention Time MK Metakaolin
OLR Organic Loading Rate PEG Polyethylene glycol RT Retention Time SRT Solids Retention Time TAN Total Ammonia Nitrogen TOC Total Organic Carbon TSS Total Suspended Solids VFA Volatile Fatty Acids
VSS Volatile Suspended Solids WWTP Wastewater Treatment Plant
1
Chapter 1. Contextualization
Anaerobic digestion (AD) is a process carried out by microorganisms that degrade organic materials under anaerobic conditions, with the formation of biogas, a mixture of methane (CH4) and carbon dioxide (CO2) (Chen et al., 2008). According to Appels and
colleagues, biogas is one of the most future dominant renewable energy resources, considering that it can provide a continuous power generation (Appels et al., 2011).
Currently, the global energy demand is growing rapidly, and about 88 % of this demand is insured by fossil fuels. Along with the rapid increase of the greenhouse gases (GHG) concentration in the atmosphere and energy security concerns, since most of the known conventional oil and gas reserves are concentrated in politically unstable regions (Weiland, 2010), there is a growing interest in alternative energy sources like biogas. Biogas can be used as replacement of fossil fuels in power and heat production, and it can also be used as gaseous vehicle fuel (Weiland, 2010). In addition, it can be an alternative to minimize pollution (Jha and Schmidt, 2017), considering that the industrialization processes generate large amount of effluents, with high organic content (Rajeshwari et al., 2000).
The efficiency of AD process is highly dependent on substrate characteristics, reactor configuration and various operational parameters (Montañés et al., 2014). Among the various process parameters with influence in AD, the most relevant are the concentration of volatile fatty acids (VFA), temperature, carbon to nitrogen ratio, ammonia concentration, organic loading rate, retention time and pH (Neshat et al., 2017).
The pH value is one parameter which greatly influence the digestion process (Hagos et al., 2017). It affects both chemical reactions and microbial activity (Montañés et al., 2014), due to the microorganisms sensitivity to pH variations (Braguglia et al., 2017). Hence, pH regulation is essential to the process stability and it can be accomplished by
2
manual or automatic methods. Currently, the most used method to control pH is the addition of chemical compounds, which may have some side effects that can lead to the process inhibition (Neshat et al., 2017). A recent approach is the use of porous biomass fly ash-containing geopolymers, which have the ability to promote pH control over time (Novais et al., 2016b). The production of this type of geopolymers contributes also to the material valorization of fly ash, thus decreasing the need of its disposal in landfill and associated environmental problems (Novais et al., 2018).
Along these lines, the dissertation main objective was the study of the long-term utilization of geopolymers for pH control in anaerobic reactors for methane production, treating easily biodegradable substrates. Therefore, the experimental work was divided in two studies: the first one was the optimization of the concentration and type of geopolymers to be used, and the second study aimed to evaluate the long-term geopolymers performance and reproducibility in anaerobic systems.
3
Chapter 2. State of art
2.1. Introduction
In the energy infrastructures of today the use of fossil fuels is considered the largest source of anthropogenic emissions of carbon dioxide, which is considered the main cause of global warming and climate change (Deepanraj et al., 2017). Thus, due to the finite nature of fossil fuels and their negative environmental effects, there has been a growing interest in alternative energy sources like the renewable ones (Kumanowska et al., 2017).
Examples of renewable energy resources are solar, wind, geothermal, hydropower and biofuels such as biogas, biodiesel, and bio-ethanol (Deepanraj et al., 2017). Biogas is mostly composed of carbon dioxide and methane, which is also one of the greenhouse gases but it could be captured and valued in renewable energy (André et al., 2017). This gas can be produced from a wide range of solid or liquid wastes through anaerobic digestion processes (Deepanraj et al., 2017) and is essentially used for thermal and electrical renewable energy production by combustion in combined heat and power plants (Gaida et al., 2017). Alternatively it can be upgraded to natural gas purity and be used in the production of electricity, heat and steam in household and industry, injected into the natural gas grid or used as a vehicular fuel (Ullah Khan et al., 2017).
Anaerobic digestion is a biological process in which a group of microorganisms biodegrade organic matter (substrate) in the absence of oxygen (O2) (Montañés et al.,
2014). This is not a newly emerged treatment and Alessandro Volta, who studied the relationship between organic loading and gas production, conducted the first study in 1776. The process has long been used as an energy providing method, especially in Asian countries such as China and India (Neshat et al., 2017).
The EU’s renewable energy directive sets that by 2020 20% of the final energy consumption is from renewable sources (Kumanowska et al., 2017). Therefore, anaerobic
4
digestion is an important method to achieve this objective. The number of anaerobic digestion systems had increased rapidly in the last years especially in Europe (Lora Grando et al., 2017). This is the result of financial incentives for renewable energy facilities, governmental policies on climate change and an increasing energy need (Fagbohungbe et al., 2017). According to Ullah Khan and co-workers, it is estimated that biogas usage in the world will be doubled in the next years, growing from 14.5 gigawatts (GW) in 2012 to 29.5 GW in 2022 (Ullah Khan et al., 2017).
2.2. Anaerobic Digestion
Anaerobic digestion is a biological process under anaerobic conditions (absence of oxygen) in which a microbial consortium breaks down complex biodegradable organic matter into different end products as methane (approximately 50-80%), carbon dioxide (approximately 30-50%) (Lora Grando et al., 2017) and traces of other gases such as hydrogen and nitrogen (Kamali et al., 2016).
By contrast with other bioenergy technologies, AD can be applied to a high diversity of substrate compositions, even those with high moisture content and impurities (Appels et al., 2011; Xu et al., 2017), as long as they contain carbohydrates, proteins, fats, cellulose, and hemicelluloses as main components (Weiland, 2010). Consequentially, different types of microorganisms are involved in the degradation process (Lin et al., 2017).
The nature of the organic residue can be diversified and grouped in different categories: sewage sludge, animal manures, food industry wastes, energy crops and harvesting residues, organic fraction of municipal solid waste (Romero-Guiza et al., 2016) and wastewater sludge (Yang et al., 2016). According to Lora Grando and co-workers, the distribution of potential sources of biogas at world level are 75% Ww in agricultural crops,
17% Ww in municipal and industrial organic waste and 8% Ww in sewage wastewater
treatment facilities (Lora Grando et al., 2017).
Wastewater plants involves the biological treatment of solid materials and transformation of dissolved and suspended organic matter to a large volume of sludge with high organic content and a host of pathogenic vectors (Yang et al., 2016). The sludge disposal is a potential source of soil and water pollution and, according to Neumann and colleagues, its management can represent more than 50% of the total cost of wastewater treatment (Neumann et al., 2016). Thus, wastewater sludge must be treated or stabilized
5 prior to environmental disposal and AD is the most widely used technology for the treatment (Yang et al., 2016).
Anaerobic digesters can be operated at different modes, namely continuous, semi-continuous or batch. In batch systems, a reactor is loaded with feed and will run until methane production stops. This type of reactors benefit from technical simplicity, low operating costs, and short digestion times (Braguglia et al., 2017). The anaerobic biological system can have one or two separated stages, where in one stage the microorganisms are kept together in a balance and with two stages there is a physical separation between the acidogenic and methanogenic phases (De Gioannis et al., 2017). Additionally, the reactors can be continuously stirred, using an intermittent stirring mode, or not be stirred at all. In an intermittent mode, the stirrer is turned on and off according to a preset time interval that can range from a few seconds of stirring per day to an almost continuous stirred mode (Lindmark et al., 2014).
In addition to methane production, AD has several advantages over other conventional techniques, such as the reduction of the produced sludge volume by 30– 70% comparing with aerobic processes, design simplicity, non-sophisticated equipment requirement, cost-effectiveness in terms of low capital and operating cost, applicability in different scales and a high rate of pathogen destruction (Kamali and Khodaparast, 2015). However, the process efficiency can be influenced by a high number of factors, such as environmental conditions (e.g., pH, C:N ratio and retention time), by-products (e.g., volatile fatty acids and ammonia), physical and chemical properties of the substrate (e.g., nutrient content) (Mao et al., 2017) and reactor configuration (Montañés et al., 2014). Hence, the main difficulties of the process are the operational instability, the quality of the digested product and the substrates that can generate metabolic intermediates that are inhibitory of the microbial activity (Fagbohungbe et al., 2017).
The anaerobic decomposition process of organic matter can be divided into four steps: hydrolysis, acidogenesis, acetogenesis and methanogenesis; in Figure 1 is presented a simplified scheme of the process. There are two main groups of microorganisms involved in the AD: Bacteria (acidogens and acetogens) and Archaea (methanogens). Bacteria decompose complex substrates into volatile fatty acids (VFA), CO2 and H2, while Archaea are responsible for methane production (Ren et al., 2017).
These two groups differ in terms of physiology, nutritional needs, growth rates, and sensitivity to environmental conditions (Fagbohungbe et al., 2017; Jha and Schmidt, 2017). The primary cause of reactor instability occurs when the balance between these
6
two groups is not maintained (Chen et al., 2008) and, consequently, microorganisms can be indicators of the AD process stability or failure (P. Wang et al., 2017).
2.2.1.
Hydrolysis
Hydrolysis is the first step of the AD process, where the complex organic matter (polymers) are decomposed into smaller units (mono and oligomers) (Matheri et al., 2017). During this phase, organic matter is broken into easily dissolved monomers, including the transformation from carbohydrates, protein and fat to sugar, amino acid and long-chain fatty acid, respectively (Ren et al., 2017), by the action of a diverse community of hydrolytic bacteria (Braguglia et al., 2017) and their extracellular enzymes; as displayed
Figure 1: Schematic representation of the anaerobic digestion process, adapted from (Almeida Streitwieser, 2017; Zhang et al., 2014).
7 in Figure 1. The decomposition of proteins generally takes place faster than the transformation of carbohydrates (Adekunle and Okolie, 2015).
The organic matter composition in the substrates has a strong impact on AD performances, which shows the existence of a relationship between the quantity of methane produced and the organic matter used, not only the biodegradable fraction but also the non-biodegradable fraction (Nielfa et al., 2015). However, the non-biodegradable compounds are resistant to biological degradation (Bouallagui et al., 2005).
Hydrolysis is considered the rate limiting step for complex, hard biodegradable organic substrates, due to the formation of toxic by-products or non-desirable volatile fatty acids (Ren et al., 2017) and can be accelerated by pre-treating the substrate before digestion (Braguglia et al., 2017).
2.2.2.
Acidogenesis
The second step of the AD process is acidogenesis, where sugars and other monomeric organic products obtained from hydrolysis are converted into volatile fatty acids, predominantly acetic, propionic, formic, butyric and lactic (Matheri et al., 2017), alcohols, hydrogen and carbon dioxide (Jha and Schmidt, 2017). VFA are monocarboxylic aliphatic acids, produced from a series of complex biochemistry reactions by the action of acidogenic and acetogenic bacteria (Fang et al., 2017; Lee et al., 2017).
The by-products obtained differ with the types of bacteria present as well as the environmental conditions (Braguglia et al., 2017). Carbon dioxide, hydrogen and acetic acid skip the third stage, and are converted directly by the methanogenic bacteria in the final stage to produce biogas, composed mainly by methane and carbon dioxide (Matheri et al., 2017).
This is the fastest phase in the AD process, therefore if the feedstock does not have suitable buffering capacity and/or the organic loading rate is too high, occurs a rapid accumulation of VFA. This accumulation may result in pH drop that will inhibit the methane production in the last step (Braguglia et al., 2017). Hence, this inhibition results in lower biogas output and even failure of the system (D. Wang et al., 2017).
2.2.3.
Acetogenesis
As represented in Figure 1, in the third phase of the anaerobic digestion process, the volatile fatty acids produced in acidogenesis, are converted into acetic acid, hydrogen
8
(Jha and Schmidt, 2017; Ren et al., 2017) and carbon dioxide (Zhang et al., 2014). The hydrogen and carbon dioxide are reduced to acetic acid by homoacetogenic microorganisms (Braguglia et al., 2017). The by-products are used in the last step of the process by methanogens for methane production (Jha and Schmidt, 2017; Zhang et al., 2014).
The acetogenic bacteria can only survive at a very low hydrogen concentration, so if occurs an excessive production of hydrogen from the acidogenesis step, these bacteria can be inhibited (Braguglia et al., 2017).
2.2.4.
Methanogenesis
The increased attention towards anaerobic digestion is due to the generation of energy (Jha and Schmidt, 2017), which happens in the last phase of the biological process, called methanogenesis. The methanogens are able to convert the products of acetogenesis (Jha and Schmidt, 2017) in to methane under strict anaerobic conditions (Braguglia et al., 2017).
Methanogens are divided into two main groups based on their substrate conversion capabilities: acetoclastic methanogens and hydrogenotrophic methanogens (Akindele and Sartaj, 2017; Montañés et al., 2014). Acetoclastic methanogens convert acetate into methane and carbon dioxide and are responsible for a fraction of about 0.7 of the methane produced. The hydrogenotrophic methanogens consume hydrogen and carbon dioxide to produce methane and are responsible for maintaining the partial pressure of H2
at a very low level (<10 Pa), which is a needed condition for the process stability (Akindele and Sartaj, 2017; Montañés et al., 2014).
This is considered the limiting step in the production of biogas since methanogens grow slowly, resulting in a relatively small population (Montañés et al., 2014). According to Almeida Streitwieser, under mesophilic conditions (temperatures between 30ºC and 40ºC (P. Wang et al., 2017)), the methanogenesis is the slowest step and the acetoclastic methanogens are the main producers of methane (Almeida Streitwieser, 2017).
2.3. Anaerobic Digestion Process Parameters
The anaerobic digestion process occurs through the interactions of many biotic (microbial community) and abiotic (reactor parameters) factors. The understanding of
9 process performance and microbial community during AD is necessary to determine the optimum operating conditions (Watanabe et al., 2017). The bioreactor parameters with main influence on the process performance and stability are the concentration of VFA, temperature, carbon to nitrogen ratio, ammonia concentration, organic loading rate, retention time and pH (Neshat et al., 2017).
Considering the process instability at achieving optimum biogas production (Jin et al., 2016), precise control of these parameters is crucial, as any deviation from their optimum levels can cease the whole process (Neshat et al., 2017).
2.3.1.
Volatile Fatty Acids
VFA are short-chain fatty acids that contain from 2 to 5 carbon atoms (Jankowska et al., 2017). A high number of soluble organic acids are included in VFA, although the major components are acetic, propionic, butyric, and valeric acids (Khan et al., 2016). Among this four acids, acetic and propionic play a dominant role in biogas production (Zhang et al., 2014). Acetic acid is usually present in higher concentrations than other fatty acids. However propionic and butyric acids have a higher inhibitory effect to methanogens (Weiland, 2010) and propionic acid degradation rate is the lowest among VFA (Neshat et al., 2017). According to Montañés and co-workers, acetic acid is the least toxic fatty acid, whereas an increase in propionic acid concentration is associated with a system failure (Montañés et al., 2014).
Besides being intermediate compounds and indicators of the process state, VFA are also essential buffering agents in the AD system (Shi et al., 2017). As potentially renewable carbon sources, they have a wide range of applications, such as biological removal of nitrogen and phosphorous (Jankowska et al., 2017; Ma et al., 2016), production of biopolymers (Jankowska et al., 2017), production of biodiesel, generation of electricity through microbial fuel cells and synthesis of complex polymers (M. Zhou et al., 2017). In addition to applications of mixed VFA, individual components showed a higher application potential, for example, butyric acid can be used as a building block for pharmaceuticals. Presently, VFA and their derivatives are widely used in food, textile, pharmaceutical, leather and plastics industries (M. Zhou et al., 2017).
Currently, volatile fatty acids are mostly obtained during chemical routes from non-renewable petrochemicals; however due to intensive exploitation of oil resources and wide range of application, the VFA production from biological routes has gained more
10
importance (Jankowska et al., 2017). The anaerobic digestion process has been primarily applied to produce methane containing biogas. However, according to Khan and co-workers, it can also be designed to produce volatile fatty acids and biohydrogen, separately or simultaneously with biogas production (Khan et al., 2016). Hydrogen is known as an ideal, clean and renewable energy, due to only water is generated after its oxidative combustion (M. Zhou et al., 2017) and the energy density per mass is 2,5 times compared to fossil fuels (Khan et al., 2016).
Comparing with methane, the added value of volatile fatty acids is higher and their storage and transportation is easier and safer (M. Zhou et al., 2017). According to Jankowska and co-workers, the acetic acid has the highest market size, next to propionic acid, and the smallest market is for butyric and caproic acids. On the other hand, caproic and butyric acid have the highest market prices, followed by lactic acid and propionic acid; the lowest price is for acetic acid (Jankowska et al., 2017).
The operational stability of AD process is highly dependent on the accumulation of VFA (García-Sandoval et al., 2016), the products of acidogenesis and acetogenesis (M. Zhou et al., 2017). As prior mentioned, when methanogens cannot utilize hydrogen and VFA as quickly as they are produced by acidogens and acetogens, it occurs an accumulation of VFA (Shi et al., 2017). This accumulation could cause an acidification of the system (Cavinato et al., 2017), which will leads to a pH drop to a level below 6 (Neshat et al., 2017) resulting in the reduction in biogas yields, and even in the failure of the digester (Montañés et al., 2014).
According to Neshat and co-workers, in a stable anaerobic digester, the concentration of VFA is about 50–250 mg/L, while a concentration of about 1500–2000 mg/L can possibly inhibit the methane formation (Neshat et al., 2017). Hence, VFA have been widely used as sensitive and reliable indicators to control and optimize the process, considering that they reflect metabolic imbalance when operating parameters suddenly change or inhibition occur (Jin et al., 2016). The best strategy for stopping the acidification of the system due to the increase of VFA concentration is to cease the feeding to the system and let the acetoclastic microorganisms grow and increase the pH level by consuming the VFA (Neshat et al., 2017).
The amount of organic content being hydrolyzed is the primary factor that is directly responsible for the quantity of VFA produced (Khan et al., 2016). The most common way to produce these intermediate products is throughout the degradation of protein and polysaccharide, since they are the dominant macromolecular organic matters (Zhang et al., 2017). To increase the production of VFA, some strategies can be used, such as
11 improving hydrolysis rate to produce more soluble substrates for further fermentation, promoting acidogenesis and removing the inhibiting factors (M. Zhou et al., 2017).
There are several methods for monitoring the VFA content in a liquid sample, such as titration method, gas chromatography (GC), high performance liquid chromatography and mid-infrared spectroscopy. However, as described by Jin and co-workers, these methods are time consuming, inaccurate, expensive and typically tested manually (Jin et al., 2017). According to Lee and co-workers, CG analysis has a simple procedure, small sample requirement, and relatively low detection limit (Lee et al., 2017).
2.3.2.
Temperature
Temperature, one of the most essential parameters in AD process (Nielsen et al., 2017), has a direct influence on the thermodynamic equilibrium of the biochemical reactions of the process and also controls the activities, growth rate and diversity of the microorganisms (Khan et al., 2016). Considering that the growth of microorganisms and the activity of the enzymes is only effective at certain temperatures, this parameter has an important influence on the hydrogen partial pressure of the system, and hence the metabolic pathway of the bacteria could be affected (Liu and Lv, 2016). Temperature not only influences the activity of enzymes and co-enzymes, but also the methane production and digestate (effluent) quality (Zhang et al., 2014).
The metabolic activity of microorganisms is only possible in certain temperature ranges and, in addition, a maximum activity is obtained within this interval for pure species. However, AD is carried out by a complex mixed population that have specific temperature ranges (Fernández-Rodríguez et al., 2013). In hydrolysis and acidogenesis phases, temperature variations can affect hydrolytic bacteria, which are responsible for the degradation of complex materials. Also, acidogenic bacteria cannot tolerate high temperature changes and are active in a specific temperature range; deviation from optimum temperature can cause acidification due to the accumulation of VFA (Neshat et al., 2017). In addition, acetogenesis and methanogenesis can only be performed by certain specialized microorganisms (acetogenic and methanogenic), which are very sensitive towards temperature change (Rajeshwari et al., 2000). Any temperature fluctuation can seriously affect the whole process (Neshat et al., 2017). As an example, methanogenic bacteria cannot tolerate temperature fluctuations over 1°C/day (Neshat et al., 2017).
12
Methane is formed over a wide range of temperatures, from low to high temperatures, though not over 65 °C. The different temperature ranges for methane formation can be defined by the microbial activity (Matheri et al., 2017), and are presented in Table 1.
Table 1: Conditions for anaerobic microorganisms growth, adapted from (P. Wang et al., 2017; Zhang et al., 2014).
An increase in process temperature causes a higher microbiological activity and metabolism, hence, the substrate consumption rate is higher (Fernández-Rodríguez et al., 2013; Liu and Lv, 2016), which will result in an increment in AD performance (Zhang et al., 2014). Accordingly, under thermophilic conditions, AD has a shortened retention time (Watanabe et al., 2017) and higher metabolic and specific growth rates (Zhang et al., 2014).
With higher temperatures, the reaction and gas yields are faster (Matheri et al., 2017), therefore thermophilic conditions have higher biogas production (Zhang et al., 2014). It is important to keep a constant temperature during the digestion process, as temperature changes or fluctuations will affect the biogas production negatively (Weiland, 2010). Nonetheless, according with Neshat and co-workers, higher temperatures generate higher biogas production, but not higher methane yields.Considering that biogas mainly consists of methane and carbon dioxide, higher biogas production with lower methane content means increased amount of CO2. This corresponds to lower heating value of the produced
biogas and the need for further purification processes (Neshat et al., 2017).
Thermophilic process has some disadvantages comparing with mesophilic conditions. The process is less stable (Matheri et al., 2017; Watanabe et al., 2017), more sensitive to environmental changes (Mao et al., 2015; Zhang et al., 2014), needs more energy to maintain the constant temperature of the reactor, is harder to control (Hagos et al., 2017), needs larger investments (Mao et al., 2015) and has a higher risk of ammonia (Wang et al., 2014; Weiland, 2010) and volatile fatty acids inhibition (Neshat et al., 2017; P. Wang et al., 2017).
Mesophilic AD is more widely used, compared with thermophilic digestion (Kamali and Khodaparast, 2015). The main advantages are suitable operating performance, stability, less sensitivity to inhibitors (Neshat et al., 2017), less energy requirements
Conditions Temperatures (ºC)
Psychrophilic 10 - 30 Mesophilic 30 - 40 Thermophilic 50 - 60
13 (Kamali and Khodaparast, 2015) and higher richness in bacteria (Mao et al., 2015). A very diverse microbial population is expected under mesophilic temperatures, which could be beneficial to degrade various types of substrates (Kim et al., 2017). The mesophilic bacteria cannot survive in the thermophilic range of temperature, whereas thermophilic bacteria can survive in mesophilic range of temperature, but their growth rate is slower (Hagos et al., 2017).
2.3.3.
Carbon to Nitrogen Ratio
The carbon to nitrogen ratio is an important indicator for controlling biological treatment systems (Wang et al., 2012). In anaerobic digestion processes, it represents the relationship between the amount of carbon and nitrogen in the organic materials (Matheri et al., 2017), furthermore is one of the main parameters that critically affects the whole process (Hagos et al., 2017; Piatek et al., 2016). An optimum C/N ratio is needed to keep a favorable nutrient balance for anaerobic bacteria’s growth, as well as for maintain a stable environment (Piatek et al., 2016; Zhang et al., 2014).
An appropriate balance between carbon and nitrogen is required for effective digestion, and the ideal C/N ratio for anaerobic digestion depends on the feedstock and inoculum, (Zhang et al., 2014). Most studies considered an optimum C/N ratio in the range of 20/1 to 30/1 (Matheri et al., 2017; Shi et al., 2017), with a ratio of 25/1 being the most commonly used (Yan et al., 2015). The optimum C/N ratio is responsible for the regulation of nutrient balance to the methanogens within the reactor (Hassan et al., 2017), accordingly deviations from the optimum value affects the biogas production (Neshat et al., 2017).
When the C/N ratio value is higher than the optimum range, it induces a low protein solubilization rate and leads to low total ammonia nitrogen and free ammonia concentrations within a system (Mao et al., 2015), then resulting in higher nitrogen consume rate by the methanogens (Hassan et al., 2017; Matheri et al., 2017). The lack of nitrogen leads the process to lower methane production yield and could even cause the failure of the entire process (Neshat et al., 2017). According to Miqueleto and co-workers, with the increase of the C/N ratio, the daily growth of the microorganisms’ population decreased. This suggests that the deficiency of an essential nutrient such as nitrogen can limit cellular growth (Miqueleto et al., 2010).
In the other hand, lower C/N ratios limit the microbial growth due to carbon shortage (Neshat et al., 2017), which also leads to ammonia accumulation (Wang et al., 2012). This
14
may result in higher total ammonia nitrogen release and high VFA accumulation in the digester, which are inhibitor factors for AD performance (Kamali and Khodaparast, 2015; Yan et al., 2015).
In a study conducted by Piatek and colleagues, tests with lower C/N ratios led to ammonia accumulation and increased the pH values, which were toxic conditions to methanogenic archaea. On the other hand, under high C/N ratios, the nitrogen was consumed rapidly by methanogens and the pH value was lower than the optimum demand to anaerobic digestion systems (Piatek et al., 2016). According to Wang and co-workers, C/N ratio may also interact with temperature and that interaction will result in different concentrations of ammonia, as well as inhibitory effects. Hence, when temperature increased, an increase was required in the feed C/N ratio, in order to reduce the risk of ammonia inhibition (Wang et al., 2014). Thus, it can be concluded that an adjustment of the carbon to nitrogen ratio is needed for a stable anaerobic digestion in a long-term operation (Zhang et al., 2014).
2.3.4.
Ammonia
Ammonia is formed during the biodegradation process of protein or other nitrogen-rich organic substrates (Zhang et al., 2014). It is an essential nutrient for the growth of microorganisms involved in anaerobic digestion yet, as previously described, it can also be toxic when present at high concentrations (Jha and Schmidt, 2017; Zhang et al., 2014). The excess of ammonia leads to an increase of pH, a lowering of biogas production, the occurrence of inhibitory effects, and eventually, it may led to process failure (Shi et al., 2017; Zhang et al., 2014).
Ammonia exists in two forms, as ionized ammonia or ammonium (NH4+) and as
unionized ammonia or free ammonia nitrogen (NH3) (FAN). The combination of these two
forms of ammonia is expressed as total ammonia nitrogen (TAN) (Akindele and Sartaj, 2017; Rajagopal et al., 2013). FAN has been suggested to be the main cause of inhibition of methanogenic microflora since it is freely membrane-permeable (Chen et al., 2008; Rajagopal et al., 2013).
Free ammonia concentration primarily depends on TAN, pH and temperature. In addition, ionic strength can also be considered as a significant parameter, especially for concentrated solutions (Rajagopal et al., 2013). Ammonia toxicity increases with increasing temperature, and washout of microbial population can occur (Weiland, 2010). At thermophilic temperatures, the FAN concentration is expected to be six times higher than under mesophilic conditions at the same pH (Rajagopal et al., 2013). The indicated
15 conditions will led to severe inhibition, accumulation of VFA (being acetate the main type (Shi et al., 2017)), and eventual process failure (Yirong et al., 2017). Consequently, working under mesophilic conditions was proposed as a solution to prevent the ammonia inhibition in the digestion process (Neshat et al., 2017).
Among the different types of anaerobic microorganisms, the methanogens are the least tolerant and the most likely to cease growth due to ammonia inhibition (Chen et al., 2008). These microorganisms can be affected in two ways: ammonium ion may inhibit the methane producing enzymes directly or hydrophobic ammonia molecule may diffuse passively into bacterial cells, causing proton imbalance or potassium deficiency.A fraction of NH3 that enters into the cells causes a pH change due to its conversion into
ammonium, while absorbing protons in the process (Rajagopal et al., 2013).
Nonetheless, ammonia has also advantages for the digestion process, as it can enhance the buffer capacity of the AD (Zhang et al., 2014), acting as a pH neutralizer against VFA accumulation and maintaining the pH at optimum levels and being a valuable nitrogen source for methanogenic archaea (Neshat et al., 2017). As formerly explained, different ammonia concentrations cause different effects on the process, and Table 2
summarizes the concentrations at which ammonia is beneficial, inhibitory or toxic to AD.
Table 2: Effects of ammonia levels on anaerobic digestion process (Rajagopal et al., 2013).
Ammonia Concentration (mg NH4-N/L) Effect on AD process 50 - 200 Beneficial 200 - 1000 No antagonistic effect
1500 - 3000 Inhibition (especially at higher pH values)
> 3000 Complete inhibition or toxic at any pH
As it can be observed in Table 2, between 50 and 200 mg NH4-N/L ammonia has
beneficial effects, while at higher concentrations (from 1500 mg NH4-N/L) it occurs the
inhibition of methanogenesis. At high pH values, the unionized form prevails and this form is more inhibitory than the ammonium ion. In consequence, an increase in pH results in increased toxicity (Rajagopal et al., 2013).
16
2.3.5.
Organic Loading Rate
The organic loading rate (OLR) is a critical operational parameter which represents the biological treatment capacity of the anaerobic digestion system (Sun et al., 2017), in other words, represents the amount of organic material that is fed to a digester (El Achkar et al., 2017). OLR is expressed as chemical oxygen demand or volatile solids fed to the system daily per m3 of the digester volume (Matheri et al., 2017) and depends on the technology and type of wastes fed to the digester (Dhar et al., 2016).
This is an important factor for viability of the microorganisms and their optimum activity (Neshat et al., 2017). According to Sun and co-workers, microbial analysis revealed that the increase on the OLR influenced significantly the structure and behavior of microbial consortia (Sun et al., 2017). As an example, loading a high amount of organic material into the system at once can lead to a shock, resulting on higher activity of acidogenic bacteria when compared to methanogens. Thus, as the organic loading increases, the risk of inhibition due to excessive VFA production also increases (Neshat et al., 2017; Nghiem et al., 2017).
The biogas production is significantly affected by this parameter (Sun et al., 2017). With increasing OLR, the biogas yield increases to an extent, but the equilibrium and productivity of the digestion process can also be disturbed (Mao et al., 2015). Thus, an appropriate increase in OLR favored the biogas production, while excess OLR increase restrained it and may cause system failure (Sun et al., 2017). If the feeding capacity of the system is exceed by the OLR, the gas production decreases due to accumulation of fatty acids in the digester sludge (Matheri et al., 2017).
As previously described, a high organic load enables the microorganism’s growth and high biogas production, but it also puts pressure on the microorganisms and can lead to process collapse due to acid accumulation, during the acidogenesis stage (El Achkar et al., 2017). Thus, digesters are usually operated at low organic loading rate (P. Wang et al., 2017). The main advantage of higher loading rates is the lower cost and size of the digester (Jain et al., 2015).
A mesophilic digester can be loaded with concentrated organic substrates when the digester is operated at sufficiently long retention times. On the other hand, thermophilic digesters have higher conversion rates and allow shorter retention times than mesophilic digesters. Though, thermophilic digesters can behave more sensitively with ammonia, becoming more toxic at lower concentrations (Aramrueang et al., 2016).
17
2.3.6.
Retention Time
Retention time (RT) is the time required for the complete degradation of the organic matter, and differs with process parameters such as type of feedstock and temperature (Jain et al., 2015; Matheri et al., 2017). This parameter is directly proportional to the degradation rate, the shorter the RT, the lower the degradation rate (Matheri et al., 2017).
Retention time includes hydraulic retention time (HRT) and solids retention time (SRT). SRT is defined as the average residence time of microorganisms in the reactor (Aramrueang et al., 2016) and HRT is the average time an input organic matter stays inside the digester before it comes out (El Achkar et al., 2017), defined by Equation 1,
Equation 1
where V is the reactor volume and Q the influent flow rate (Mao et al., 2015; Ziganshin et al., 2016).
SRT determines the time available for substrate degradation and microbial growth (Vanwonterghem et al., 2015). A low SRT does not allow enough time for the methanogens to consume VFA and produce CH4 and CO2, because the growth rate of
methanogens is slower when compared with acidogens. Hence, a SRT shorter than the optimum value can cause VFA accumulation, washout of the methanogens (Khan et al., 2016) and significant shifts in the microbial population, as bacteria and archaea present became less diverse (Manser et al., 2015). On the opposite, acidogens require a minimum SRT to perform the hydrolysis of the substrates (Khan et al., 2016).
A long SRT provides sufficient time for the methanogens, enables more biogas production (Khan et al., 2016), allows a decrease in toxicity and maintain digester stability through microbial adaptation and acclimation (Aramrueang et al., 2016). However, longer SRT may also increase the capital and operational cost (Chen et al., 2018).
According to El Achkar and colleagues, hydraulic retention time is one of the most important parameters affecting significantly microbial ecology (El Achkar et al., 2017). The microorganisms need a specific time to consume the substrate and synthetize the products, so if the process could not be maintained at its optimum HRT, unfavorable metabolic activity of microorganisms and undesirable products will result (Neshat et al., 2017).
18
Low values of HRT affects the microbial community composition (Ziganshin et al., 2016), can result in accumulation of VFA and has a potential risk of biomass washout from the system, leading in the end to a low methane yield (Khan et al., 2016; Neshat et al., 2017). Differently, long HRT values can lead to the death of microorganism due to the shortage of nutrients (Neshat et al., 2017) and need large digester sizes (Mao et al., 2015).
2.3.7.
pH
Between all the parameters with influence on anaerobic digestion process, pH is one of the most important. The pH value is a measurement of acid or basic concentration in aqueous substances (Matheri et al., 2017) and affects the chemical reactions and the activity of the microbial consortia (Montañés et al., 2014). The microorganisms are sensitive to pH variations and each anaerobic phase shows a different pH sensitivity (Braguglia et al., 2017).
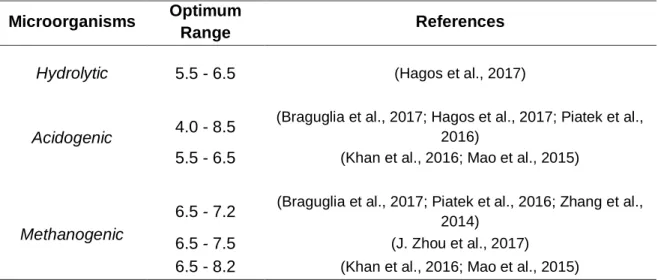
Due to the direct impacts on microbial activity and community stability, pH influences the organic biodegradation and biogas production (Mao et al., 2017). The growth of each type of microorganism happens only within a characteristic pH range and the maximum growth rate occurs at an optimum pH value (Montañés et al., 2014). In Table 3 are represented the optimal intervals of some bacteria involved in AD process, according to the literature.
Table 3: Optimum pH range to different types of microorganisms involved in anaerobic digestion process.
Microorganisms Optimum
Range References
Hydrolytic 5.5 - 6.5 (Hagos et al., 2017)
Acidogenic 4.0 - 8.5
(Braguglia et al., 2017; Hagos et al., 2017; Piatek et al., 2016)
5.5 - 6.5 (Khan et al., 2016; Mao et al., 2015)
Methanogenic
6.5 - 7.2 (Braguglia et al., 2017; Piatek et al., 2016; Zhang et al.,
2014)
6.5 - 7.5 (J. Zhou et al., 2017)
6.5 - 8.2 (Khan et al., 2016; Mao et al., 2015)
The optimum pH for anaerobic digestion process changes in the various stages. As can be observed in the Table 3, the optimum pH for methanogenic bacteria is higher than
19 the optimum pH for hydrolytic and acidogenic bacteria. It can also be noticed that there is a greater discrepancy in the literature values for acidogenic values comparatively with the methanogenic bacteria. According to Table 3, methane formation takes place within a relatively narrow pH interval, from about 6.5 to 8.2 and, according to Hagos and co-workers, 7.0 is the optimal value (Hagos et al., 2017). The pH increases due to ammonia accumulation, while the accumulation of VFA decreases the pH value and reduces the methane production (Neshat et al., 2017; Weiland, 2010). Accordingly, if the pH value is outside the optimum range the process is severely inhibited (J. Zhou et al., 2017).
The growth rate of acidogenic bacteria is much higher than that of the methanogenic microorganisms and, as it can be seen in Table 3, the acidogenic bacteria are active in lower pH values, whereas methanogenic archaea are not active (Kim et al., 2017). Thus, the pH of anaerobic digestion is typically maintained between methanogenic limits to prevent the predominance of the acid forming bacteria, which may cause VFA accumulation (Rajeshwari et al., 2000).
The different optimum pH value is one at the main reason to separate the process into two-phase digesters as acidogenic phase and methanogenesis phase (Hagos et al., 2017). Also, co-digestion, the simultaneous anaerobic digestion of a mixture of two or more substrates (Montañés Alonso et al., 2016), can facilitate stable pH by avoiding extreme acidification conditions.
As previously described, the microbial activity may alter the pH values during the AD process. For this reason pH regulation is essential and one of the appropriate ways to increase methane yield (Yang et al., 2015). However, the initial pH adjustment may be insufficient to analyze the relationship between biogas production and microbial communities (Zhou et al., 2016).
The pH can be maintained at a desired level manually or automatically. Examples of automatic methods can be programmable logic control (Latif et al., 2017) or the use of a alkali and acid pump (Strik et al., 2006). Manually, chemical products such as hydrochloric acid (HCl) or sodium hydroxide (NaOH), among others (Chen et al., 2012; Tomaszewski et al., 2017) can be added.However, the use of chemicals may have some side effects, for instance, the ionization of these chemicals and the production of certain ions, can inhibit the process. As an example, the presence of Na+ at high concentrations can inhibit AD and may decay the whole process (Neshat et al., 2017). A recent method of pH control is the use of geopolymers with high buffer capacity (Novais et al., 2016b).
20
2.4. Geopolymers
Geopolymers, also known as alkaline cements or inorganic polymers, are materials with a tri-dimensional aluminosilicate structure that result from the chemical interaction between a strongly alkaline solution and a source of aluminosilicates (Aguirre-Guerrero et al., 2017). Their microstructure consists of chains or networks of inorganic molecules linked by covalent bonds (Nikolov et al., 2017).These materials, that emerged as a result of attempts to model the geological formation of zeolites, have good mechanical and physical properties (Majidi, 2009) and have been attracting increased attention due to the low CO2 emissions associated with their production (Novais et al., 2016b).
A variety of aluminosilicate materials can be used as solid raw materials in the geopolymerization technology, such as, metakaolin, kaolinite, feldspar and industrial solid residues like fly ash, metallurgical slag or mining wastes (Singh et al., 2015). To develop stable geopolymers, the source materials should be highly amorphous, possess sufficient reactive glassy content, low water demand and be able to release aluminum easily (Singh et al., 2015). The geopolymers are considered as a green construction material since in its production it can be used, as main ingredients, solid wastes such as fly ash and industrial slags (Panda et al., 2018).
Depending on the raw material selection and processing conditions, geopolymers can exhibit a wide variety of properties and characteristics. Their main advantages are production technology, non-flammable and high temperature stability, safe for humans, highly resistant towards freezing/thawing cycles, high compressive strength and low shrinkage (Feng et al., 2015; Novais et al., 2016a).
Despite this wide variety of attributes, these properties are not necessarily inherent to all geopolymeric formulations (Duxson et al., 2007). The properties of geopolymers can be optimized by a proper selection of the raw materials, correct mix and processing design to suit an appropriate application (Singh et al., 2015). Among the wide range of applications, geopolymers can be used in the construction industry as an alternative to Portland cement (building materials, concrete, fire resistant coatings, fiber reinforced composites), waste immobilization solutions for the chemical, nuclear industries and bulk materials for military applications, automotive sector and marine applications (Palmero et al., 2015; Singh et al., 2015).
A type of geopolymers uses fly ash from porous biomass burning to energy production (Novais et al., 2016b). The main products of biomass combustion are H2O,
21 depending on the constitution of the fuel and the conditions of combustion (Nunes et al., 2017). The use of biomass as fuel generates large amounts of residual ash which can cause serious environmental problems. Fly ash particles are highly contaminating due to their enrichment in potentially toxic trace elements which condense from the flue gas, thus research on the potential applications of these wastes has environmental relevance and industrial interest (Ahmaruzzaman, 2010). Accordingly, the production of this type of geopolymers will contribute to the material valorization of fly ash, decreasing the need of its disposal in landfills and associated environmental problems (Novais et al., 2018).
Porous biomass fly ash containing geopolymers, when immersed in water, have the ability to control pH over time (Novais et al., 2016b), by leaching significant amounts of OH- from their structure (Novais et al., 2018). Hence, geopolymers can be used as pH regulators in applications where high buffer capacity is required, for instance wastewater treatment systems and in biogas reactors (Novais et al., 2016b).
The use of fly ash based geopolymers instead of commercial alkaline materials in AD process results in process simplicity, since no continuous pH adjustment is required. Besides, according to Novais and colleagues, the biogas production was also enhanced by geopolymers addition, which can be related with the release of suitable alkali metals that improve the process stability and performance (Novais et al., 2018).
23
Chapter 3. Materials and Methods
3.1. Experimental Set-up
A schematic representation of the experimental set-up used in the laboratory to study the long-term utilization of geopolymers for pH control in anaerobic reactors for methane production is shown in Figure 2.
The set-up was composed by an anaerobic glass reactor in a bath with controlled mesophilic temperature of 37 ºC, using a thermostat. The batch reactor had one sampling point to take samples with a syringe for analysis. From the reactor until the bubbler lies
1
2
3
5
4
6
7
8
5
9
1. Graduated cylinder 2. Separation funnel 3. Bubbler4. Sampling point of biogas 5. Clamp
6. Bath
7. Anaerobic reactor 8. Thermostat 9. Sampling syringe
24
the gas circuit, where samples were frequently taken to analyze the biogas composition by gas chromatography. After the bubbler lies the water displacement circuit, where the produced biogas volume was measured by water displacement method, using a graduated cylinder.
3.1.1.
Operation Mode
The experimental work was divided in two studies with different objectives, yet both experiments were carried out in batch mode using anaerobic reactors with 1 L of working volume. At the beginning of the experiment was added anaerobic sludge, cheese whey as carbon source, distilled water, 2 mL/L of macronutrients and 1 mL/L micronutrients to each reactor (Table 4). Macronutrients are indispensable constituents for biomass development and micronutrients are crucial cofactors in numerous enzymatic reactions involved in the biochemistry of methane formation (Romero-Guiza et al., 2016).
Table 4: Micro and macro nutrients added to the reactors, as described by (van Lier et al., 1997).
Element of interest Stock Solution Concentration (mg/L) Micronutrients NH4Cl N 86.802 KH2PO4 P 16.456 CaCl2.2H2O Ca 4.248 MgSO4.7H2O Mg 1.733 Macronutrients FeCl2.6H2O Fe 0.403 CoCl2.6H2O Co 0.483 MnCl2.4H2O Mn 0.135 CuCl2.2H2O Cu 0.011 ZnCl2 Zn 0.023 H3BO3 B 0.009 (NH4)6Mo7O24.4H2O Mo 0.048 Na2SeO3.5H2O Se 0.029 NiCl2.6H2O Ni 0.012 EDTA (C10H16N2O8) EDTA 0.976
The volume of anaerobic sludge and cheese whey added to each reactor was determined in order to obtain a concentration of 2 g/L VSS of biomass and 8 g/L COD of
25 substrate, based on previous anaerobic tests (Silva et al., 2013). In the reactors with addition of alkalinity a buffer solution of NaHCO3 and KHCO3 it was used to promote pH
autoregulation, to achieve 4 g/L of alkalinity measured as CaCO3. Before sealing, the
reactors were purged with nitrogen gas to remove any residual oxygen.
The objective of the first study was to evaluate the influence of the concentration and the type of geopolymers in AD process and it were operated four reactors for 87 days. A schematic representation of the study is displayed in Figure 3.
At one of the anaerobic reactors it was added 4 g/L of alkalinity concentration measured as CaCO3 (A1) whereas to the other three assays it was add two types of
geopolymer spheres, with the same composition but different porosity (type L- low porosity and type H- high porosity). Two assays use geopolymer spheres with the lowest porosity and two distinct concentrations (12 g/L (L1) and 16 g/L (L2))and the other assay uses 16 g/L of geopolymer spheres with the highest porosity (H1). After 56 days of operation most of the organic matter had already been removed, so cheese whey (substrate) was again added in order to evaluate the ability of the geopolymers to control pH after a long incubation time. Thus, the first study was composed by two phases, where the first phase began in day 0 and ended in day 55, and the second phase began with the substrate addition at the day 56 until the end of the study (day 87).
In the second study the objective was to evaluate the long-term geopolymers performance and reproducibility. So, accordingly with the first phase results, it was used one anaerobic reactor with 4 g/L of CaCO3 (A2) and two reactors with 16 g/L of
geopolymer spheres with the highest porosity (type H) (H2 and H3), as shown in Figure 4.
Figure 3: Representation of the conditions applied in the first study.