CSR and Perceived Price Fairness:
An analysis on Willingness to Pay and
Perceived Benefit
Eduardo Eusébio
Dissertation written under the supervision of Professor Sérgio Moreira
Dissertation submitted in partial fulfilment of requirements for the MSc in
Management, at the Universidade Católica Portuguesa, April 2020.
2
Abstract
CSR and Perceived Price Fairness: An analysis on Willingness to Pay and Perceived Benefit
Author: Eduardo Marques Eusébio
The objective of this study is to assess the potential effect that engagement in Corporate Social Responsibility (CSR) may have on consumers’ Perceived Price Fairness. Following the literature that already developed on this topic, the study approaches the knowledge gap in the field by, simultaneously, considering Willingness to Pay, here measured using the Price Sensitivity Meter by Van Westendorp (1976) and Perceived Benefit of active CSR engagement.
The study followed an experimental approach via an online survey, concerning three types of products and two social causes supported by CSR engagement. To gather insights, the study follows the Price Sensitivity Meter framework to measure different pricing options and strategies for products from firms who actively engage in CSR.
The results point put that to two of the three products under analysis make for increased Willingness to Pay. On all cases, respondents pointed out an increase in added perceived benefit when faced with CSR activities. On the two cases where a positive effect was registered, consumers’ Perceived Benefit increase outmeasured the growth in Willingness to Pay, making a case that CSR engagement indeed provides for an increase in Perceived Price Fairness. In one of the cases. Consumers recognized an increase on Perceived Benefit but their Willingness to Pay followed an opposite direction.
3
Abstrato
CSR and Perceived Price Fairness: An analysis on Willingness to Pay and Perceived Benefit
Autor: Eduardo Marques Eusébio
O presente estudo tem como objetivo identificar se o compromisso de empresas em ações de Responsabilidade Social Corporativa (RSC) tem efeito na Perceção de Justiça de Preço dos consumidores. Seguindo autores que já exploraram o tema, esta dissertação tenta colmatar uma falha no conhecimento no campo ao contemplar, em simultâneo, a Disponibilidade de Compra por parte dos consumidores e sua perceção de benefício adquirido através da implementação de políticas de RSC.
O estudo seguiu uma abordagem experimental através de um questionário online, considerando três tipos de produtos e duas causas sociais apoiadas pelas atividades de RSC. De forma a cogitar conclusões, o estudo segue o modelo do Medidor de Sensibilidade ao Preço de modo a medir diferentes opções e estratégias de preço em produtos oriundos de empresas que ativamente desenvolvam atividades de RSC.
Os resultados mostram que em dois dos três produtos analisados existe um aumento na Disponibilidade de Compra. Em todos os casos, registou-se um aumento na perceção de benefício adquirido por parte dos consumidores. Nos dois casos em que se verifica um efeito positivo por parte das atividades de RSC, o aumento do benefício adquirido suplantou o aumento da Disponibilidade de Compra, sendo um indicador de que as atividades de RSC potenciam, de facto, um aumento na Perceção de Justiça de Preço nos consumidores. Num dos casos, os consumidores identificaram um aumento na sua Perceção de Benefício mas a sua Disponibilidade de Compra seguiu um comportamento oposto.
Palavras-chave: responsabilidade social corporativa, justiça de preço, sensibilidade
4
Acknowledgments
Writing these last few words only makes me wonder what challenges lie next. More importantly, reflecting of how this chapter (literally and metaphorically) fills me with an immense sense of achievement. However, much like happiness, achievement is only real when shared. And what better way to share it than being grateful?
First and foremost, the feeling of gratitude goes to my family. Not only was this achievement made possible because of them and the opportunity they gave me, I am also thankful for their tremendous support throughout my life and how they shaped my (way of) being.
Secondly, gratitude extends to my friends, who not only gave me the precious help of filling and sharing the survey which turned out to be crucial for the study but also have shared their ideas and, most importantly, were there when needed.
Last, but certainly not the least, to my supervisor, who was always ready to help and provide with the necessary structure, knowledge and thought-provoking suggestions that made this dissertation a reality.
5
Table of Contents
Abstract... 2 Acknowledgments ... 4 Introduction ... 7 Literature Review ... 9The many faces of CSR ... 9
Why CSR matters ... 11
CSR engagement and consumer perceptions ... 12
Method ... 15
Study Design ... 15
Participant characterization ... 16
Industry and CSR engagement manipulation ... 16
Price-fairness assessment ... 22
Complementary assessments ... 24
Results ... 25
Overall Willingness to Pay and Price Sensitivity ... 25
Coffee ... 25
Toothbrush ... 27
Laptop ... 28
Scenario Manipulation... 30
6 Toothbrush ... 33 Laptop ... 36 Discussion... 40 Main Insights ... 40 Managerial Implications ... 41
Limitations and Future research ... 42
References ... 44
Supplementary Materials ... 48
7
Introduction
The objective for this dissertation is to determine if Corporate Social Responsibility (CSR) affects consumers’ perception of price fairness. Furthermore, the study analyses if this effect is moderated by the industry in which a firm operates and by the social cause it chooses to support.
At a time when social and economic transformation has taken a truly global scale by worldwide initiatives like the 2030 Global Agenda for Sustainable Development, more and more of our society’s stakeholders are accountable to be an active part of this movement. The present study tried to ascertain the effects that the private sector is expected to have on consumers’s purchasing behaviours. Specifically, the scope of the study had an underlying question: Does CSR engagement influence consumers’ perception of price fairness? To measure this, two main metrics were considered – Willingness to Pay and Perceived Benefit. The core idea is that, if the increase on Perceived Benefits outweighs the increase on Willingness to Pay, then we can conclude consumers have an overall increase on Perceived Price Fairness.
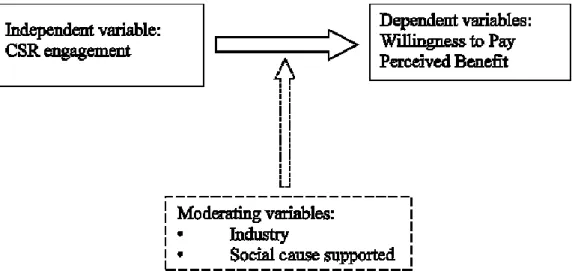
Following up on this question, the study also tried to establish if such an effect is moderated by the industry in which a firm operates as well as the social cause firms choose to support. The conceptual model that defined the relationship between the identified independent variable (CSR engagement), the dependent variables (Willingness to Pay and Perceived
8 Benefit) as well as the moderating variables (Industry, Social cause supported) is depicted below:
The study’s relevance lies on two main factors: lack of clarity to Managers and a identified knowledge gap in the field. Regarding this lack of clarity to Managers, the study starts from the current paradigm, where there is no clear path as to how Managers can amplify their strategical assets by engaging in CSR activities. This is a deeply entrenched problem since the sheer concept of CSR has not yet been defined in a concise and clear manner, which leaves managers with a very unclear “playbook” on how to develop their firms’ strategy around CSR, particularly when it comes to pricing strategy. On the other hand, and relative to one point that mostly belongs to the field’s academia, there has been no direct measurement on the two main variables which compose Perceived Price Fairness – Willingness to Pay and Perceived Benefit. As such, no clear patterns or relation between the two exist.
The study was intended to approach both these problems by providing with accessible measures that provide a compelling perspective on the overall relation between a firm’s CSR engagement and consumers’ Perceived Price Fairness.
9
Literature Review
The many faces of CSR
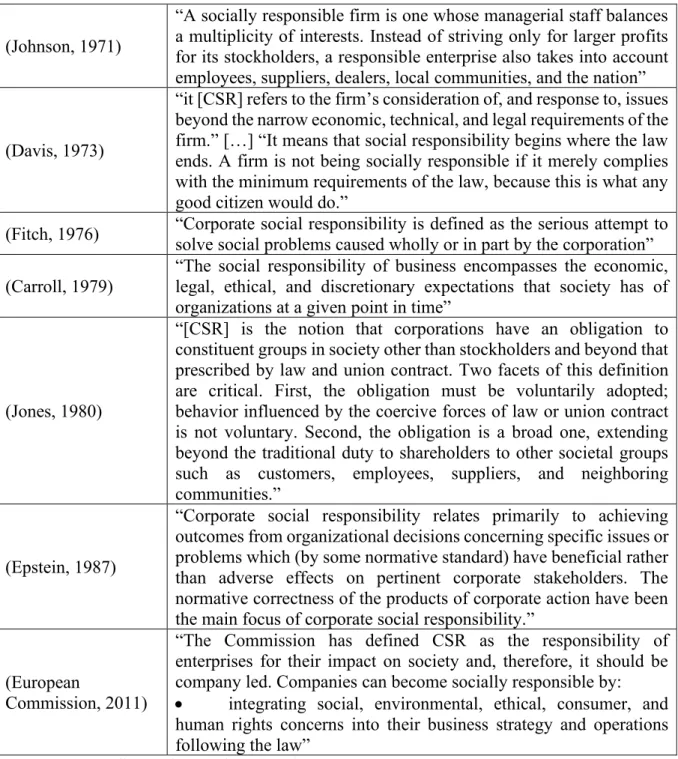
The conceptualization of Corporate Social Responsibility (CSR) has gone through a significant evolution since the first references to such a topic many decades ago (Carroll, 1999). As such, before we dive into the core of this study, a formal definition as to what CSR is must be set. Although the definition is not yet standardised, as there are several authors who have come to bring their own definition (Wartick & Cochran, 1985; Carroll, 1979; Waddock S. , 2004) for the sake of this study we follow the definition of CSR provided by Aguinis (2011) as the “context-specific organizational actions and policies that take into account stakeholders’ expectations and the triple bottom line of economic, social, and environmental performance” (p. 855). This definition is used since it provides a clear characterisation of the stakeholders at play. On one hand, management is responsible for defining and executing the CSR strategy. On the other hand, stakeholders are those who not only endure the consequences of said strategy, but their interests should be considered in the decision-making process. For a walkthrough of the evolution of the concept throughput time, the table below shows the definitions of CSR brought by the main authors in the field:
Author(s) Definition
(Bowen, 1953)
“It [CSR] refers to the obligations of businessmen to pursue those policies, to make those decisions, or to follow those lines of action which are desirable in terms of the objectives and values of our society”
(Davis, 1960) “businessmen’s decisions and actions taken for reasons at least partially beyond the firm’s direct economic or technical interest” (McGuire, 1963) “The idea of social responsibilities supposes that the corporation has not only economic and legal obligations but also certain
responsibilities to society which extend beyond these obligations”
(Walton, 1967)
“In short, the new concept of social responsibility recognizes the intimacy of the relationships between the corporation and society and realizes that such relationships must be kept in mind by top managers as the corporation and the related groups pursue their respective goals.”
10 (Johnson, 1971)
“A socially responsible firm is one whose managerial staff balances a multiplicity of interests. Instead of striving only for larger profits for its stockholders, a responsible enterprise also takes into account employees, suppliers, dealers, local communities, and the nation”
(Davis, 1973)
“it [CSR] refers to the firm’s consideration of, and response to, issues beyond the narrow economic, technical, and legal requirements of the firm.” […] “It means that social responsibility begins where the law ends. A firm is not being socially responsible if it merely complies with the minimum requirements of the law, because this is what any good citizen would do.”
(Fitch, 1976) “Corporate social responsibility is defined as the serious attempt to solve social problems caused wholly or in part by the corporation” (Carroll, 1979)
“The social responsibility of business encompasses the economic, legal, ethical, and discretionary expectations that society has of organizations at a given point in time”
(Jones, 1980)
“[CSR] is the notion that corporations have an obligation to constituent groups in society other than stockholders and beyond that prescribed by law and union contract. Two facets of this definition are critical. First, the obligation must be voluntarily adopted; behavior influenced by the coercive forces of law or union contract is not voluntary. Second, the obligation is a broad one, extending beyond the traditional duty to shareholders to other societal groups such as customers, employees, suppliers, and neighboring communities.”
(Epstein, 1987)
“Corporate social responsibility relates primarily to achieving outcomes from organizational decisions concerning specific issues or problems which (by some normative standard) have beneficial rather than adverse effects on pertinent corporate stakeholders. The normative correctness of the products of corporate action have been the main focus of corporate social responsibility.”
(European
Commission, 2011)
“The Commission has defined CSR as the responsibility of enterprises for their impact on society and, therefore, it should be company led. Companies can become socially responsible by: • integrating social, environmental, ethical, consumer, and human rights concerns into their business strategy and operations following the law”
Table 1 - Different definitions of CSR throughout time
More interesting than the evolution of the concept of CSR is the evolution of its perception of relevance as a strategic variable throughout time. A lot has changed since Friedman (1970) released a notorious article that contradicted any of the aforementioned definitions of CSR, stating that firms should only cater to the interests of their shareholders by increasing their profits and that social responsibility is an exclusive concern of individual
11 subjects. A different line of thought came to be, stating that firms rely on a much wider set of parties rather than just shareholders and as such, should be accountable to their interests, bringing CSR as a driver of a firm’s strategic direction (Freeman, 1984). This concern in satisfying a firm’s stakeholders is also reflected in a suggested need-hierarchy framework that conveys the different needs that organisations have when it comes to assessing their CSR initiatives (Tuzzolino & Armandi, 1981). This framework, an adaption of Maslow’s (1943) original hierarchy of needs depicts and categorizes the different needs that drive a firm to engage in CSR activities.
Why CSR matters
From an organisational perspective, there are several motives as to why firms have sought to engage in CSR activities throughout time (Aguinis & Glavas, 2012). These motives range, for instance, from the search of competitiveness (Bansall & Roth, 2000), the sense of responsibility and duty (Bansall & Roth, 2000) or following an organisational sense of moral (Aguilera, Rupp, Williams, & Ganapathi, 2007). From a financial perspective, the relationship between CSR engagement and financial performance has been shown to exist, (Waddock & Graves, 1997; Orlitzky, Schmidt, & Rynes, 2003; Barnett & Salomon, 2006). However, there is little detail as to how managers should optimise CSR-driven investments and how to measure their outcomes (Peloza, 2009).
This paradigm makes for a dubious setting in which there is indeed evidence describing benefits from a certain level of engagement in CSR activities (McWilliamns & Siegel, 2001) but there is no consensus as to how firms should prepare for and measure the consequences of these activities (Habel, Schons, Alavi, & Wieseke, 2016).
These findings reflect themselves on a firm’s internal scope, where managers typically try to optimise their strengths and diminish their weaknesses. This analysis is known as the
12 Resource Based Model (Barney, 1991). More important, however, for the scope of this research, is the external analysis, in which managers strive to take advantage of opportunities present in the market and act towards mitigating and/or containing market risks. The combination of these opportunities and risks define the Environmental Models of Competitive Advantage (Barney, 1991). This multi-level analysis allows for a theoretical framework on how to design a strategy-driven set of CSR initiatives that take advantage of a firm’s existing assets and how they can generate a strategic competitive advantage in its market.
CSR engagement and consumer perceptions
As previously mentioned, the focus of this study is mostly of an external perspective. Specifically, the aim is to dive further into the consumer’s perception of firms’ CSR engagement and the effect these activities have on perceived price fairness. Research has shown that firms are more likely to implement certifiable management standards to regulate their CSR engagement efforts when consumers place high importance on the issue (Christmann & Taylor, 2006). This means that customers indeed have an important pressuring role in the engagement of CSR activities by firms. Furthermore, we know that customers’ purchasing motivations are positively influenced when a firm supports social causes (Barone, Miyazaki, & Taylor, 2000; Lichtenstein, Drumwright, & Braig, 2004). This positive effect is even stronger when there is an association between the social cause a firm is choosing to support and the nature of its business on a widespread organisational level (Drumwright, 1996). Nonetheless, the strategy of actively communicating may actually have a negative effect on consumers’ perception of a firm’s behaviour when the firm’s communication is inconsistent with their CSR actions (Wagner, Lutz, & Weitz, 2009). From an organisational perspective, this means firms need to be aware of the core nature of its business and, should it decide to engage in CSR activities, these activities should be aligned to that core. Furthermore, CSR engagement from firms tends to have an even stronger effect when the character of consumers is congruent with the firm’s
13 character (Sen & Bhattacharya, 2001). As such, to optimise the positive effect CSR engagement on a consumer’s perception of the firm, a tripartite alignment must occur between a firm’s core business nature, its nature of CSR engagement and the character of the individual consumer.
Typically, to measure price fairness as a result of a firm’s engagement in CSR activities, research had previously measured the increase of perceived price fairness justified by the feeling of helping others, as this feeling of doing good adds to a customer’s benefits in their relationship with a firm (Andrews, Luo, Fang, & Aspara, 2014). However, this simplistic analysis considers only the added benefits a customer gathers from a purchase and lacks the cost variable. And the concept of price fairness requires this variable so customers can make a cost-benefit analysis when purchasing (Xia, Monroe, & Cox, 2004). As such, if the consumers’ perception is that firms charge higher prices on their products as a way to finance their CSR initiatives, then the perception of price fairness may, hypothetically, actually deteriorate, meaning that CSR engagement could potentially have a negative effect on consumer’s perceived price fairness (Habel, Schons, Alavi, & Wieseke, 2016).
To this effect, research has shown that CSR initiatives have a positive effect on consumers’ purchase intent and firm evaluation (Mohr & Webb, 2005). Moreover, the same study revealed that when CSR engagement supports environmental causes, the positive effect on consumers’ purchase intent and firm evaluation outweighed the negative impact caused by an increase in a product’s price. From these findings, we can infer that, although there is a generalised positive effect of a firm’s CSR engagement in consumers’ perceived price fairness, the scale of this effect is susceptible to the social cause a firm chooses to support. However, no study has yet provided a broad analysis on which social causes a firm chooses to support provide a stronger effect on perceived price fairness. This means these social causes firms choose to support impose a potential moderating effect on customer’s perceived price fairness. Carrol’s (1979) three-dimensional model can be useful to this matter as it provides standard categories
14 of social issues firms may support, which are naturally influenced by the industry in which they operate. However, the author asserts that the social causes supported have a dynamic nature, caused by the nature of a firm’s business and time.
To check for the alignment between a firm’s main business and the social cause it chooses to support, we follow Murphy and Enis’ framework for Product Classification (1986). The underlying assumption in this framework is that buyers seek benefits from their acquired products. To obtain such benefits, two variables are considered: effort and risk. Effort is defined as “the amount of money, time, and energy the buyer is willing to expend to acquire a given product” (p. 25). Risk, on the other hand, refers to the risk a product may not deliver the benefits sought by the buyer. As a result, four categories of products were derived:
i. Convenience Products, ranking the lowest on both effort and risk. This means consumers are not willing to spend much money nor time in purchasing these products and there is little risk associated with the purchase. These products are also referred to as commodities;
ii. Preference Products, where the effort is slightly higher but much higher in terms of risks. The significant increase in risk perception is typically associated with branding and advertising;
iii. Shopping Products, in which buyers are willing to spend a significant amount of time and effort in searching and evaluating these products. The increased level of risk is associated with high involvement with such products;
iv. Specialty Products, where buyers stop “searching” for a product but are only willing to accept one choice for their product. The main distinction between these products and Shopping Products falls on effort rather than risk. Consumers typically are only willing to buy from a specific brand.
15
Method
The main core of this research is to assess the potential effect that firms’ CSR engagement has on Consumers’ Perceived Price Fairness, by fragmenting this last concept in its two pillars: Willingness to Pay and Perceived Benefit. To provide a broader view, the study also tries to measure the mediating effects that the firm’s nature of business and the social it chooses to endorse by developing its CSR initiatives.
The targeted sample for the study had a significantly broad range since the study intends to measure the impact of CSR engagement by a firm – alongside the moderating effects previously defined on an equally broad range of consumers. Nonetheless, the study controlled for various socio-demographic measures to allow tests on whether any of these factors had an impact on perceived price fairness. The sample sought after for this study was as follows: Men and Women from 18 years old to 65 years old who had previously been involved in the decision-making process of acquiring a set of coffee capsules, a toothbrush and a premium laptop. This does not necessarily mean that participants of the study were required to actually have bought, i.e., paid for all those items but rather be involved in any of the purchasing process. An experimental study was held where participants underwent a pre-defined path that generated the data under analysis. This provides for a more controlled environment for each of the variables at play, which in turn allowed for an increased possibility to control for each of the variables’ effect on the dependent variable, perceived price fairness.
Study Design
The experimental study consisted in a survey which was distributed online to several participants within the defined sample. The survey was split into 4 main sections: participant characterization, industry and CSR engagement manipulation, price-fairness assessment, and complementary assessments.
16
Participant characterization
The first section was designed to describe the study’s participants. Questions included socio-demographic factors such as age, gender, nationality, education level, current professional status and financial dependency, i.e. if the participant was either financially independent or not. This last measure was taken into consideration as a way to account for possible discrepancies caused between the two groups.
Industry and CSR engagement manipulation
The second section of the survey is what allows for the core analysis on whether CSR engagement impacts the perceived price fairness. In this section, the survey had a 3 firm by 3 scenario design. This means that each participant saw three different firms, each with its own nature of business (refer to 2.1 below). Then, for each of the industries shown, respondents were then randomly assigned to one of three possible scenarios. In one of these scenarios, the firm depicted had not initiated any sort of CSR engagement activity nor was it interested in doing so for the future. This acted as a “control” for the other two scenarios, in which the firms had indeed engaged in different CSR activities.
To consider whether or not the type of product had an effect on the overall perceived price fairness, we assumed that the product sold by each firm acted as a proxy variable of the industry in which it operated. To classify the type of product this study follows the product classification framework provided by Murphy and Enis (1986). For the scope of this study, Specialty Products were not considered as their buying frequency tends to be rather low and there is typically a lower price sensitivity, meaning the perception of price fairness is less affected by the price of the product. Moreover, one typified item was considered as an example for each of the categories of products under analysis. This distribution goes as follows: for Convenience Products, the choice was encapsulated coffee; for Preference Products
17 toothbrushes were chosen and for Shopping Products laptops were the item of choice. For this section, no brands were named as each brand could potentially create an underlying bias that could influence the respondent’s perception of CSR and/or perceived price fairness. As such, the scenarios were solely based on the type of product sold by each of the firms depicted.
In order to control on whether the type of CSR engagement had an effect on perceived price fairness, respondents were randomly assigned to one scenario for each firm. It is important to reinstate that these three scenarios were randomly assigned. As such, there was no kind of dependencies between three scenarios at play and the firm shown to each respondent. It is equally important to point out that the description was as similar as possible for all the scenarios. Only the form of CSR engagement was in fact altered (refer to table 2 for the overall study design and the correspondent scenarios descriptions). That being said, the three scenarios were the following:
• No CSR engagement – In this scenario, the firm had never engaged in any CSR activity and doesn’t intend to do so in the foreseeable future. Its main concern is to increase profitability and it believes CSR has a negative influence on it.
• CSR engagement: fair labour – For this scenario, the firm has an active policy on how to provide better working conditions for its workers, specifically to raise their salaries to a level greater than the industry’s average salary.
• CSR engagement: environmentalism – The last scenario that respondents could have seen reflected actions intended to make the manufacturing process more sustainable, by using organic/recycled materials.
Both social causers shown were derived from Carrol’s (1979) three-dimensional model, specifically the axis referring to social causes supported by a firm. As previously mentioned, the model mentions social causes are susceptible to change over time and thusly, social issues
18 should not be seen as static. As such, many social issues could have been chosen for the sake of the study. However, to narrow to have a narrower scope, the two aforementioned social causes – Fair Labour and Environmentalism were identified.
19
Product CSR Engagement No CSR engagement CSR engagement - Fair labour CSR engagement - Environmentalism
Coffee
Imagine a company whose main product is encapsulated coffee. This firm operates in all the production and distribution process, from growing the coffee beans up until having them on sale on major retailers and their own channels, such as physical and online stores. Imagine this company has no major concerns with social and environmental issues related to its business. The main goal of this company is to maximise its profits and it believes that to do so, it should only engage in activities that directly bring added profits to its business. Any increase in price of the product is a result of improvements in the production and quality of the coffee.
Imagine a company whose main product is encapsulated coffee. This firm operates in all the production and distribution process, from growing the coffee beans up until having them on sale on major retailers and their own channels, such as physical and online stores. Imagine this company decides to get a fair labour certification, meaning, among other things, it must raise the salaries of its coffee farmers to a level greater than the national average in that industry. This certification means that the firm’s profits could significantly decrease as a result of this increase in salaries. To maintain profits while providing better salaries for its coffee farmers, the firm decides to raise prices on all its products. Consider that no other change in the product is made – the increase in price is exclusively to provide better salaries.
Imagine a company whose main product is encapsulated coffee. This firm operates in all the production and distribution process, from growing the coffee beans up until having them on sale on major retailers and their own channels, such as physical and online stores. Imagine this company is switching from disposable aluminium, a material known to be harmful for the environment, to capsules made from organic materials that are easily decomposable after their use. The production of these materials is also significantly less environmentally impacting than traditional aluminium capsules. However, the research necessary to create and manufacture these materials has been expensive and to maintain profits, the company decided to raise its prices to compensate for this investment. Consider that all other product characteristics remained the same as before - the increase in price is exclusively to produce capsules made from organic materials.
20 Toothbrush
Imagine a company whose main product is manufacturing toothbrushes. This firm operates in all of the production and distribution process, from designing the toothbrushes up until having them on sale on major retailers and their own channels, such as physical and online stores. Imagine this company has no major concerns with social and environmental issues related to its business. The main goal of this company is to maximise its profits and it believes that to do so, it should only engage in activities which directly bring added profits to their business. Any increase in price of the product is a result of improvements in the design and quality of the toothbrushes.
Imagine a company whose main product is manufacturing toothbrushes. This firm operates in all of the production and distribution process, from designing the toothbrushes up until having them on sale on major retailers and their own channels, such as physical and online stores. Imagine this company decides to get a fair labour certification, meaning, among other things, it must raise the salaries of its assembling line workers to a level greater than the national average on that industry. This certification means that the firm’s profits could significantly decrease as a result of this increase in salaries. To maintain profits while providing better salaries for its assembling line workers, the firm decides to raise prices on all its products. Consider that no other change in the product is made – the increase in price is exclusively to provide better salaries.
Imagine a company whose main product is manufacturing toothbrushes. This firm operates in all of the production and distribution process, from designing the toothbrushes up until having them on sale on major retailers and their own channels, such as physical and online stores. Imagine this company is switching from disposable plastic, a material known to be harmful for the environment, to toothbrushes made from organic materials that are easily decomposable after their use. The production of these materials is also significantly less environmentally impacting than traditional plastic toothbrushes. However, the research necessary to create and manufacture these materials has been expensive and to keep profits, the company decided to raise its prices to compensate for this investment. Consider that all other product characteristics remained the same as before - the increase in price is exclusively to produce toothbrushes made from organic materials.
21 Table 2 – Scenarios shown to respondent
Computer
Imagine a company whose main business is manufacturing premium laptops. This firm operates in all the production and distribution process, from designing the laptops up until having them on sale on major retailers and their own channels, such as physical and online stores. Imagine this company has no major concerns with social and environmental issues related to its business. The main goal of this company is to maximise its profits and it believes that to do so, it should only engage in activities which directly bring added profits to their business. Any increase in price of the product is a result of improvements in the design and quality of the laptops.
Imagine a company whose main business is manufacturing premium laptops. This firm operates in all the production and distribution process, from designing the laptops up until having them on sale on major retailers and their own channels, such as physical and online stores. Imagine this company decides to get a fair labour certification, meaning, among other things, it must raise salaries to its assembling line workers to a level greater than the national average on that industry. This certification means that the firm’s profits could significantly decrease as a result of this increase in salaries. To maintain profits while providing better salaries for its assembling line workers, the firm decides to raise prices on all its products. Consider that no other change in the product is made – the increase in price is exclusively to provide better salaries.
Imagine a company whose main business is manufacturing premium laptops. This firm operates in all the production and distribution process, from designing the laptops up until having them on sale on major retailers and their own channels, such as physical and online stores. Imagine this company is switching from disposable plastic in some of its components, a material known to be harmful for the environment, to components made from reusable materials that can be recycled. The production of these materials is also significantly less environmentally impacting than traditional plastic components. However, the research necessary to create and manufacture these materials has been expensive and to keep profits, the company decided to raise its prices to compensate for this investment. Consider that all other product characteristics remained the same as before - the increase in price is exclusively to produce components made from reusable materials.
Price-fairness assessment
To assess the respondents’ perception of price fairness, two different measures were put into place: Willingness to Pay and Perceived Benefit. Using the two, it was possible to derive to a value of perceived price fairness.
To measure the respondent’s Willingness to Pay, the Van Westendorp Price Sensitivity Meter (Westendorp, 1976) framework was used. Research has shown that this method provides a very high predictive quality of more complex models, namely the Becker-DeGroot-Marschak model, with the convenience of direct hypothetical surveys (Kunter, 2016). Thusly, the model makes for a rather feasible option for this study. For it to provide a fair representation of Willingness to Pay, respondents must answer to four questions:
• “At what price do you consider the product to become inexpensive but you would still consider it to be a bargain?” (Cheap);
• “At what price do you consider the product to become expensive but you would still consider buying it?” (Expensive);
• “Above what price would the product become too expensive so that you would not consider buying it?” (Too expensive);
• “Below what price would the product become so inexpensive that you would doubt its quality and not consider buying it?” (Too cheap).
These responses are registered as prices whose frequencies are cumulated and plotted for analysis. In the final plot, there are four critical points used to generate an acceptable pricing range (Kupiec & Revell, 2001):
• Point of marginal cheapness (PMC): The price at which the same proportions of respondents experience the product as “not cheap” and “too cheap”;
23 • Point of marginal expensiveness (PME): The price at which the same proportions of
respondents experience the product as “not expensive” and “too expensive”;
• Optimal pricing point (OPP): The proportions of respondents deeming the product as too expensive and too cheap are (quite low and) the same;
• Indifference point: Can be considered as the "normal" price at which the proportions of respondents that feel the product is cheap and expensive are the same.
The most insightful piece of information that this framework provides considering the scope of this study is the Acceptable Price Range (APR), which ranges between the PME and the PMC. This will be the main metric to compare between the scenarios seen by the respondents. Ideally, we expect the APR on the scenarios in which firms did not engage in any form of CSR to be lower relative to the scenarios in which respondents were shown any form of CSR engagement.
To measure benefits, respondents were directly asked to report what is the percentage of added benefit they perceived by the implementation of social policies they might have seen. It is important to state that respondents were only asked to do so if they had gone through a scenario of CSR engagement. This means that, due to the random nature of scenario assignment to each respondent, it is possible that some respondents only saw scenarios with no CSR engagement and, thus, did not respond to this question. Respondents who did see this question were asked to report their level of perceived added benefit from -100 to 100, allowing them to report a negative value, in which the benefit they perceived did not compensate the price hike described in the scenario shown.
24
Complementary assessments
The last section of the survey had two main objectives: on one hand, to assess if the respondent had any previous knowledge about CSR prior to answering to the survey and to identify their purchasing behaviours relative to the product they had seen as well as any pre-existing tendency to buy said products from firms that actively engage in CSR activities. The information gathered in this section of the survey was, in the end, not used in the analysis since it would provide broader and potentially divert attention from the main core of the study’s objective. Please refer to the supplementary materials to see the whole survey script.
25
Results
This chapter is dedicated to report on the main findings of the study, namely on what are the observable effects of CSR engagement on perceived price fairness. The recorded effect to each of the dependent variables – Willingness to Pay and Perceived added Benefit were measured and then compared. This broader sense of Price Fairness is the main knowledge gap which similar previous studies did not grasp.
Overall Willingness to Pay and Price Sensitivity
Westendorp’s (1976) Price Sensitivity Meter was used to measure Willingness to Pay. This method was used for all three scenarios – No CSR Engagement, Fair Labour and Evironmentalism - in each of the products shown. This allows for the comparision of results amonbgst the different cohorts. Nonetheless, the overall consumption patterns with regards to price for each of the proucts will now be described. These value will act as references for the scenario manipulation performed in the survey.
Coffee
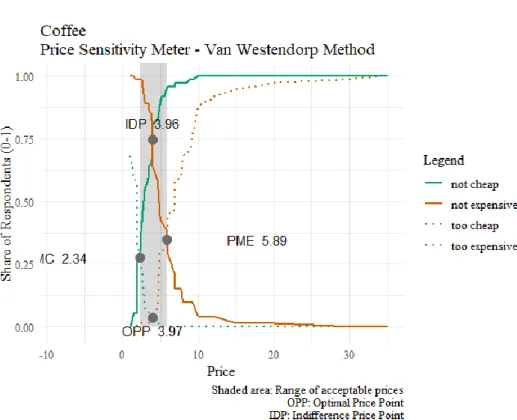
Following Murphy and Enis’ (1986) framework, Coffee falls under the Convenience Products, which means that consumers typically are not interested in spending much when purchasing them. These products can also be referred to as commodities. The following graph shows the results of using Westendorp’s Price Sensitivity Meter to all survey respondents with valid results (n = 72). Responses in which price preferences were not transitive were not considered. This means that prices had to be in ascending order from the “Too cheap” category
26 up until the “Too expensive” category in order to be considered in the model. Prices are reported in Euros (€).
Figure 2 - Price Sensitivity Meter for Coffee
As seen on the graph, the overall price sensitivity from all valid survey respondents leads to a Point of Marginal Cheapness (PMC) of 2.34 €, an Indifference Price Point (IPP) of 3.96 €, an Optimal Price Point (OPP) of 3.97 € and a Point of Marginal Expensiveness (PME) of 5.89 €. The PMC and PME also define the lower bound and upper bound of the Accepted Price Range (APR), respectively. It is important to bear in mind that IDP is set the value at which the same proportion of respondents consider the product to be “Not Cheap” and “Not Expensive”. On the other end, the OPP is set when the same proportion of respondents see a product to be “Too cheap” and “Too expensive”.
27
Toothbrush
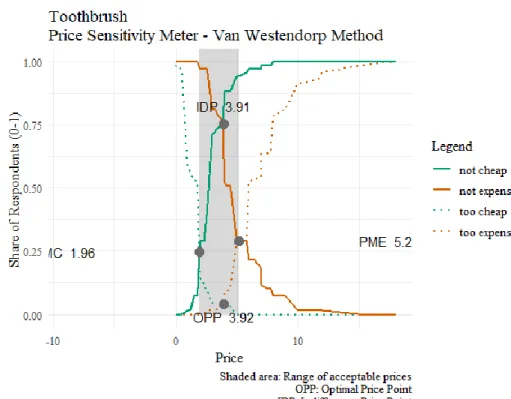
Using the same framework for product classification, toothbrushes fall under the Preference Product category. The biggest difference from the Convenience Products is the fact there’s a higher perception of risk of failing expectations, mostly caused by advertisement. The same criterion of price transitivity was also considered, which led to a total of 69 valid observations (n = 69). Furthermore, prices were likewise reported in Euros (€). The graph below shows the plotted results of running Van Westendorp’s method.
Figure 3 - Price Sensitivity Meter for Toothbrush
Having a brief analysis, we are able to see that the values are of similar magnitude when compared to the previous graph, even the fact that in both situations the IDP and OPP take almost the same value. Even so, the APR, defined at its lower bound by the PMC and at its
28 higher bound by the PME, goes from 1.96 € to 5.2 €. The IDP is set at 3.91 €, whilst the OPP is 3.92 €.
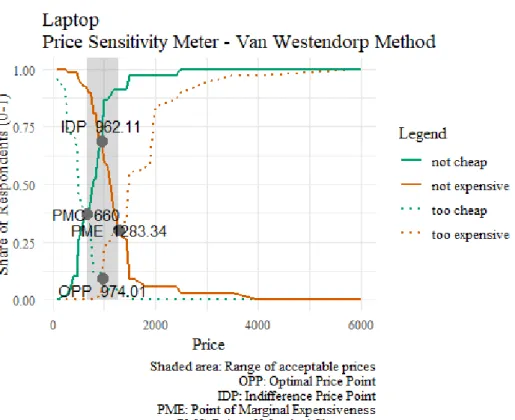
Laptop
The last typified product was, under the Product Classification Framework used throughout the study, is the Shopping Product. These products differ from the previous two as consumers tend to invest a significant amount of time researching before the act of purchasing and simultaneously there’s a high risk of having their expectations towards the product let down. The product shown to respondents was a a laptop. The following graph illustrates the results of the study using this framework, using the same criteria as before. The total number of valid observations for this product was of 68 (n = 68).
29 The values for this product are naturally substantially higher since the product itself is of much higher value. Unlike the two other products under analysis, there is a bigger variation in between the IDP – of 962.11 € – and the OPP – standing at 974.01 €. The APR ranges from 660 € and 1283.34 €. It is also noteworthy to see that in all three products, the curves tend to have a long tail to the right of the graph, making them skewed to the right. This is a result of outliers’ responses that were considered. These responses do not, however, alter the data’s reliability since the model considers only the proportion of respondents that answer to any given price point. As such, the overall price points are not, for the most of it, affected by the outliers registered in the data set – they are, after all, outliers and represent a fairly small portion of the observations.
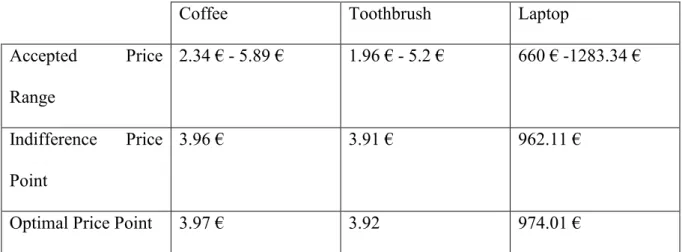
The table below provides a schematic overview of the overall Price sensitivity amongst all survey respondents.
Coffee Toothbrush Laptop
Accepted Price Range 2.34 € - 5.89 € 1.96 € - 5.2 € 660 € -1283.34 € Indifference Price Point 3.96 € 3.91 € b f g h a d a 962.11 €
Optimal Price Point 3.97 € 3.92 f g h a d a 974.01 € Table 3 - Price Sensitivity for all products under analysis
30
Scenario Manipulation
The previous analysis sets the pace for the scenario manipulation that was designed to control the effect that CSR Engagement was expected to have, by presenting respondents with different scenarios on a randomised manner.
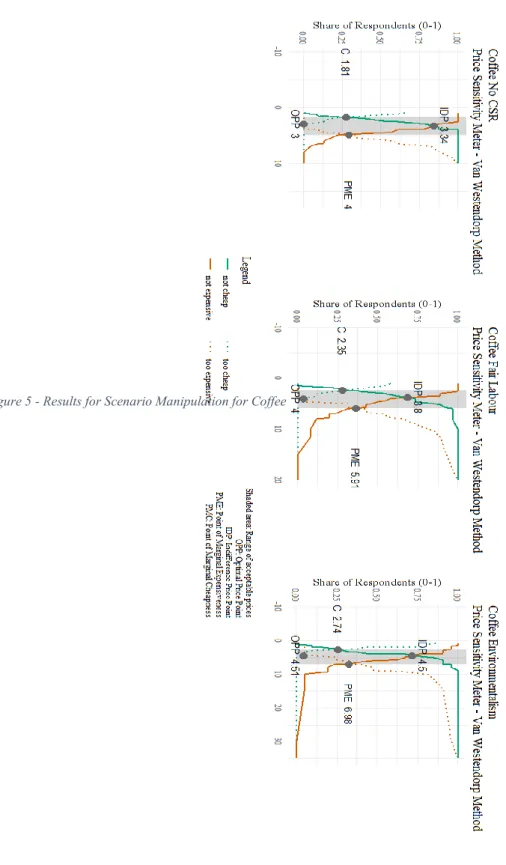
Coffee
As previously described, respondents were randomly assigned to a different scenario for each of the products under analysis and were then asked to answer how much they were willing to pay for said product, following the Price Sensitivity Meter methodology. The results shown in the following graphs followed the same rules as before - prices had to be transitive, i.e. in ascending order and were all reported in Euros (€). For the scenario acting as the control group, in which respondents saw a scenario in which the firm did not engage in any sort of CSR activity, there was a total of 23 valid responses (n = 23). On the scenario where Fair Labour was shown there were 26 valid observations (n = 26). Lastly, the scenario with the Environmentalism scenario had a total of 21 valid observations (n = 21).
31 Figure 5 - Results for Scenario Manipulation for Coffee
32 The results portray a variation in prices in both scenarios where the firm actively engaged in CSR activities. The APR for the scenario with no CSR engagement ranged from 1.81 € to 4.89 €, whereas in the Fair Labour scenario ranged from 2.35€ to 5.91€, making for an increase of 30% in the lower bound and of 21% in the upper bound. In the Environmentalism scenario, this range was between 2.74€ and 6.98€, meaning an increase of 50% and 43% for the lower and upper limit, respectively. It is also interesting to see that OPP also had a significant increase in both active CSR engagement scenarios, namely it set at 3€ in the control scenario whilst it measured at 4€ and 4.51€ in the Fait Labour and Environmentalism scenarios, respectively. These results suggest that indeed CSR engagement had a positive effect on customers’ Willingness to Pay.
In complement to Perceived Price Fairness, Perceived Benefit measured has the percentage of added benefit they felt by the firm’s implementation of CSR policies, from a scale of -100 to 100 was accessed in the scenarios where active CSR engagement was shown to respondents. On the Fair Labour scenario, the average of added benefit increase perception was of 54.1%, whereas in the Environmentalism scenario it reached 49.1%. In both cases, the perceived added benefit brought by the implementation of the CSR policies shown was larger than the increase in respondents’ Willingness to Pay.
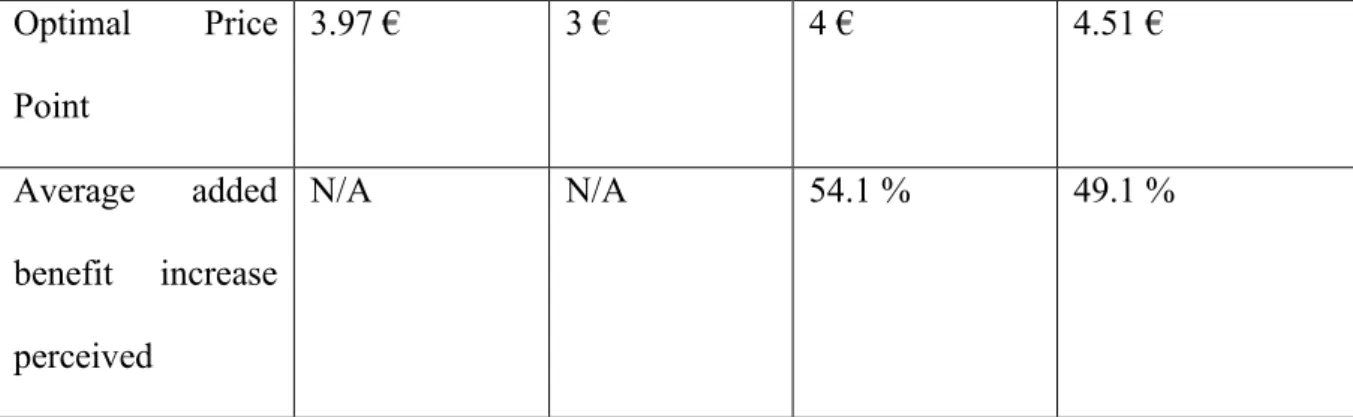
The table shown below summarises all the key indicators the measured by the study on both Willingness to Pay and perception of Added Benefit increase.
Overall No CSR Fair Labour Environmentalism
Accepted Price Range 2.34 € - 5.89 € 1.81 € - 4.89 € 2.35 € - 5.91 € 2.74 € - 6.98 € Indifference Price Point 3.96 € 3.34 € 3.8 € 4.5 €
33 Optimal Price Point 3.97 € 3 € 4 € 4.51 € Average added benefit increase perceived N/A N/A 54.1 % 49.1 %
Table 4 - Price Sensitivity and Perceived Benefit for Coffee
Toothbrush
The next product where scenarios were also manipulated was the toothbrush. The control group, without any sort of CSR engagement had a total of 21 valid responses (n = 21); the Fair Labour scenario registered a total of 23 valid answers (n = 23) and the scenario portraying Environmentalist related activities had a total of 26 answers (n = 26). The following three graphs provide with an overview of Price Sensitivity Meter results on all three scenarios.
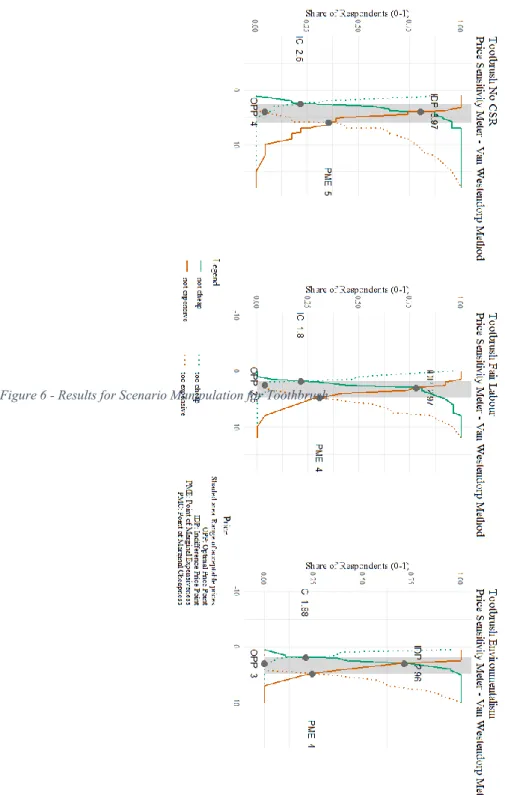
34 Figure 6 - Results for Scenario Manipulation for Toothbrush
35 Contrary to the previous product, the results of the Price Sensitivity Meter when applied to the toothbrush seem to have an opposite effect, where the main indicators of price in the active CSR engagement scenarios decreased relative to the control group. More specifically, the APR of the No CSR group was between 2.5€ and 5.97€, whilst the Fait Labour scenario had this same metric ranging from between 1.8€ and 4.75€, a value which is smaller by 28% and 20% on the lower and upper limits, respectively. On the scenario of Environmentalism, the price points follow the same trend, although in a smaller magnitude – APR ranges from 1.88€ and 4.83€, being down 25% and 19% relative to the range of the control group. The OPP portrays the same patter, where it is registered at 4€ for the control group and 2.5€ and 3€ on the Fair Labour and Environmentalism scenarios, respectively. This accounts for a drop of 38% and 25%, respectively.
On the other hand, the spectrum of added benefit perceived by the respondents does not go in line with this decrease in Willingness to Pay. When faced with the Fair Labour scenario, reported a perception of 49.4% of added benefit, whilst the ones faced with the Environmentalism scenario reported a significant increase of 66%. It is noteworthy to point out that in both cases, respondents pointed to an increased perceived benefit added but this does not reflect itself on their Willing to Pay metrics.
The table below presents the main indicators of the Price Sensitivity Meter.
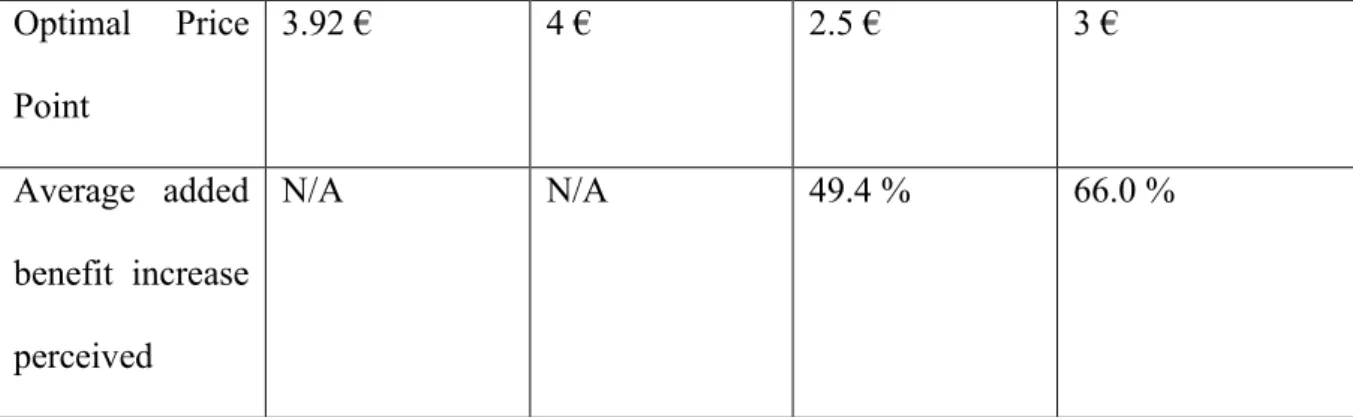
Overall No CSR Fair Labour Environmentalism
Accepted Price Range 1.96 € - 5.2 € 2.5 € - 5.97 € 1.8 € - 4.75 € 1.88 € – 4.83 € Indifference Price Point 3.91 € 3.97 € 2.97 € 2.96 €
36 Optimal Price Point 3.92 € 4 € 2.5 € 3 € Average added benefit increase perceived N/A N/A 49.4 % 66.0 %
Table 5 - Price Sensitivity and Perceived Benefit for Toothbrush
Laptop
The last product under analysis is the laptop and, as we have seen, it belongs to a significantly different product category. As to maintain the same level of thoroughness in all the analyses done, the same criteria was considered in this product, namely the price transitivity property. For the scenario with no CSR, there were a total of 24 valid answers (n = 24); on the Fair Labour scenario was of 21 (n = 21) and, lastly, in the Environmentalism scenario that figure was also 21 (n = 21). The following graphs show the main indicators of this framework.
37 Figure 7 - Results for Scenario Manipulation for Laptop
38 The results on this analysis once again support the general hypothesis that CSR engagement has a positive effect on consumers’ Willingness to Pay. We are also able that the results suggest a different magnitude of this effect depending on the social cause supported by the firm. In this specific case, the APR in the control cohort ranged from 533.34€ to 1133.34€. On the scenario of Fair Labour, this range saw an increase on the APR – on the lower bound, the value was of 500€ (a decrease of 6%), whereas the upper bound sored to 1300.01€, making an increase of 15%. The environmentalism scenario portrayed the biggest increase on both edges of the range – the lower bound increased by 47% to 783.34€, whilst the upper bound increased by 26% to a total of 1422.23€. The OPP differences point in the same direction, since the control group reported an OPP of 900€; the Fair Labour group registered this to be 937.51€, making for an increase of 4%. Lastly, the group faced with the environmental scenario made for an OPP of 986.67€, an increase of 10%.
Considering the perceived added benefit, the two groups who answered to this question reported almost the same increase in this metric: 57% on the Fair Labour group and 56.9% in the Environmental group. In both cases, the increase in perceived added benefit outweighed the increase in Willingness to Pay.
Overall No CSR Fair Labour Environmentalism
Accepted Price Range 660 € -1283.34 € 533.34 € - 1133.34 € 500 € - 1300.01 € 783.34 € - 1422.23 € Indifference Price Point 962.11 € 840 € 866.67 € 990 € Optimal Price Point 974.01 € 900 € 937.51 € 986.67 €
39 Average added
benefit increase perceived
N/A N/A 57.0 % 56.9 %
40
Discussion
Main Insights
Taking into consideration the results found in the previous chapters, the Price Sensitivity Meter framework provided with different results for each of the products described to respondents. This section aims to gather the key takeaways that can be derived from the research’s results.
For coffee, the results were indicative of a positive effect of CSR engagement and Willingness to Pay: in both scenarios with active CSR engagement, the indicators for Willingness to Pay suffered a substantial increase relative to the control group, supporting the hypothesis that CSR engagement has a positive effect on consumers’ Willingness to Pay. This effect is even greater in the Environmentalism scenario, supporting the hypothesis that the social cause supported has a moderating effect. Combining that and the fact that, for both cases, the variation in perceived benefit was superior than the variation in Willingness to Pay, the data supports the hypothesis that CSR engagement seems to have a positive effect on Perceived Price Fairness for Convenience Products. Discussions on whether all products belonging to this category would follow the same pattern can be held but are out of the scope of this research.
For toothbrushes, an opposite path seems to have been taken. The scenarios in which the firm had an active CSR policy resulted in a negative variation on Willingness to Pay which goes against the overall hypothesis of the positive effect CSR engagement has on Perceived Price Fairness, considering customers are, according to the results. not willing to pay as much for a product from a firm that is involved in CSR activities. With the data gathered for this dissertation it would be quite difficult to find an underlying motive for this phenomenon. However, we can extrapolate that, in this specific product, consumers are not particularly
41 sensible on how CSR can benefit their purchasing experience. One other hypothesis to sustain this pattern would be that this Preference Products tend to follow this behaviour.
Gathered data on the last product analysed, the laptop, also supported the main hypothesis that CSR has a positive on Perceived Price Fairness. On one hand, Willingness to Pay increased in the cohorts that were presented with an active CSR scenario when compared to the treatment group. Additionally, the increase in perceived outweighed the increase in Willingness to Pay, thus making for an overall increase in Perceived Price Fairness. The difference in the effects between the two groups with CSR scenarios also supports the hypothesis that the social cause a firm chooses to endorse has a moderating effect on overall Perceived Price Fairness.
Managerial Implications
The framework used in this dissertation to measure Willingness to Pay, the Price Sensitivity Meter, portrays very useful and practical insights to Managers who are assessing the viability of their CSR strategies and how they can improve their overall strategical assets.
The first main takeaway for Managers is that price points of the same products can be adjusted to reflect the CSR strategy. For two of the three cases analysed, this means that firms can rise their prices for products that are supported by a CSR strategy, ceteris paribus. And even in doing so, customers feel as if the price they are paying is more reasonable than the non-CSR compliant counterparts. This may be one of the main motives as to why there is a positive correlation between CSR and profitability for firms. Previous literature in the field has not yet explored this particular premise.
Another interesting insight this study finds is that Perceived Benefit and Willingness to Pay are not necessarily correlated. In fact, the case for the toothbrush points precisely to the
42 contrary: customers may have a big increase in their Perceived Benefit coming from a firm’s CSR policies but may not be willing to pay for it. Now, this was a rather unexpected behaviour found in the study and, unfortunately, the data gathered does not provide with a clear explanation as to why it happened. Nonetheless, I would like to bring some ideas that might explain this observed behaviour, which is mostly based on potential lurking variables that were not accounted in the study’s design. For once, we might consider that there could be a bias in the respondents’ Perceived Benefit. This can result from an overall communal perception that CSR is supposed to be good and I, as a costumer, am obliged - or at least pressured to identify a positive outcome from it. This in turn might inflate the Perceived Benefit respondents have reported. The other bias that possibly can explain this variation might come from respondent’s previous exposure to similar CSR initiatives associated with the product. We can hypothesise that certain products within a market have a stronger association with CSR than others. This could then set an expectation as to how a certain firm that produces a similar product should behave in terms of CSR engagement. And if, in a certain market, most firms already engage in CSR activities, then the Perceived Benefit coming from a firm that adopts a new CSR initiative in said market might be lower since consumers have already gotten used to that corporate behaviour. The inverse reasoning also applies, i.e., if a firm decides to engage in CSR initiatives in a market where this is not traditional, then the “novelty effect” may inflate consumers’ Perceived Benefit.
43 The dissertation was naturally faced with some limitations in terms of providing more comprehensive results to study the phenomenon in its scope. I intend to point these shortcomings as well as suggesting possible progress in research.
The main limitation the study bears is the fact that it identifies, in two of the observed cases, that CSR engagement has an effect on Willingness to Pay and Perceived Benefit but comes short in explaining what motive there may be to explain this effect. One study had identified that, particularly for environmental purchases, there’s a relationship between customers’ pre-existing consciousness regarding environmental issues to their pro-environmental purchasing behaviour (Schlegelmilch, Bohlen, & Diamantopoulos, 1996). One suggestion for future research is to see if this relation is also valid for other sort of social causes and if there’s a measurable effect on purchase intentions.
Furthermore, it is also to point out that some of the observations recorded were not deemed valid, which made the total number of valid observations too small as to provide with statistically significant testing, namely in the scenario manipulation phase. This would act as a supplementary method to assess the manipulation’s effect on the dependent variables as well discovering other moderators that were not originally considered. In fact, regressions were made in an attempt to see what factors could influence both dependent variables, but the results were inconclusive. A solution to this would be to replicate the study with a larger sample and controlling for more potential moderators.
44
References
Aguilera, R., Rupp, D., Williams, C., & Ganapathi, J. (2007). Putting the s back in corporate social responsibility: A multilevel theory of social change in organizations. Academy of
Management Review, 32(3), 836-863.
Aguinis, H. (2011). Organizational responsibility: Doing good and doing well. In H. Aguinis,
APA handbook of industrial and organizational psychology, Vol 3: Maintaining, expanding, and contracting the organization. (pp. 855-879). Washington, DC, US:
American Psychological Association.
Aguinis, H., & Glavas, A. (2012). What We Know and Don't Know About Corporate Social Responsibility: A Review and Research Agenda. Journal of Management, 38(4), 932-968.
Andrews, M., Luo, X., Fang, Z., & Aspara, J. (2014). Cause marketing effectiveness and the moderating role of price discounts. Journal of Marketing, 78(6), 120-142.
Bansall, P., & Roth, K. (2000). Why Companies Go Green : A Model of Ecological Responsiveness. Academy of Management Journal, 43(4), 717-736.
Barnett, M., & Salomon, R. (2006). Beyond dichotomy: The curvilinear relationship between social responsibility and financial performance. Strategic Management Journal, 27(1), 1101-1122.
Barney, J. (1991). Firm Resources and Sustained Competitive Advantage. Journal of
Management, 17(1), 99-120.
Barone, M., Miyazaki, A., & Taylor, K. (2000). The influence of cause-related marketing on consumer choice: Does one good turn deserve another? Journal of the Academy of
Marketing Science, 28(2), 248-262.
Bhattacharya, C., & Sen, S. (2004). Doing Better at Doing Good: When,Why, and How Consumers Respond to Corporate Social Initiatives. California Management Review,
47(1), 9 - 24.
45 Carroll, A. (1979). A Three-Dimensional Conceptual Model of Corporate Performance.
Academy of Management Review, 4(4), 497-505.
Carroll, A. (1999). Corporate Social Responsibility: Evolution of a Definitional Construct.
Business & Society, 38(3), 268-295.
Christmann, P., & Taylor, G. (2006). Firm self-regulation through international certifiable standards: Determinants of symbolic versus substantive implementation. Journal of
International Business Studies, 37(6), 863-878.
Davis, K. (1960). Can Business Afford To Ignore Social Responsibilities? California
Management Review, 2(3), 70-76.
Davis, K. (1973). The Case for and Against Business Assumption of Social Responsibilities.
Academy of Management Journal, 16(2), 312-322.
Drumwright, M. (1996). Company advertising with a social dimension: The role of noneconomic criteria. Journal of Marketing, 60(4), 71-87.
Epstein, E. (1987). The Corporate Social Policy Process: Beyond Business Ethics, Corporate Social Responsibility, and Corporate Social Responsiveness. California Management
Review, 29(3), 99-114.
European Commission. (2011, October 20). Corporate Social Responsibility & Responsible
Business Conduct. Retrieved from
https://ec.europa.eu/growth/industry/corporate-social-responsibility_en
Fitch, H. (1976). Achieving Corporate Social Responsibility. Academy of Management Review,
1(1), 38-46.
Freeman, R. (1984). Strategic management: A stakeholder approach.
Friedman, M. (1970, 9 13). The Social Responsibility of Business is to Increase its Profits. The
New York Times Magazine, p. 17.
Habel, J., Schons, L., Alavi, S., & Wieseke, J. (2016). Warm glow or extra charge? The ambivalent effect of corporate social responsibility activities on customers' perceived price fairness. Journal of Marketing, 80(1), 84-105.
Johnson, H. L. (1971). Business in contemporary society: framework and issues. Wadsworth Pub. Co.
46 Jones, T. (1980). Corporate Social Responsibility Revisited, Redefined. California
Management Review, 22(2), 59-67.
Kraft, T., Valdés, L., & Zheng, Y. (2018). Supply Chain Visibility and Social Responsibility: Investigating Consumers’ Behaviors and Motives. Manufacturing & Service
Operations Management, 20(4), 1 - 20.
Kunter, M. (2016). the Van Westendorp Price-Sensitivity Meter As a Direct Measure of Willingness-To-Pay. European Journal of Management, 16(2), 45-54.
Kupiec, B., & Revell, B. (2001). Measuring consumer quality judgements. British Food
Journal, 103(1), 7-22.
Lichtenstein, D., Drumwright, M., & Braig, B. (2004). The effect of corporate social responsibility on customer donations to corporate-supported nonprofit. Journal of
Marketing, 68(4), 16-32.
Lindgreen, A., Swaen, V., & Johnston, W. (2009). Corporate social responsibility: An empirical investigation of U.S. organizations. Journal of Business Ethics, 85, 303-323.
Maslow, A. (1943). A Theory of Human Motivation. Psychological Review, 50, 370-396. McGuire, J. W. (1963). Business and Society. McGraw-Hill.
McWilliamns, A., & Siegel, D. (2001). Corporate Social Responsibility: A Theory of the Firm Perspective. The Academy of Management Review, 26(1), 117-127.
Mohr, L., & Webb, D. (2005). The effects of corporate social responsibility and price on consumer responses. Journal of Consumer Affairs, 39(1), 121-147.
Murphy, P., & Enis, B. (1986). Classifying Products Strategic. Journal of Marketing, 50(3), 24-42.
OECD. (2001). Corporate Social Responsibility: Partners for Progress.
Orlitzky, M., Schmidt, F., & Rynes, S. (2003). Corporate social and financial performance: A meta-analysis. Organization Studies, 24(3), 403-441.
Peloza, J. (2009). The challenge of measuring financial impacts from investments in corporate social performance. Journal of Management, 35(6), 1518-1541.
47 Schlegelmilch, B., Bohlen, G., & Diamantopoulos, A. (1996). The link between green purchasing decisions and measures of environmental consciousness. European Journal
of Marketing, 30(5), 35-55.
Sen, S., & Bhattacharya, C. (2001). Does doing good always lead to doing better? Consumer reactions to corporate social responsibility. Journal of Marketing Research, 38(2), 225-243.
Sen, S., Bhattacharya, C., & Korschun, D. (2006). The role of corporate social responsibility in strengthening multiple stakeholder relationships: A field experiment. Journal of the
Academy of Marketing Science, 34(2), 158-166.
Tian, Z., Wang, R., & Yang, W. (2011). Consumer Responses to Corporate Social Responsibility (CSR) in China. Journal of Business Ethics, 101(2), 197-212.
Tuzzolino, F., & Armandi, B. (1981). A Need-Hierarchy Framework for Assessing Corporate Social Responsibility. Academy of Management Review, 6(1), 21-28.
Waddock, S. (2004). Parallel Universes: Companies, Academics, and the Progress of Corporate Citizenship. Business and Society Review, 109(1), 5-42.
Waddock, S., & Graves, S. (1997). The Corporate Social Performance–Financial Performance Link. Strategic Management Journal, 18(4), 303-319.
Wagner, T., Lutz, R., & Weitz, B. (2009). Corporate hypocrisy: Overcoming the threat of inconsistent corporate social responsibility perceptions. Journal of Marketing, 73(6), 77-91.
Walton, C. C. (1967). Corporate Social Responsibilities. Wadsworth Pub. Co.
Wartick, S., & Cochran, P. (1985). The Evolution of the Corporate Social Performance Model.
The Academy of Management Review, 10(4), 758-769.
Westendorp, P. H. (1976). NSS: Pricesensitivity-meter (PSM). Venice: ESOMAR Congress 1976: Research That Works For Today's Marketing Problems.
Wood, D. (1991). Corporate Social Performance Revisited. Academy of Management Review,
16(4), 691-718.
Xia, L., Monroe, K., & Cox, J. (2004). The price is unfair! A conceptual framework of price fairness perceptions. Journal of Marketing, 68(4), 1-15.