i
12º Encontro de Química dos Alimentos
Composição Química, Estrutura e Funcionalidade:
A Ponte Entre Alimentos Novos e Tradicionais
12
th
Meeting on Food Chemistry
Bridging Traditional and Novel Foods:
Composition, Structure and Functionality
Extended Abstracts
Sociedade Portuguesa de Química
Divisão de Química Alimentar
Instituto Superior de Agronomia
10 a 12 de Setembro de 2014
ii
Ficha técnica
Título
12º Encontro de Química dos Alimentos
Composição Química, Estrutura e Funcionalidade: A Ponte Entre Alimentos Novos e Tradicionais
12th Meeting on Food Chemistry
Bridging Traditional and Novel Foods: Composition, Structure and Functionality
Editores/Coordenção Isabel Sousa Anabela Raymundo Catarina Prista Vitor Alves Edição
Sociedade Portuguesa de Química
ISBN
978-989-98541-6-1
Setembro 2014
Esta publicação reúne as actas enviadas referentes às comunicações apresentadas no 12º Encontro de Química dos Alimentos. Todas as comunicações foram avaliadas pela Comissão Científica do Encontro.
5
Committees
Chair:
Isabel Sousa (ISA-ULisboa) Co-chair:
Anabela Raymundo (ISA-ULisboa)
Organizing Committee
▪ Anabela Raymundo (ISA- Universidade de Lisboa) ▪ Catarina Prista (ISA- Universidade de Lisboa) ▪ Isabel Sousa (ISA- Universidade de Lisboa) ▪ Mara Pereira (ISA- Universidade de Lisboa) ▪ Patrícia Fradinho (ISA- Universidade de Lisboa) ▪ Vitor Alves (ISA- Universidade de Lisboa)
Scientific Committee ▪ Aida Moreira (ESA -IPCoimbra)
▪ Anabela Raymundo (ISA- Universidade de Lisboa) ▪ António Vicente (Universidade do Minho)
▪ Beatriz Oliveira (FF- Universidade do Porto)
▪ Isabel Coelhoso (FCT – Universidade Nova de Lisboa) ▪ Isabel Sousa (ISA- Universidade de Lisboa)
▪ Joana Amaral (ESTiG-IPBragança) ▪ Leonor Nunes (IPMA)
▪ Manuel A. Coimbra (Universidade de Aveiro) ▪ Miguel Mourato (ISA- Universidade de Lisboa)
▪ Pedro Sousa Moreira (FCNutrição – Universidade do Porto) ▪ Silvina Palma (ESA-IPBeja)
Committee of Honour
▪ Amélia Pilar Rauter (FC - Universidade de Lisboa) ▪ Ivonne Delgadillo (Universidade de Aveiro) ▪ Jorge Justino (ESA- IPSantarém)
▪ José Empis (ISA- Universidade de Lisboa) ▪ José Teixeira (Universidade do Minho) ▪ Luis Mira da Silva (INOVISA)
12º Encontro de Química dos Alimentos
2
Protective activity of coffee silverskin extracts: evaluation on erythrocyte
oxidative-induced hemolysis
Ana F. Vinha a,b, Elísio Costa c, Anabela S.G. Costa a, Rita C. Alves a,d,
Alice Santos-Silva c, M. Beatriz P.P. Oliveira a*
a
REQUIMTE, Dep. Chemical Sciences, Faculty of Pharmacy, University of Porto, Porto, Portugal.
b
Faculty of Health Sciences, University Fernando Pessoa, Porto, Portugal.
c
IBMC & Dep. Biological Sciences, Faculty of Pharmacy, University of Porto, Porto, Portugal.
d
REQUIMTE, School of Engineering, Polytechnic Institute of Porto, Porto, Portugal.
*beatoliv@ff.up.pt
Keywords: Coffee silverskin; Antioxidants; Erythrocytes; Hemolysis; Protective activity.
ABSTRACT
Natural antioxidants from industry by-products have been receiving increasing attention, having in view the sustainability of the processes. Coffee silverskin, a pellicule that covers the raw coffee bean, is a by-product of coffee roasting since it is detached during this procedure. Human erythrocytes are particularly useful in the evaluation of the antioxidant properties of bioactive compounds, since they are susceptible to endogenous oxidative damage due to their specific role as oxygen carriers. The aim of this work was to evaluate the capacity of natural antioxidants of coffee silverskin to protect erythrocytes from oxidative injury induced by the water soluble radical initiator 2,2-azobis (2-amidinopropane)dihydrochloride (AAPH) and by H2O2. The results showed that coffee silverskin extracts protected erythrocytes in a significant
way from oxidative-AAPH and oxidative-H2O2 induced hemolysis. As far as we know, there
are no investigations, which evaluate the protective activity of coffee silverskin extracts on human erythrocytes hemolysis.
1.INTRODUCTION
Nowadays, there has been a growing interest in vegetal sources as new therapeutic agents. Food by-products are focus of great interest in scientific community, once they may provide natural antioxidant substances. In addition, valorization and re-use of food by-products minimizes industry wastes, with a higher impact in sustainability and economic concepts. Antioxidants have natural potential to modulate oxidative stress, which is related to the development of chronic diseases [1,2]. They can also be useful to identify plant species, provide protection to plants, improve the organoleptic properties of vegetable foods, and can be used as natural preservatives against food degradation [3].
Coffee is one of the most traded commodities in the world [4]. Many wastes are associated with coffee roasting and consumption, for instance, coffee silverskin and spent grounds,
12º Encontro de Química dos Alimentos
3
respectively [5]. Research on coffee silverskin is limited and mainly directed towards the study of its dietary fiber [6], phenolics content of its extracts, and antioxidant activity (measured by spectrophotometric assays) [2,6,7]. As far as we know, there is no study about the potential of coffee silverskin to protect human cell from oxidative damage in oxidative stress conditions. In the current study, the effect of protective activity of two coffee silverskin extracts on erythrocyte oxidative-induced hemolysis was investigated.
2.MATERIAL AND METHODS 2.1. Samples and extracts preparation
Silverskin samples were supplied by Bicafé - Torrefação e Comércio de Café, Lda., Portugal. The sample chosen for this study represents the major by-product of this industry and resulted from the roast of a commercial coffee blend composed by ~40% of arabica (Coffea arabica) and ~60% robusta (Coffea canephora var. robusta) coffee beans.
After reception, samples were ground (Grindomix GM 200, Retsch, Haan, Germany), homogenized and used for extractions preparation. Briefly, ~1 g of ground sample was extracted with 50 mL of water or ethanol, at room temperature, with constant magnetic stirring (600 rpm) during 60 min. Extractions were performed in triplicate. Extracts were lyophilized and re-suspended in PBS (125 mM NaCl and 10 mM sodium phosphate buffer, pH 7.4) before analysis.
2.2. Preparation of Red Blood Cell (RBC) suspensions
Blood was obtained from four healthy volunteers (two women and two men aged 35-45 years) by venipuncture, and collected into tubes containing ethylenediaminetetraacetic acid (EDTA) as anticoagulant. Samples were immediately centrifuged at 2000 g for 10 min; plasma and buffy coat were carefully removed and discarded. Erythrocytes were washed three times with PBS at 4ºC and, finally, suspended in PBS to obtain erythrocyte suspensions at 2.6% hematocrit. Erythrocyte suspensions were used in the day they were prepared.
2.3. Hemolysis inhibition evaluation
For the inhibitory evaluation of hemolysis induced by AAPH and H2O2, the erythrocyte
suspensions were incubated with AAPH or H2O2, with different extract concentrations in
order to obtain a final concentration of 60 mM of AAPH and 1 mM of H2O2, and a hematocrit
of 2%. In all sets of experiments (n=4), a negative (erythrocyte in PBS) and a positive (erythrocyte in PBS with AAPH or H2O2) controls were used. Each control and sample test
was analysed in duplicate.
Incubation of RBC suspensions were carried out at 37 ºC for 2 h, under gentle shaking, in the presence of different extract concentrations (40, 20, 10, 2.5, 0.63, 0.16, 0.04, 0.01, 0.0025 and 0.00062 g/L) and initiator radical (AAPH or H2O2). In the H2O2 assay, sodium azide, in a
12º Encontro de Química dos Alimentos
4
final concentration of 1 mM, was added to inhibit catalase activity. Hemolysis was determined spectrophotometrically. After the incubation period (2 h), an aliquot of the erythrocyte suspension was diluted with 20 volumes of saline solution and centrifuged (1200 g for 10 min). The absorption (A) of the supernatant was read at 540 nm. The absorption (B), corresponding to a complete hemolysis, was acquired after centrifugation of erythrocyte suspension that was previously treated with 20 volumes of ice-cold distilled water. The percentage of hemolysis was then calculated (A/B × 100). The percentage of hemolysis inhibition was calculated considering the hemolysis obtained in the positive control tube as 0% of inhibition.
3.RESULTS AND DISCUSSION
Recent studies conducted both in cell cultures and animal models seem to indicate that polyphenols are the main phytochemicals with antioxidant, cardioprotector, anti-inflamatory and antiproliferative properties [8]. Erythrocytes may be considered as major targets to free radical aggression. Thus, oxidative hemolysis of human cells was used as a model to study the antioxidant effect of coffee silverskin extracts on free radicals induced damage of biological membranes, instead of using the in vitro spectrophotometric methods for assessing antioxidant activity, such as DPPH• inhibition and FRAP assays. According to our previous report [5], coffee silverskin extracts have high content of total phenolics and flavonoids (8.6 mg GAE/g, 4.3 mg ECE/g, respectively) justifying this study. In what concerns to the inhibition of erythrocyte hemolysis, the results demonstrated that coffee silverskin extracts protected erythrocytes in a significant way from oxidative-AAPH and oxidative-H2O2 induced
hemolysis, in a dose dependent manner (Fig. 1).
Fig. 1. Inhibition of hemolysis of erythrocytes (mean ± SEM) at 2% hematocrit, by silverskin extracts
at different concentrations, incubated with AAPH at 60 mM (A) and with 1 mM of H2O2 (B). #
p<0.05 vs previous concentration; ## p<0.05 vs 0.04 g/L concentration; * p<0.05 vs aqueous extract.
As can be observed in Fig. 1, a significant protective effect of silverskin extracts was found at the concentration of 10 g/L, in both methods (AAPH and H2O2-induced oxidative stress) and
for both type of extracts (ethanolic and aqueous). Moreover, the same results were obtained at concentrations of 2.5 and 0.63 g/L in AAPH-induced oxidative stress biological system using the aqueous extract. At lower concentrations of silverskin extracts, a decrease in the protective activity was observed, being undetectable after 0.00062 g/L and 0.01 g/L in AAPH and H2O2
12º Encontro de Química dos Alimentos
5
obtained with the two extracts (ethanolic and aqueous), a significant lower protective effect was observed for the ethanolic extract, showing the highest protective activity of the aqueous extracts. The protective effect of more rich silverskin extracts (40 and 20 g/L) were also evaluated. However, given the intensity of dark coloration of silverskin, it was not possible to perform the spectrophotometric readings. Thus, after 2 h of incubation the erythrocyte morphology (Fig. 2) was evaluated, showing a pro-oxidant effect, due to the presence of free hemoglobin erythrocytes (ghost cells).
Figure 2. Optical microscopic evaluation of erythrocyte morphology. A) Control just with
erythrocytes; B) Positive control with erythrocytes and AAPH, with low cells density and with the presence of free hemoglobin erythrocytes (ghost cells) C) Erythrocytes incubated with 40 g/L of silverskin extract and AAPH, with presence of ghost cells; D) Erythrocytes incubated with 20 g/L of
silverskin extract and AAPH, with presence of ghost cells.
4.CONCLUSIONS
The results suggest that coffee silverskin may play an important role in protecting cells against oxidative injuries. Other studies are already being conducted to evaluate the potential of this by-product extract to be integrated in food or cosmetic products.
Acknowledgments
R. Alves is grateful to FCT for a post-doc grant (SFRH/BPD/68883/2010) financed by POPH-QREN and subsidized by FSE and MCTES. This work received financial support from the European Union (FEDER funds through COMPETE) and National Funds (FCT) through project Pest-C/EQB/LA0006/2013, as well as from FEDER funds under the framework of QREN through Project NORTE-07-0124-FEDER-000069.
References
[1] F Paiva-Martins, A Silva, V Almeida M Carvalheira, C Serra, JH Rodrígues-Borges, J Fernandes, L Belo, A Santos-Silva. J Agric Food Chem, 2013, 61, 6636-6642.
[2] B Uttara, AV Singh, P Zamboni, RT Mahajan. Curr Neuropharmacol, 2009, 7, 65-74.
[3] N Ahmed, JS Mudasir, A Malik, H Kour, P Gupta, H Chauhan. Int J Pharma Biol Arch, 2013, 4, 22-30.
[4] SI Mussatto, EMS Machado, S Martins, JA Teixeira. Food Bioprocess Technol, 2011, 4, 661-672. [5] ASG Costa, RC Alves, AF Vinha, SVP Barreira, MA Nunes, LM Cunha, MBPP Oliveira. Ind Crops Prod, 2014, 53, 350-357.
[6] RC Borrelli, F Esposito, A Napolitano, A Ritieni, V Fogliano. J Agric Food Chem, 2004, 52, 1338-1343.
[7] LF Ballesteros, JA Teixeira, SI Mussatto. Food Bioprocess Technol, 2014, 7, 1322-1332.
[8] EG Maganha, RC Halmenschlager, RM Rosa, JA Henriques, AL Ramos, J Saffi. Food Chem, 2010, 118, 1-10.
12º Encontro de Química dos Alimentos
10
Phytochemical analysis of three wild edible Portuguese fruits that may
provide potential health benefits
Carina Albuquerque a, Ana F. Vinha a,b*, Anabela S.G. Costa a,
Rita C. Alves a,c, M. Beatriz P.P. Oliveira a
a REQUIMTE, Dep. Chemical Sciences, Faculty of Pharmacy, University of Porto, Porto, Portugal.
b Faculty of Health Sciences, University Fernando Pessoa, Porto, Portugal. c REQUIMTE, School of Engineering, Polytechnic Institute of Porto, Porto, Portugal.
*anafvinha@gmail.com
Keywords: Arbutus unedo L.; Crataegus monogyna Jacq.; Rosa canina L.; phytochemicals;
antioxidant activity.
ABSTRACT
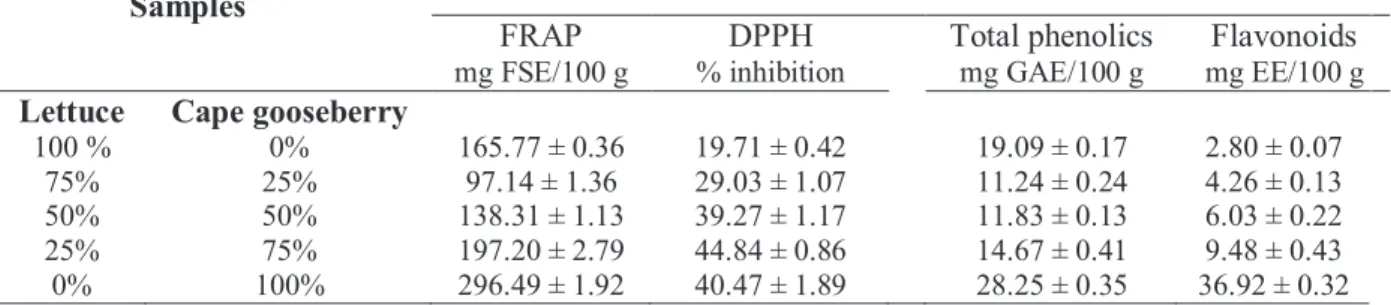
Portuguese flora is recognized for its high biodiversity. Many underutilized wild fruits have great nutritional and functional potentials, providing chemical compounds with biological properties. In this work, the phytochemical composition and antioxidant activity of three wild edible fruits (Arbutus unedo L., Crataegus monogyna Jacq., and Rosa canina L.), collected in the North of Portugal, were evaluated. Hydroalcoholic extracts were prepared from fresh fruits, and total phenolics, flavonoids and anthocyanins contents were determined. Moreover, two different assays were used to evaluate antioxidant activity: 2,2-diphenyl-1-picrylhydrazyl radical (DPPH•) inhibition assay and ferric reducing antioxidant power (FRAP). As expected, a wide variability was found in the composition of these three wild Portuguese fruits. Phytochemical screening revealed considerable amounts of total phenolics (65-150 mg gallic acid eq./100 g), total flavonoids (126-180 mg epicatechin eq./100 g) and anthocyanins (1.66-29.6 mg cyanidin-3-glycoside eq./100 g). Extracts of Arbutus unedo L. fruits presented the highest antioxidant activity, followed by Crataegus monogyna Jacq., and Rosa canina L., by this order.
1.INTRODUCTION
Wild plants have been receiving increasing attention from the scientific community, due to the diversity of species that can promote a greater variety of edible products (plants, fruits) with recognized medicinal properties. Moreover, it has been suggested that wild food plants can be nutritionally superior to some of the cultivated ones [1].
Arbutus unedo L. (strawberry tree), Crataegus monogyna Jacq. (hawthorn), and Rosa canina L. (rosa canina fruits) are some examples of Portuguese natural resources still
underutilized [2,3]. Although these fruits have significant importance to local agriculture communities where they are usually used for industrial production of alcoholic beverages,
12º Encontro de Química dos Alimentos
11
jam, jellies and marmalades [4], they rarely are eaten as fresh fruits. Nevertheless, their medicinal properties are well described in literature. For instance, the fruits of strawberry
tree may be employed in folk medicine for antiseptic, diuretic, and laxative effects [5].
Hawthorn fruits are traditionally used to treat high blood pressure, arrhythmia, and digestive disorders [6]. In turn, rosa canina fruits are used in the treatment of cold and other infections, inflammatory diseases, and as diuretic [7].
For all these reasons, the knowledge about the phytochemical composition of these wild edible fruits is of importance to promote their consumption like fresh fruits. The aim of this work was to determine their total phenolics, flavonoids and anthocyanins contents, as well as their antioxidant activity.
2.MATERIAL AND METHODS
2.1. Samples description and extracts preparation
About 3 kg of each type of fruit were collected in the North of Portugal in 2013: hawthorn and rosa canina fruits in August (Porto), and strawberry tree in January (Viana do Castelo). Fruits were homogenized in a blender and used for extracts preparation. Extracts were prepared using ~2.5 g of fruit and 50 ml of a hydroalcoholic solvent (1:1) with magnetic stirring (600 rpm), at 40ºC, during 60 min. After filtration, the final extracts were stored at -25 ºC, till analysis. Extractions were performed in triplicate for each sample.
2.2. Total phenolics
The total content of phenolics in fruit extracts was evaluated according to Costa et al. [8]. Briefly, 500 ml of extract were mixed with 2.5 ml of the Folin-Ciocalteu reagent (1:10) and 2 ml of a Na2CO3 solution (7.5%, m/v). Subsequently, the solution was incubated during 15 min
at 45 ºC, followed by 30 min incubation at room temperature with absence of light. The absorbance was measured in a BioTek Synergy HT microplate reader (GENS5) at 765 nm. A calibration curve was prepared with gallic acid and total phenolics content was expressed as mg of gallic acid equivalents (GAE)/100 g of sample.
2.3. Flavonoids content
Total flavonoids contents were assessed by a colorimetric assay [9]. Briefly, 1 ml of extract was mixed with 4 ml of distilled water and 300 ml of sodium nitrite (25%). After 5 min of incubation at room temperature, 300 ml of 10% AlCl3 were added, followed (1 min after) by 2
ml of sodium hydroxide (1 M) and 2.4 ml of ultrapure water. The absorbance of the mixture was then measured at 510 nm. A calibration curve was prepared with epicatechin and total flavonoids content was expressed as mg of epicatechin equivalents (EE)/100 g of sample.
12º Encontro de Química dos Alimentos
12
2.4. Anthocyanins content
Total anthocyanins content was determined according to Burdulis et al. [10]. Briefly, an extract aliquot was diluted with 0.1% (v/v) hydrochloric acid and the absorbance of the final solution was measured at 528 nm. Results were expressed as mg cyanidin-3-glycoside equivalents/100 g of sample.
2.5. DPPH• radical scavenging assay
Anti-radical activity of fruit extracts was evaluated by transferring 14 ml of extract (1:10) to 186 ml of a freshly prepared DPPH• solution (9.3 x 10⁻⁵ mol/L in ethanol). The absorbance decrease was measured at 525 nm to observe the kinetics reaction and a stable plateau was achieved at 40 min. Results were calculated as % of DPPH• inhibition.
2.6. Ferric reducing antioxidant power assay
The analyses were carried out according to the method described by Benzie and Strain [11], with minor modifications. Briefly, 90 ml of diluted extract (1:10) were added to 270 ml of deionized water and 2.7 ml of FRAP solution. After homogenization, the final mixture was held in the dark for 30 min at 37 ºC, and absorbance was subsequently measured at 595 nm. A calibration curve was prepared with ferrous sulfate and reducing antioxidant power was expressed as mg of ferrous sulfate equivalents (FSE)/g of sample.
3.RESULTS AND DISCUSSION
The phytochemical analyses showed the presence of constituents known to exhibit physiological activities that may provide health benefits. Nevertheless, significant differences (p<0.05) were found between the bioactive compounds content of the three wild Portuguese fruits analysed in this study (Table 1).
Table 1. Content of total phenolics (mg gallic acid eq./100 g), flavonoids (mg epicatechin eq./100 g),
and anthocyanins (mg cyanidin-3-glycoside eq./100 g) in fruits. Antioxidant activity was measured by DPPH (% of inhibition) and FRAP (mg ferrous sulfate eq./ g) assays.
Results are presented as mean ± standard deviation.
Data followed by different letters within each column are significantly different at p<0.05.
Fruits of strawberry tree presented the highest levels of total phenolics, but hawthorn
ones showed superiority in flavonoids and anthocyanins contents. Strawberry tree fruit
Phenolics Flavonoids Anthocyanins DPPH FRAP
Strawberry tree fruits 150 ± 1a 129 ± 2b 1.7 ± 0.2c 83.8±0.3a 115.1±1.6a
Hawthorn fruits 133 ± 3b 180 ± 1a 29.6 ± 1.2a 71.3±0.1b 97.6±3.7b
12º Encontro de Química dos Alimentos
13
extracts showed also the highest antioxidant activity (in both methods), followed by hawthorn and rosa canina fruits, by this order.
Phenolics, due to their hydroxyl groups with scavenging ability, highly contribute to the antioxidant activity of botanical materials. The relation between the total phenolics and total flavonoids contents of the fruits analysed in this study and their antioxidant capacity was determined using linear correlations. There was a good linear correlation (R2 =0.496 and R2 =0.941; p < 0.05) between the total phenolics content and the antioxidant activity (DPPH• and FRAP, respectively), which was considerably higher than that found for flavonoids and antioxidant activity (R2 =0.269 for DPPH· and R2 =0.306 for FRAP assays).
4.CONCLUSIONS
Strong correlations were found between total phenolic compounds and antioxidant activity (especially using the FRAP assay), indicating that total phenolics are the main contributors to the antioxidant activity of these three wild edible fruits.
This study show that these three wild edible fruits present considerable amounts of phytochemicals, with high relevance in their antioxidant activity, and, thus, can provide potential health benefits against free radicals produced in the human body.
Acknowledgments
R. Alves is grateful to FCT for a post-doc grant (SFRH/BPD/68883/2010) financed by POPH-QREN and subsidized by FSE and MCTES. This work received financial support from the European Union (FEDER funds through COMPETE) and National Funds (FCT) through project Pest-C/EQB/LA0006/2013, as well as from FEDER funds under the framework of QREN through Project NORTE-07-0124-FEDER-000069.
References
[1] B Burlingame, B. J Food Comp Anal, 2000, 13, 99-100.
[2] BM Ruiz-Rodríguez, P Morales, V Fernández, MC Sánchez-Mata, M Cámara, C Díez-Marqués, M Pardo-de-Santayana, M Molina, J Tardío. Food Res Int, 2011, 44 (5), 1244-1253.
[3] I Oliveira, P Baptista, A Bento, JA Pereira. J Food Nutr Res, 2011, 50 (2), 73-85.
[4] K Pallauf, JC Rivas-Gonzalo, MD del Castillo, MP Cano, S Pascual-Teresa. J Food Com Anal, 2008, 21, 273-281.
[5] M Bnouham, FZ Merhfour, A Legssyer, H Mekhfi, S Maallem, A Ziyyat. Pharmazie, 2007, 62, 630-632.
[6] L Barros, AM Carvalho, ICFR Ferreira. Phytochem Anal, 2011, 22, 181-188. [7] I Roman, A Stănilă, S Stănilă. Chem Cent J, 2013, 7, 73, 1-10.
[8] ASG Costa, RC Alves, AF Vinha, SVP Barreira, MA Nunes, LM Cunha, MBPP Oliveira. Ind Crops Prod, 2014, 53, 350-357.
[9] JY Lin, CY Tang. Food Chem, 2007, 101, 140-147.
[10] D Burdulis, V Janulis, A Milasius, V Jakstas, L Ivanauskas. J Liq Chromatogr Relat Technol, 2008, 31, 850-864.
12º Encontro de Química dos Alimentos
18
Carotenoid profile of different ready-to-eat baby-leaf vegetables
by HPLC-DAD-APCI-MS
J. Santosa*, M. Herrerob, J.A. Mendiolab, E. Ibáñezb, C. D. Barbosaª, M.B.P.P. Oliveiraa
a
REQUIMTE, Departamento de Ciências Químicas, Faculdade de Farmácia, Universidade do Porto, Porto, Portugal
b
Instituto de Investigación en Ciencias de Alimentación (CIAL-CSIC), Campus Cantoblanco UAM, Madrid, Espanha,
*joanasantoscma@sapo.pt
Key-words: baby-leaf vegetables; carotenoid profile; HPLC-DAD-APCI-MS
ABSTRACT
Baby-leaf vegetables are a ready-to-eat products, normally consumed in salads, offering to the consumer a convenient fresh product [1]. Their richness in antioxidant compounds are one of their nutritional advantages, being recognized as a source of bioactive compounds. Carotenoids are plant fat-soluble pigments present in this type of products, which are thought to decrease the risk of degenerative diseases via their antioxidant properties. All carotenoids are capable of inactivating reactive oxygen species (ROS) and may therefore help delay or prevent oxidative damage. However, it is not simple to unequivocally identify the several individual carotenoid compounds present in different plants, due to their diversity and the presence of cis–trans isomeric forms.
In this work, the carotenoid profile of several freeze dried samples of baby-leaf vegetables (green and red lettuce, spearmint, watercress and wild rocket) were determined by HPLC-DAD-APCI-MS method. The samples were first extracted with a solution of 50:50 ammonium acetate 10 mM : Methanol (0.1% BHT) and ultrasounds for 15 min to separate the water-soluble compounds. Then, the residue was extracted twice by sonication with ethyl acetate (0.1% BHT) for another 15 min to recover the samples’ fat soluble pigments. To identify the carotenoids, each fat-soluble extract was injected in an HPLC-DAD-MS2 system, being the carotenoids identified based on the comparison with commercial standards retention times and their UV-Vis and MS spectra [1]. As expected, lutein and β-carotene were the major carotenoids found in these samples, followed by the xanthophylls, violaxantin and neoxanthin. The baby-leaf vegetables showed a similar carotenoid profile to the more mature vegetables, being a good choice to the consumer, adding nutritional value and diversity of flavors to their salads.
1.INTRODUCTION
The development of new varieties of new fresh-cut products tries to meet the consumer expectations in terms of convenience, freshness, flavour and quality [1, 2]. The baby-sized
12º Encontro de Química dos Alimentos
19
leaves appeared in this market as one of the most promising fresh-cut development, being presented as a natural source of health promoting bioactive phytochemicals [1, 2]. The baby- leaf salads are prepared with young leaves that are washed, mixed, and packaged as whole. Their minimal processing confer the product an attractive presentation, where the leaves keep their 3-D structure and have less signs of oxidation due to a smaller stem diameter [2]. On the other hand, the respiration rate is usually higher in more immature products, which may lead to a faster loss of quality [3]. Carotenoid compounds are one of the major classes of phytonutrients in leafy vegetables, being recognized for their in vitro antioxidant capacity [4]. They are terpenoid compounds that contain forty carbon atoms, occurring as pigments usually associated to the photosynthetic apparatus of plants. They are grouped in two main classes: the carotenes (without oxygen atoms, such as lycopene and β-carotene); and the xanthophylls (with oxygen atoms, like lutein, violoxanthin and neoxanthin). In nature, they exist primarily in all-trans isomeric form (more stable), being the cis isomers less common. The carotenoids function in plants is related to light energy capture, being the most abundant carotenoid compounds in green plants carotene, lutein, violaxanthin, and neoxanthin. β-carotene is an important precursor of vitamin A, and all carotenoid compounds are recognized as potent antioxidants. The carotenoid content in plants is dependent of the species and variety, as well as environmental growth factors (such as light, temperature and fertility) and production practices (such as maturity, postharvest handling and storage) [4]. Their chemical structure is also very instable in the presence of light, heat, oxygen and acids, being this a problem to avoid during the extraction process and analysis of carotenoids [4]. The identification of the different carotenoids is normally based on their UV–Vis spectra, being the MS spectra also necessary to differentiate compounds with a very similar UV–Vis spectra [1]. The objective of this work was to characterize and compare the carotenoid composition of five different baby-leaf vegetables stored under refrigerated conditions.
2.MATERIAL AND METHODS 2.1.Samples
Minimally processed green and red lettuce (Lactuca sativa var. crispa), spearmint (Mentha
spicata), watercress (Nasturtium officinale) and wild rocket (Diplotaxis muralis) were
obtained already minimally processed (washed, cut and packed). They were divided in two groups. One was immediately analyzed and the second was stored under refrigerated conditions (3 ± 1 ºC) for 10 days. To preserve the samples until analysis, the baby-leafs were freeze dried, powdered in a knife mill and stored protected from light, oxygen and heat.
2.2. Carotenoids Extraction
About 250 mg of freeze dried sample was extracted with 16 mL of 10 mM ammonium acetate/methanol 1:1 (v/v) in an ultrasound bath for 15 minutes. After centrifugation (14000 g; 15 min) the supernatant was removed. The pellet was then re-extracted twice with ethyl
12º Encontro de Química dos Alimentos
20
acetate (0.1% BHT) (6 + 6 mL) in an ultrasound bath (15 min). After centrifuged (14000g, 15 min.) the two supernatants were combined and dried under nitrogen stream. The residue was re-dissolved in 3 mL of ethyl acetate, and filtered through a 0.45 µm nylon filter before the injection in a HPLC-DAD-APCI-MS2 system.
2.3.Carotenoid Profile Analysis
The equipment used was an Agilent 1200 liquid chromatograph equipped with an autosampler, a DAD, and directly coupled to an ion trap mass spectrometer (Agilent ion trap 6320) via an atmospheric pressure chemical ionization (APCI) interface. To separate the compounds an YMC C30 analytical column (5 μm particle size, 250 x 4.6 mm i.d.) was used, together with the following chromatographic conditions: eluents A: MeOH/water (90:10 v/v) and B MTBE/MeOH/water (90:6:4, v/v/v); gradient program, 0 min, 6.5 %B; 8 min, 6.5 %B; 43 min, 100 %B; 46 min, 6.5 %B; 55 min, 6.5 %B; flow rate of 1 mL min-1, injection volume of 10 μL. The DAD recorded the spectra from 220 to 700 nm, and the chromatograms were monitored at 450 nm. MS analysis was conducted in positive ionization mode using the following parameters: capillary voltage, −3.5 kV; drying temperature, 350 °C; vaporizer temperature, 400 °C; drying gas flow rate, 5 L/ min; corona current, 4000 nA; nebulizer gas pressure, 60 psi. A range from m/z 150 to m/z 1300 was acquired and MS/MS automatic mode was used on the more abundant ions. The major carotenoids were identified by combining UV-Vis spectra, chromatographic properties and MS spectra information, with the values obtained from available standards and data reported in the literature. The quantification was made by the construction of two calibration curve, one of lutein to quantify all identified xanthophylls, and one of β-carotene to quantify the carotene isomers. The results were expressed in mg/ 100 g of fresh weight (f.w.), as mean ± standard deviation of two extracts from each sampling day.
3.RESULTS AND DISCUSSION
The used chromatographic conditions allowed the complete separation of the pigments found in the extract obtained from each baby-leaf (Figure 1). The lutein and trans-β-carotene identification was based on the analysis of standards. By its turns, the identification of the other major xanthophylls was based on their characteristic UV–Vis spectra, [M+H]+, and on the different relative intensities of the main fragments obtained by MS2 experiments (see table 1). The identification of cis-β-carotene was confirmed by the presence of a shift of absorption maxima (approximately 4 nm with respect to λ max of trans-β-carotene) and a low
12º Encontro de Química dos Alimentos
21
Figure 1. HPLD-DAD chromatogram of the carotenoid profile of spearmint.
Table 1. Retention time (Rt), UV-Vis maxima and mass spectral data of the main xanthophylls found
in the baby-leaf vegetables
Carotenoid Rt(min) λ max (nn) [M+H]+ (m/z) MS2 main fragment ions (m/z)
Violaxanthin 18.4 416, 440, 469 601.3 583.4, 565.3 509.4, 491.3, 221.0
Neoxanthin 19.3 414, 436, 464 601.5 583.4, 565.4 491.2
Luteoxanthin 20.0 398, 422, 449 601.3 583.4, 491.4, 221.1
Lutein 23.5 423sh, 445, 473 551.4a 551.4, 533.4, 495.3,429.3
Regarding the quantification of each carotenoid the results are presented in Table 2. Lutein was the principal compound found in the spearmint, watercress and wild rocket leaves. These leaves also showed a higher mean carotenoid content than lettuce leaves.
Table 2. Individual and total carotenoid content (mg/100g f.w.) of different baby-leaf vegetables
(mean value ±standard deviation)
Lutein Violaxanthin Neoxanthin Luteoxanthin all–trans -β-carotene cis -β-carotene Total Green lettuce day 1 5.07±0.33 0.76±0.22 1.31±0.12 0.84±0.14 5.21±0.30 1.34±0.23 17.05±3.41 day 10 4.19±0.10 1.39±0.02 1.08±0.02 0.74±0.30 5.30±0.11 1.57±0.04 14.48±4.34 Red lettuce day 1 3.43±0.89 0.09±0.00 0.56±0.05 0.14±0.02 3.79±0.97 1.09±0.28 10.41±3.11 day 10 2.14±0.02 0.60±0.15 0.59±0.06 0.19±0.04 3.18±0.02 0.85±0.00 8.72±2.61 Spearmint day 1 14.82±1.47 0.34±0.09 1.41±0.25 0.54±0.20 9.89±1.48 3.24±0.18 30.25±3.89 day 10 15.01±0.06 0.54±0.06 1.60±0.01 0.41±0.03 8.79±0.05 3.18±0.02 29.54±0.24 Watercress day 1 10.29±0.26 0.88±0.08 1.69±0.06 0.79±0.05 8.48±0.16 2.22±0.04 24.35±0.34 day 10 10.92±0.29 1.37±0.07 1.79±0.01 0.91±0.02 9.14±0.07 2.70±0.08 26.82±0.33 Wild rocket day 1 11.53±0.64 1.89±0.46 1.65±0.13 0.90±0.16 8.61±0.36 2.92±0.09 27.50±1.53 day 10 11.64±0.39 1.85±0.05 1.70±0.10 0.98±0.11 9.60±0.89 2.97±0.03 28.75±0.31
12º Encontro de Química dos Alimentos
22
4.CONCLUSIONS
The carotenoid profile found in the baby-leaf vegetables was similar to the described for more mature green vegetables. In this sense, these leaves seem to be a good option in terms of the analyzed phytonutrients, being an attractive and convenient way to add nutritional value and diversity of flavors to a balanced meal.
Acknowledgments
J. Santos thanks to QREN for her PostDoc Grant (NORTE-07-0124-FEDER-000069). M.H. thanks to MICINN for a “Ramón y Cajal” grant. This work was supported by FCT project no. PEst-C/EQB/LA0006/2013. The authors thank Iberian Salads S.A for the vegetable samples.
References
[1] J Santos, M Herrero, JA Mendiola, MT Oliva-Teles, E Ibáñez, C Delerue-Matos, MBPP Oliveira. Food Res Int. 2014. 58. 105-111.
[2] A Martínez-Sánchez, MC Luna, MV Selma, JA Tudela, J Abad, MI Gil. Postharvest Biol Technol 2012;63(1):1-10.
[3] D Rico, AB Martín-Diana, JM Barat, C Barry-Ryan. Trends Food Sci Technol 2007;18(7):373-86. [4] DA Kopsell, DE Kopsell. Trends Plant Sci 2006;11(10):499-507.
12º Encontro de Química dos Alimentos
110
Nutritional quality of commercial bakery products
manufactured in Portugal
Tânia Gonçalves Albuquerquea,b,*, M. Beatriz Oliveirab, Ana Sanches-Silvaa,c, Ana Cristina
Bentoa, Helena S. Costaa,b
a
Unidade de Investigação e Desenvolvimento, Departamento de Alimentação e Nutrição, Instituto Nacional de Saúde Doutor Ricardo Jorge, I.P., Lisboa, Portugal, b REQUIMTE/Faculdade de Farmácia
da Universidade do Porto, Porto, Portugal, c Centro de Estudos de Ciência Animal (CECA), Universidade do Porto, Porto, Portugal
* tania.albuquerque@insa.min-saude.pt
Keywords: bakery products; total fat; salt; nutritional quality
ABSTRACT
Bakery products are a wide group of ready-to-eat processed foods, highly consumed, especially by young people. These foods are generally considered as products of low nutritional quality, due to its high content in saturated fat, salt and sugar. The aim of this study was to evaluate the nutritional quality of thirty-one commercial bakery products available in the Portuguese market, considering its total fat and salt content. Moreover, for each product, commercial and supermarket brands were included in the study in order to assess a possible effect of price in the food nutritional quality.
To assure the representativeness of samples, the bakery products were randomly collected, in the major supermarket chains from the Portuguese market. Total fat determination was performed by acid hydrolysis followed by Soxhlet’s extraction with petroleum ether. The salt content was determined by Charpentier Volhard’s titration. Results of the present study are expressed as g/100 g of edible portion.
Our results showed that bakery products have high total fat contents, varying between 10.2 and 27.7 g/100 g of edible portion. With respect to salt content, the values ranged from 0.0463 to 2.07 g/100 g. Considerable differences in salt contents were found between commercial and supermarket brands.
In summary, this study confirms that bakery products commercialized in Portugal are important sources of fat and salt. Nevertheless, more studies are needed to cover a wider range of bakery products and other processed foods.
1.INTRODUCTION
Bakery products are a wide group of ready-to-eat processed foods, highly consumed, especially by young people. These foods are considered as products of poor nutritional quality, namely due to its high content in saturated fat, salt and sugar. In the past years, food
12º Encontro de Química dos Alimentos
111
industry has made efforts to develop food products that at the same time meet the consumers’ demand and contribute to a healthier diet. However, the information concerning their nutritional quality is usually scarce and incomplete.
The aim of this study was to evaluate the nutritional quality of thirty-one commercial bakery products available in the Portuguese market, considering its total fat and salt content. Moreover, commercial and supermarket brands for each product were included in the study in order to assess a possible effect of price in the nutritional quality of foods.
2.MATERIALS AND METHODS 2.1.Samples
The samples were selected based on production data and market availability, since up to now, as far as we know, no consumption data is available. Thirty-one samples (filled and unfilled sweet biscuits, sandwich biscuits, brioche with filling, filled croissants, salty snacks, wafers and crackers) of the most common industrial bakery products sold in Portugal were analyzed for their total fat and salt contents. In order to assure the samples representativeness, bakery products were collected randomly, in the major supermarkets chains from the Portuguese market.
At least 6 packages for each sample were randomly collected. Afterwards, three independent composite samples were homogenised in a blender (Grindomix, GM200, RETSCH, Germany) during approximately 1 min at 5000 rpm, in order to provide accurate data that covers possible variations among samples. The results (g/100 g of edible portion) are the average of three individual samples (n=3), each sample analysed in triplicate.
2.2.Salt
The salt content was quantified applying the Charpentier-Volhard’s titration method [1]. This method determines the salt content of foods based on the concentration of the chloride ion titrated with silver nitrate solution. Potassium thiocyanate (KSCN, 0.1 N) and silver nitrate (AgNO3, 0.1 N) were prepared in the laboratory. Sodium chloride was estimated from the
amount of chloride ion, as determined by the end-point of titration.
2.3.Total fat
Total fat determination was performed according to Albuquerque et al. [2], where an acid hydrolysis followed by extraction using a Soxhlet apparatus (Soxtec™ 2050, Auto Fat Extraction System, FOSS Analytical, Hilleroed, Denmark) with petroleum ether, as the extraction solvent was used. The obtained residue was dried for 1 h 30 min at 101 °C ± 2 °C, until constant weight.
3.RESULTS AND DISCUSSION 3.1.Salt
The total salt content varied between 0.0463 and 2.07 g/100 g of edible portion for brands 12 and 5, respectively (Figure 1). The obtained mean value was 0.705 ± 0.5 g/100 g of edible
12º Encontro de Química dos Alimentos
112
portion. WHO recommends a dietary intake lower than 5 g of salt per day for the general population, from all dietary sources, including additives such as monosodium glutamate and preservatives [3]. Most of the analysed bakery products in this study have low levels of salt, but about 19% of the analyzed products contain more than 1 g of salt/100 g.
0.0 0.5 1.0 1.5 2.0 2.5 1 2 3 4 5 6 7 8 9 10 11 12 13 14 15 16 17 18 19 20 21 22 23 24 25 26 27 28 29 30 31 S a lt (g/ 1 00 g of ed ib le p o rti on ) Samples
Figure 1. Total salt content of the thirty-one analysed bakery products.
3.2.Total fat
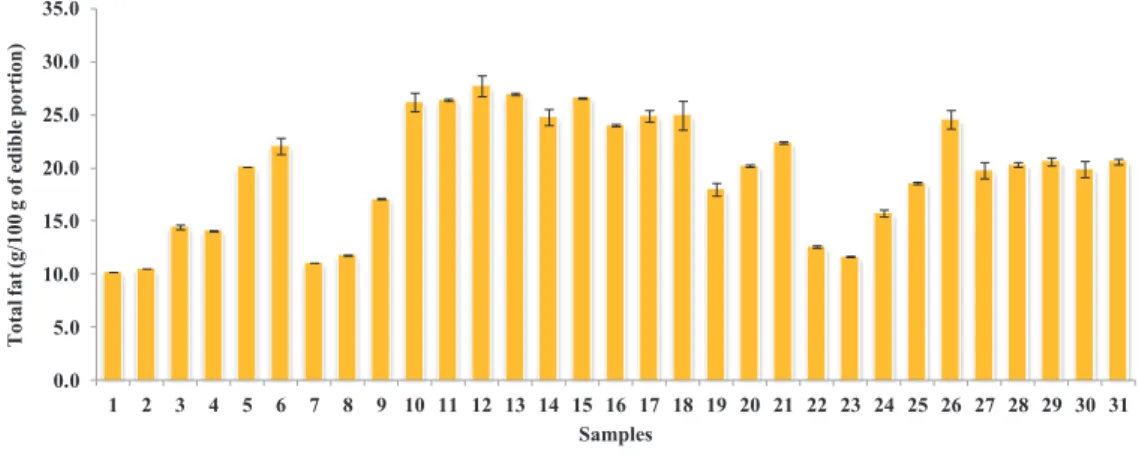
For most European countries, the current recommendation for total fat is a maximum intake value of 30-35% energy (E) per day [4]. Fat is an essential nutrient with several functions, such as, transport of fat-soluble vitamins and for supplying essential fatty acids, which are vital for the formation of signalling substances in the body, known as eicosanoids [5]. As it can be seen from Figure 2, some of the analysed bakery products are fatty dense foods, with a total fat content that varied between 10.2 ± 0.0 and 27.7 ± 1.0 g/100 g of edible portion.
0.0 5.0 10.0 15.0 20.0 25.0 30.0 35.0 1 2 3 4 5 6 7 8 9 10 11 12 13 14 15 16 17 18 19 20 21 22 23 24 25 26 27 28 29 30 31 To ta l fa t (g /1 00 g of e d ib le p o rt io n ) Samples
Figure 2. Total fat content of the thirty-one analysed bakery products.
3.3.Commercial vs. supermarket brands
According to the obtained results, the differences with respect to salt content between commercial and supermarket brands were more obvious than for total fat (Figure 3). In this study, the chosen products were separated in eight different food types. However,
12º Encontro de Química dos Alimentos
113
supermarket and commercial brands of bakery products were similar for each type. From the thirty-one analysed foods, it was only possible to compare sixteen of those due to the lack of supermarket and/or commercial products. For types 3 and 4 of the analysed bakery products, the supermarket brand has six times more salt content than the commercial brand. It is important to note that these brands had the lowest salt levels. On the other hand, for type 2, commercial brand presented 1.7 times more salt than the supermarket brand.
0.0 5.0 10.0 15.0 20.0 25.0 30.0 35.0 Commercial Supermarket Commercial Supermarket Commercial Supermarket Commercial Supermarket Commercial Supermarket Commercial Supermarket Commercial Supermarket Commercial Supermarket Ty p e 1 Typ e 2 Ty p e 3 Typ e 4 Typ e 5 Ty p e 6 Typ e 7 Ty p e 8
Total fat (g/100 g of edible portion)
0.0 0.5 1.0 1.5 2.0 Commercial Supermarket Commercial Supermarket Commercial Supermarket Commercial Supermarket Commercial Supermarket Commercial Supermarket Commercial Supermarket Commercial Supermarket Ty p e 1 Ty p e 2 Typ e 3 Typ e 4 Typ e 5 Ty p e 6 Ty p e 7 Ty p e 8
Salt (g/100 g of edible portion)
(A) (B)
Figure 3. Comparison of commercial and supermarket brands with respect to salt (A) and total fat (B) contents.
4.CONCLUSIONS
In summary, this study demonstrated that bakery products commercialized in Portugal are considerable sources of fat and salt. Since, these foods are highly appreciated, especially by young people, mainly due to the high fat, sugar and salt contents, more studies are needed to cover a wider range of bakery products and other processed foods. Further studies will also evaluate individual fatty acids and cholesterol contents.
Acknowledgements
This work was funded by National Institute of Health Dr. Ricardo Jorge, I.P., under the project PTranSALT - Avaliação de ácidos gordos trans, gordura saturada e sal em alimentos processados: estudo do panorama português (2012DAN828). Tânia Gonçalves Albuquerque is grateful for research grant (BRJ/DAN-2012) funded by National Institute of Health Dr. Ricardo Jorge, I.P.
References
[1] ISO (1970). Determination of chloride content R. 1841. International Standards Organisation. [2] TG Albuquerque, A Sanches-Silva, L Santos, HS Costa, Int J Food Sci Nutr, 2012, 63, 713-717. [3] World Health Organization, Mapping salt reduction initiatives in the WHO European Region, 2013. Available at: http://www.euro.who.int/__data/assets/pdf_file/0009/186462/Mapping-salt-reduction-initiatives-in-the-WHO-European-Region.pdf
[4] FAO Food and Agriculture Organization, FAO report of an expert consultation on fats and fatty acids in human nutrition, 2010, Rome, Edited by: Food and Agriculture Organization of the United Nations.
12º Encontro de Química dos Alimentos
12º Encontro de Química dos Alimentos
12º Encontro de Química dos Alimentos
12º Encontro de Química dos Alimentos
12º Encontro de Química dos Alimentos
138
Development and validation of a voltammetric biosensor
for the detection of a major peanut allergen in foodstuffs
Rita C. Alves a,b, Filipa Pimentel b, Henri P. A. Nouws a, Raquel C. B. Marques a,
M. Begoña González-García a, M. Beatriz P. P. Oliveira b, Cristina Delerue-Matos a
a
REQUIMTE, Instituto Superior de Engenharia do Porto, Instituto Politécnico do Porto, Porto, Portugal
b
REQUIMTE, Dep. Ciências Químicas, Faculdade de Farmácia, Universidade do Porto, Porto, Portugal.
*cmm@isep.ipp.pt
Keywords: Ara h 1; immunosensor; voltammetry; peanut; allergen ABSTRACT
A gold-nanostructured voltammetric immunosensor for Ara h 1 (a major peanut allergen) analysis was developed, validated, and used to detect its presence in food samples.
Gold nanoparticles were electrochemically deposited on the surface of screen-printed carbon electrodes. A sandwich immunoassay, using two monoclonal antibodies, in which the antibody-antigen interaction was detected through voltammetric stripping of enzymatically deposited silver (using alkaline phosphatase and silver ions) was developed.
The proposed immunosensor provided precise and accurate results and presented very low limits of detection and quantification (3.8 and 12.6 ng/ml, respectively). Moreover, it was able to detect very small amounts of Ara h 1 (0.1%) in a complex food matrix (cookies).
1.INTRODUCTION
Food allergies, which affect up to 10% of the general population, have been increasing in industrialized countries. These allergies arise mainly from an immunological hypersensitivity, usually against certain food proteins or glycoproteins (antigens), mediated by allergen-specific immunoglobulin E (IgE). Clinical manifestations include digestive disorders, respiratory symptoms, circulatory problems, skin injuries, and, in some cases, life-threatening reactions (anaphylactic shock). Food allergies are usually controlled by allergen avoidance (very small amounts of allergen, from less than 1 mg to some grams, can cause an allergic reaction in a sensitized person) or treatment of the symptoms [1,2].
In the European Union, Directive 2000/13/EC, as amended by Directives 2003/89/EC and 2007/68/EC, establishes a list of several food ingredients that must be indicated on the label of foodstuffs because they are likely to cause adverse reactions in susceptible individuals. For these individuals a correct and assertive labeling concerning the presence of potential allergens in foodstuffs is extremely important. However, cross-contamination during food processing or ingredients with "hidden" allergens can turn this into a difficult task. Therefore, food manufacturers usually decide to present a preventive label ("may contain traces of...") not only to protect sensitized individuals but also themselves. This reduces the available
12º Encontro de Química dos Alimentos
139
options of food for allergic consumers. Moreover, in a perspective of quality control and improvement of existing food safety systems (e.g. HACCP, ISO 22000:2005), the development of new methodologies (fast, reliable, accurate, and highly sensitive and selective) which are able to detect vestigial amounts of allergens in foods (complex matrices) is crucial [2].
Peanut (Arachis hypogaea) is one of the most allergenic foods. Ara h 1 (a major peanut allergen) is a seed storage protein, and is thermostable and resistant to digestion in the human gastrointestinal tract, being recognized by serum IgE from more than 90% of peanut-allergic patients. For these reasons, it is considered a suitable marker for the identification of peanut presence in food products and production lines [3].
In this work, a gold-nanostructured voltammetric immunosensor for Ara h detection and quantification was developed, validated, and used to analyze different food samples.
2.MATERIALS AND METHODS 2.1.Instrumentation and reagents
The electrochemical procedures were performed using an Autolab PGSTAT12 potentiostat-galvanostat from Metrohm Autolab controlled by GPES4.9 software (Metrohm Autolab). Screen-printed carbon electrodes (SPCEs) were purchased from DropSens. A Heraeus Fresco 17 Centrifuge (Thermo Fisher Scientific) was used for samples preparation.
Tris(hydroxymethyl)aminomethane (Tris), magnesium nitrate hexahydrate, hydrochloric acid, nitric acid, β-casein, 3-indoxyl phosphate disodium salt (3-IP), streptavidin-alkaline phosphatase (S-AP), and sodium chloride were all obtained from Sigma-Aldrich. Silver nitrate was purchased from Alfa Aesar and tetrachloroauric(III) acid was supplied by Merck. Mouse monoclonal anti-Ara h 1 IgG, biotinylated mouse monoclonal anti-Ara h 1 IgG and Ara h 1 were obtained from Indoor Biotechnologies. Skimmed milk (Nestlé) was bought in a local supermarket.
2.2.Samples and sample preparation
Cookies, chocolates and peanuts were bought in local supermarkets. Cookies containing increasing amounts of peanut (0.1, 0.3, and 1.5%) were prepared using the cookie matrix as base.
After homogenization, 1g of sample was extracted with 10 ml of Tris–HNO3 buffer (pH 8.2),
at 60ºC, during 30 min. For chocolate samples, 1 g of skimmed milk was added before extraction. Samples were subjected to subsequent centrifugation steps. An aliquot (40 μl) of the final supernatant was used for the immunosensing assay. Dilutions were performed when necessary.
12º Encontro de Química dos Alimentos
140
2.3. Sensor fabrication and immunoassay
In situ electrochemical deposition of gold nanoparticles (NPAus) on the SPCEs was
performed by applying a constant current intensity of -100 μA for 240 s, followed by the application of a potential of 0.1 V during 120 s [4]. The SPCE–NPAus working electrodes were coated with 10 µl of an anti-Ara h 1 antibody solution and left to incubate overnight at 4ºC. After incubation, the electrode was washed with 0.1 M Tris–HNO3 pH 7.2 buffer and
free surface sites were blocked with β-casein during 30 min. The analysis of Ara h 1 was achieved by incubating the immunosensors, after washing with 0.1 M Tris–HNO3 pH 7.2
buffer, with an Ara h 1 solution or a food sample extract for 60 min. Then, the biosensor was washed again with the 0.1 M Tris–HNO3 pH 7.2 buffer and incubated with a previously
prepared mixture of biotinylated monoclonal anti-Ara h 1 antibody and S-AP for 120 min. After rinsing, the enzymatic reaction was carried out by placing 40 µl of a solution containing 3-IP (1.0x10⁻³ M) and silver nitrate (4.0x10⁻⁴ M) on the immunosensor’s surface. In this step, AP hydrolyzes 3-IP resulting in a indoxyl intermediate that reduces the silver ions in solution resulting in metallic silver and "indigo blue". After a 20-min reaction, a linear sweep voltammogram was recorded from Ѹ0.02 V to +0.40 V, at a scan rate of 50 mV/s, to obtain the electrochemical oxidation current of the enzymatically deposited silver [5].
3.RESULTS AND DISCUSSION
In order to select the more effective concentrations of both capture and detection antibodies, different conditions were tested. First, for a fixed concentration of capture antibody, different dilutions of detection antibody were tested (1:500, 1:1000, 1:5000, 1:10000). The three first dilutions (1:500, 1:1000, 1:5000) resulted in higher peak current intensities, however, the respective blank signals were significantly higher (p<0.05) than those obtained with a 1:10000 dilution. Because low blank signals are analytically preferable, the 1:10000 solution was selected to proceed the studies. Subsequently, for this detection antibody dilution, different concentrations of capture antibody were tested (5, 10, 25, 50 and 100 µg/ml). The best results were obtained using 25 µg/ml: a significantly higher (p<0.05) peak current intensity in the presence of the allergen and, simultaneously, low blank signals.
Then, different formats were studied in order to reduce the steps and/or the total time of the immunoassay. For that, different combinations of immunoreagents as well as distinct incubation times were tested. The best results were achieved by combining detection antibody and S-AP 60 min before a 120-min incubation on the sensor surface.
The precision (intra- and inter-day) of the results obtained with the developed immunosensor were 2.9% and 8.7%, respectively. Linearity between peak current intensity and Ara h 1 concentration was established between 25 and 2000 ng/ml (y=(17.89±1.66)×[log C]-(24.34±1.81), r=0.997, n=4, where "y" is the peak current intensity in µA and "C" is the Ara h 1 concentration in ng/ml). The limits of detection and quantification were 3.8 ng/ml and 12.6 ng/ml, respectively.
12º Encontro de Química dos Alimentos
141
For recovery experiments, a cookie sample extract was spiked with four levels of known concentrations of Ara h 1 (50, 250, 500 and 1000 ng/ml). The obtained recoveries were 98.9, 98.7, 97.7, and 96.6%, respectively. In the absence of a reference material, pure peanut beans were extracted, in triplicate, and Ara h 1 protein was quantified. The found value of 12.76±1.65 mg/g (n=3) is in good agreement with the concentration of Ara h 1 in peanut described in the literature [6].
Spiked samples containing increasing amounts of peanut (0.1, 0.3, and 1.5%) were prepared using the cookie matrix as base. Results showed that even the lowest amount (0.1%) of peanut could easily be detected with this immunosensor. Ara h 1 presence was also evaluated in commercial chocolate samples with and without peanut (selected based on their label information). The chocolate sample without peanut gave a negative result (no significant differences (p>0.05) when compared to the blank assays). In the chocolate sample containing peanut as ingredient, 8.7 µg of Ara h 1/g of chocolate were detected.
4.CONCLUSION
A gold-nanostructured screen-printed carbon electrode was used to develop a two-monoclonal antibody sandwich-type immunosensor for Ara h 1 detection. Electrochemical detection was based on AP-catalyzed metal precipitation. Optimization of variables involved in the immunosensing strategy was performed, namely regarding the optimum concentrations of each antibody, the number of the steps to perform analysis, and the time of the assay. Validation parameters indicate that the proposed methodology provides accurate and precise results with a very low limit of detection (3.8 ng/ml). The immunosensor was successfully applied to Ara h 1 detection in complex food matrices, such as cookies and chocolate.
Acknowledgments
R.C. Alves is grateful to FCT for a post-doctoral research grant (SFRH/BPD/68883/2010), financed by POPH-QREN and subsidized by FSE and MCTES. This work received financial support from the European Union (FEDER funds through COMPETE) and National Funds (FCT) through project Pest-C/EQB/LA0006/2013, and from the European Union (FEDER funds) under the framework of QREN through Project NORTE-07-0124-FEDER-000069.
References
[1] MC Berin, S Sicherer, Curr Opin Immunol, 2011, 23, 794-800.
[2] RC Alves, MF Barroso, MB González-García, MBPP Oliveira, C Delerue-Matos, Crit Rev Food Sci Nutr, in press
[3] M Chruszcz, SJ Maleki, KA Majorek, M Demas, M Bublin, R Solberg, BK Hurlburt, S Ruan, CP Mattison, H Breiteneder, W Minor, J Biol Chem, 2011, 268, 39318-39327.
[4] G Martínez-Paredes, MB González-García, A Costa-García, Electrochim Acta, 2009, 54, 4801-4808.
[5] P Fanjul-Bolado, D Hernández-Santos, MB González-García, A Costa-García, Anal Chem, 2007, 79, 5272-5277.
12º Encontro de Química dos Alimentos
225
Nutritional profile of edible marine macroalgae: macronutrients
Catarina Costa a,b, Filipa Pimentel b, Rita C. Alves b,c, Anabela Costa b,
Arminda Alves a, M. Beatriz P. P. Oliveira b,*
a
LEPAE, Dep. Chemical Engineering, Faculty of Engineering, University of Porto, Porto, Portugal.
b
REQUIMTE, Dep. Chemical Sciences, Faculty of Pharmacy, University of Porto, Porto, Portugal.
c
REQUIMTE, School of Engineering, Polytechnic Institute of Porto, Porto, Portugal. *beatoliv@ff.up.pt
Keywords:Macroalgae; sustainability; nutritional profile.
ABSTRACT
In this study, the nutritional profile of widely consumed species of seaweed (commercially available in the Portuguese market) was evaluated. Three brown macroalgae, Undaria
pinnatifida (Wakame), Laminaria japonica (Kombu) and Hizikia fusiforme (Hijiki), and three
red ones, Palmaria palmata (Dulse), Porphyra tenera (Nori) and Eisenia bicyclis (Arame), from different geographical origins (Japan and Galiza, Spain) were analysed. The chemical analyses were performed to determine moisture, ash, protein, fat and carbohydrate contents. The algae samples are commercialized dry, therefore, the moisture content was very low (~10%). The ash content was around 17-38% in brown algae and 10-17% in red algae. Protein levels ranged from 6 to 33%. The highest levels were found in red species, especially in
Porphyra tenera. The fat content was less than 1%. The carbohydrate content, which includes
the dietary fibre, ranged from 38 to 69%. The results of this work show that the analysed macroalgae can be interesting alternative sources of protein, minerals, and, eventually, fibre. Further studies are being conducted in order to better characterize these species in what concerns to their chemical composition and potential health effects.
1. INTRODUCTION
Water covers about 70% of Earth's surface. The oceans are a source of biological diversity, being the habitat of thousands of plants, animals and different types of microorganisms that contribute for about 50% of the global biodiversity [1]. Marine biodiversity represents, indeed, an exceptional source of natural resources. Their use in a sustainable way may ensure alternative food sources for human consumption, which scarcity is being anticipated.
Macroalgae, also known as seaweed, are an outstanding example of this biodiversity and an excellent source of a wide number of chemical compounds with beneficial health effects [2]. According to their pigmentation, they can be distinguished in green (Chlorophytaea), brown (Phaeophytaea) and red (Rhodophytaea), showing significant differences in nutritional and chemical compositions [3]. Some macroalgae are widely used as food ingredients in oriental
12º Encontro de Química dos Alimentos
226
countries, as good sources of fibre and protein [4]. They are also considered nutraceuticals, with several health benefits described in literature, such as anti-inflammatory, anti-allergic, antimutagenic, antitumor, antidiabetic, antihypertensive, and neuroprotective [2,5]. For these reasons, macroalgae are a very attractive material for food, pharmaceutical and cosmetic industries.
The aim of this study was to analyse the nutritional profile of 6 widely consumed species of macroalgae (3 brown and 3 red), from different geographical origins (Japan and Galiza, Spain), commercially available in the Portuguese market.
2. MATERIALS AND METHODS 2.2.. Chemicals
Sulphuric acid, sodium hydroxide, boric acid, Kjeldahl tablets and anhydrous sodium sulphate were of analytical grade from Merck (Darmstadt, Germany). Petroleum ether was of analytical grade from Sigma (ST Louis, MO, USA).
2.3. Samples and sample preparation
Dried seaweeds were purchased in specialty shops in Porto. For analysis, all samples were ground (Grindomix GM 200, Retsch, Haan, Germany) and homogenized. Samples were properly placed in sample containers until analyses.
2.4. Moisture
Moisture determination was performed using a moisture analyser (Scaltec SMO 01, Scaltec Instruments, Germany), at 105 ºC.
2.5. Ash contents
The ash content was determined according to AOAC 950.153 [6], by placing ground samples in a muffle furnace (Thermolyne 48000, Electrothermal Engineering Ltd, Essex, United Kingdom) at 500 ºC for 24 h.
2.6.. Protein contents
Total protein content was determined by the Kjeldahl method (AOAC 928.08) [6]. Approximately 0.5 g of seaweed were digested in an Automatic Digestor K-438 (Büchi®, Büchi Labortechnik AG, Switzerland) for 2 hours with concentrated sulphuric acid and two Kjeldahl catalyst tablets. After digestion, the distillation was performed using a Kjeldahl Distilling Unit K-360 (Büchi®, Büchi Labortechnik AG, Switzerland). The boric acid solution receiving the distilled ammonia changed colour from red to green. After that, the solution was titrated against standard sulphuric acid until yellowish end point. The conversion factor used was 6.25.
12º Encontro de Química dos Alimentos
227
2.7. Total lipid contents
The lipid content was determined using the Soxhlet method (AOAC 991.36) [6]. Approximately 5 g of sample was homogenized with anhydrous sodium sulphate. Lipids were extracted with petroleum ether 40 - 60 ºC for 8 hours.
2.8. Total carbohydrate contents
The carbohydrates were calculated indirectly according to the following equation: % total carbohydrates = 100% - (% moisture + % ash + % protein + % lipids)
3. RESULTS AND DISCUSSION
The algae samples are commercialized dry so the moisture content was very low, around 10% (Table 1). The ash content, which includes the mineral fraction, varied from 17 to 38% in brown algae and 10 to 17% in red ones.
Table 1. Moisture, ash, protein, lipids and total carbohydrates contents of some
edible seaweeds (contents are expressed in %).
Samples Moisture Ash Protein Lipids Carbohydrate
L. japonica g 10.57 ± 0.40 31.00 ± 0.26 5.82 ± 0.04 0.47 ± 0.00 52.14 ± 0.62 L. japonica j 14.00 ± 0.15 23.98 ± 0.05 9.32 ± 0.04 0.80 ± 0.02 51.91 ± 0.23 U. pinnatifida g 9.89 ± 0.83 37.92 ± 0.55 13.56 ± 0.04 0.85 ± 0.06 37.78 ± 0.27 U. pinnatifida j 12.12 ± 0.26 30.43 ± 0.25 12.74 ± 0.05 0.49 ± 0.04 44.22 ± 0.09 H. fusiforme j1 12.96 ± 0.30 17.08 ± 0.13 7.95 ± 0.01 0.60 ± 0.06 61.42 ± 0.12 H. fusiforme j2 9.82 ± 0.29 17.97 ± 0.13 8.69 ± 0.06 0.31 ± 0.03 63.21 ± 0.13 P. tenera g 12.78 ± 0.68 9.51 ± 0.02 29.90 ± 0.01 0.22 ± 0.01 47.60 ± 0.66 P. tenera j 6.80 ± 0.67 10.33 ± 0.21 33.33 ± 0.07 0.47 ± 0.00 49.07 ± 0.52 E. arborea j 9.18 ± 0.64 11.80 ± 0.08 9.53 ± 0.00 0.39 ± 0.00 69.10 ± 0.57 E. bicyclis j 7.98 ± 0.05 12.18 ± 0.02 12.12 ± 0.09 0.56 ± 0.03 67.16 ± 0.00 P. palmata g 10.78 ± 0.38 17.06 ± 0.02 17.70 ± 0.03 0.11 ± 0.00 54.35 ± 0.39
Mean values of triplicate determinations ± standard deviations. g, algae from Galiza; j, algae from Japan.
Protein levels ranged from 6 to 33% and the highest content was found in red species, especially in Porphyra tenera. The fat content was less than 1% in all species (0.11-0.85). The carbohydrate content, which includes the dietary fibre, varied between 38-69%, as shown in Table 1. These preliminary results show that the analysed macroalgae can be interesting and alternative sources of protein, minerals, and, eventually, fibre.
12º Encontro de Química dos Alimentos
228
4. CONCLUSION
In western countries, the use of seaweeds for human consumption is not part of traditional food habits. With globalization its consumption has been increasing. Moreover, deficient nutrition, mainly in underdeveloped countries, drives research on cheaper plant sources, with balanced macronutrients profile and with potential health benefits.
The results of this study show that the analysed macroalgae can be interesting alternative protein (especially Porphyra tenera) and minerals sources (essentially Laminaria japonica), and, eventually, also of fibre. All the samples are poor sources of fat.
Further studies are being conducted in order to better characterize these and other species in what concerns their chemical composition and potential health effects.
Acknowledgments
R.C. Alves is grateful to FCT for a post-doctoral research grant (SFRH/BPD/68883/2010), financed by POPH-QREN and subsidized by FSE and MCTES. This work received financial support from the European Union (FEDER funds through COMPETE) and National Funds (FCT) through project Pest-C/EQB/LA0006/2013. The work also received financial support from the European Union (FEDER funds) under the framework of QREN through Project NORTE-07-0124-FEDER-000069.
References
[1] C Dawczynski, R Schubert, G Jahreis, Food Chem, 2011, 103: 891-899. [2] SL Holdt, S Kraan, J Appl Phycol, 2011, 23, 543-597.
[3] L Pereira, Guia Ilustrado das Macroalgas, 1ª ed., 2009, Imprensa da Universidade de Coimbra: Portugal.
[4] I Wijesekara, R Pangestuti, SK Kim, Carbohydr Polym, 2011, 84, 14-21.
[5] PB Andrade, M Barbosa, RP Matos, G Lopes, J Vinholes, T Mouga, P Valentão, Food Chem, 2013, 138, 1819-1828.
[6] AOAC, Official methods of analysis of Association Of Analytical Chemistry, 17ª ed., 2000, AOAC International, Maryland, EUA.