Article
*e-mail: [email protected]
Pesticide Residue Determination in Groundwater using Solid-Phase Extraction and
High-Performance Liquid Chromatography with Diode Array Detector and Liquid
Chromatography-Tandem Mass Spectrometry
Sergiane S. Caldas, Adriana Demoliner, Fabiane P. Costa, Marcelo G. M. D’Oca and Ednei G. Primel*
Post-graduation Program in Technological and Environmental Chemistry, Escola de Química e Alimentos, Universidade Federal do Rio Grande - FURG, Av Itália, km 8 s/n,
96201-900 Rio Grande-RS, Brazil
Resíduos de quatro agrotóxicos foram determinados durante um ano em águas de poços de uma área agrícola no Sul do Brasil. Os métodos para a separação, identiicação e quantiicação dos compostos incluíram cromatograia líquida de alta eiciência com detecção por arranjo de diodos (HPLC-DAD) e cromatograia líquida acoplada à espectrometria de massas (LC-ESI-MS/MS). Uma etapa de pré-concentração baseada na extração em fase sólida com cartuchos de 200 mg de C18 foi realizada. Todos os parâmetros analíticos icaram de acordo com os limites sugeridos para a validação de métodos cromatográicos. Os limites de quantiicação para o método, considerando um fator de pré-concentração de 250 vezes, foram 0,2 µg L-1 para todos os analitos por HPLC-DAD, 4,0 ng L-1 para o clomazona, carbofurano e tebuconazol e 40,0 ng L-1 para o 2,4-D por LC-ESI-MS/MS. Nas amostras de águas subterrâneas, o 2,4-D não foi detectado e o carbofurano, clomazona e tebuconazol apresentaram concentrações que variaram entre 0,25 e 10,40 µg L-1, 0,20 e 0,82 µg L-1, e 0,20 e 4,16 µg L-1, respectivamente. Os métodos mostraram-se adequados para a determinação de agrotóxicos em águas subterrâneas.
Residues of four pesticides in groundwaters were surveyed during one year in an agricultural area in southern Brazil. The methods for separation, identiication and quantiication of the compounds included high-performance liquid chromatography with diode array detection (HPLC-DAD) and liquid chromatography with electrospray interface tandem mass spectrometry (LC-ESI-MS/MS). A pre-concentration step based on solid-phase extraction with 200 mg C18 cartridges was applied. All the analytical parameters were within the limits suggested for the validation of chromatographic methods. The LOQs for the methods, considering the 250-fold pre-concentration step, were 0.2 µg L-1 for all pesticides by HPLC-DAD, 4.0 ng L-1 for clomazone, carbofuran and tebuconazole and 40.0 ng L-1 for 2,4-D by LC-ESI-MS/MS. In groundwater samples, 2,4-D was not detected, and carbofuran, clomazone and tebuconazole were detected in concentrations ranging from 0.25 to 10.40 µg L-1, from 0.20 to 0.82 µg L-1 and from 0.20 to 4.16 µg L-1, respectively. The methods proved to be adequate for the analysis of pesticides in groundwaters.
Keywords: groundwaters, pesticides, HPLC-DAD, SPE, LC-MS/MS
Introduction
Water contamination by pesticides has been an important topic of study over the last few years. In Brazil, there are some studies that report the presence of pesticides
in surface water.1,2 However, these compounds, in particular
the most polar ones, through processes of run-off, spray drift and leaching, can easily reach surface waters and
possibly contaminate groundwater.3 In some areas in
Brazil, where pesticides are widely used, mainly due to agricultural activities, some pesticides have been found in
groundwater.4,5
one of the major classes of synthetic organic pesticides and are used annually on a large scale worldwide. They are usually distributed in aqueous environments because
of their high solubility in water.6 The acidic herbicide
2,4-D has poor biodegradability and has frequently been detected in water courses; it is widely used in southern
Brazil due to its low cost and good selectivity.7,8 The class
of triazoles includes many of the most modern agricultural fungicides such as tebuconazole. Most of these triazole fungicides are used against rust, powdery mildews and
scabs.9 The herbicide clomazone, which belongs to the
class isoxazolidinone is particularly used against species of annual broadleaf weeds and grass. It is highly soluble in
water and has potential for groundwater contamination.10,11
In Brazil, Resolution No. 396 (http://www.mma.gov. br/port/conama/legiabre.cfm?codlegi=562, 2008), issued by the National Council of Environment (CONAMA), establishes the concentration accepted for each individual pesticide in groundwater intended for domestic supply. The Brazilian legislation does not include the pesticides clomazone and tebuconazole; for 2,4-D, the maximum
value accepted is 30 µg L-1 and for carbofuran, it is 7 µg L-1.
Determination of pesticides in environmental waters can only be evaluated by sensitive methods and such work requires methods for detecting and identifying the
compounds with the fewest number of steps.12-14 The ideal
sample preparation methodology should be fast, accurate and precise, besides, it should consume little solvent. Solid-phase extraction (SPE) is a good alternative to prepare samples for chromatographic analysis, owing to its simplicity and economy in terms of time and solvent needs, and it offers the possibility of reducing sample volume without loss of
sensitivity and minimizing sample manipulation.13,15 In the
isolation and pre-concentration of pesticides from aqueous samples, before the liquid chromatography (LC) analysis, the most used sorbents in SPE are C18-bonded silicas and
styrene–divinylbenzene co-polymers.14,16-18
For the analyses of pesticide residues in water samples, LC combined with diode array detection (DAD), has
been used.19-21 The last is a complementary method which
supplies the spectra of the compound, thus, providing an
additional way to conirm the peak identity.12 However,
other techniques, such as the liquid chromatography coupled to mass spectrometry (MS), combine the advantages of chromatography (high selectivity and separation eficiency) and mass spectrometry (structural information and further increase in selectivity), while being
relatively straightforward to accomplish.22,23
LC-MS is specially powerful for the direct analyses of polar compounds which are subject to thermal decomposition or do not have adequate vapor pressure
for GC separations.24 Based on the type of interface,
LC-MS is also capable of providing structural information
to conirm the identiication of analytes in a sample.25 The
mass spectrometer can isolate a selected ion from the target compound and induce its fragmentation by collision and, for this reason, can eliminate any potential interference from the sample matrix, and also from mobile and
stationary phases.13 LC-MS is currently used for analysis
of polar pesticides, including carbamates, triazines and chlorinated phenoxyacids, providing adequate detection
limits for residue analysis.26-29
The aim of this study was to develop and validate a fast, sensitive and reliable method combining SPE with C18-bonded silica, followed by HPLC-DAD and LC–MS/MS with eletrospray (ESI) interface and its application for the analysis of carbofuran, 2,4-D, clomazone and tebuconazole residues in groundwater samples. The proposed methodology was applied to the determination of these pesticides in 120 samples collected in ten wells in Quitéria, located in Rio Grande, RS, Brazil. This region was selected because of the special characteristics of its agricultural production. Pesticides of different classes are widely used and some of them, due to their physical-chemical properties, can reach groundwater systems which are used for human consumption. For this reason, there is special interest in developing and evaluating analytical methods for this analysis.
Experimental
Reagents and chemicals
Carbofuran, clomazone, tebuconazole and 2,4-D analytical standards (purity > 99%) were supplied by Sigma Aldrich (São Paulo, Brazil). HPLC grade methanol and acetonitrile were supplied by Mallinckrodt (Phillisburg, NJ, USA). Formic (98-100%) and phosphoric acid (85%) analytical grade were purchased from Merck (Darmstadt, Germany). Water was
puriied with a Direct-Q UV3® (resistivity 18.2 M
Ω cm)
water puriication system (Millipore, Bedford, MA, USA). The SPE extraction cartridges were octadecylsilane (Strata C18-E) with 200 mg of phase, manufactured by Phenomenex (Torrance, CA, USA).
Individual pesticide stock solutions containing
1000 µg mL-1 of the target compounds were prepared in
methanol and stored at −18 °C. Intermediate working
standard mixtures in methanol, containing 100 µg mL-1 for
SPE procedure
The isolation of the target organic compounds from water samples was performed using a SPE procedure. Water samples, without any iltration, were extracted by solid-phase extraction using cartridges with 200 mg of C18-E whose average particle size is 55 µm. Cartridges were conditioned with 3 mL of methanol, 3 mL of ultrapure water and 3 mL of ultrapure water pH 3.0, acidiied with phosphoric acid 1:1 (v/v). After the conditioning step, aliquots of 250 mL of water samples, acidiied at pH 3.0 with phosphoric acid (to increase the pesticide retention) were loaded through the cartridges with
a low rate of 6 mL min-1. After that, the analytes were eluted
with 1 mL (2 × 500 µL) methanol, volume adjusted in 1 mL and injected into the chromatographic system. This extraction procedure had been previously developed and optimized in
our laboratory.30 Phosphoric acid was used because of its low
absorption at wavelengths below 220 nm; these were used in HPLC-DAD to determine the compounds in the well samples.
Sampling
The studies of groundwater contamination with pesticides were carried out in Quitéria, a rural area located near Rio Grande, a city in the southeast of Brazil that has about 185,000 inhabitants. The region of Quitéria is an agricultural area where there are different kinds of production, mainly onion, fruits and vegetables in general. The intense agricultural production, and consequently the use of pesticides, can cause the contamination of groundwaters.
Samples from drinking water wells with depths ranging from 2.5 up to 37 m were collected in ten sampling points from September 2007 to August 2008, and analyzed to determine the concentration of carbofuran, 2,4-D, clomazone and tebuconazole. Sampling was carried out
once per month in each well.
Samples were collected directly in 1 L amber glass bottles in each sampling site. These bottles had been cleaned prior to sampling by rinsing them three times
in the water to be sampled. The bottle was illed to the top with as little remaining air as possible, and sealed tightly. All samples were properly labeled with details of the source and sampling date, and stored at 4 °C until solid-phase extraction, which was carried out on the same day of sampling.
The samples were acidiied to pH 3.0 with phosphoric acid. After extraction of pesticide residues from water, solid-phase extraction, pesticides were determined by LC-ESI-MS/MS.
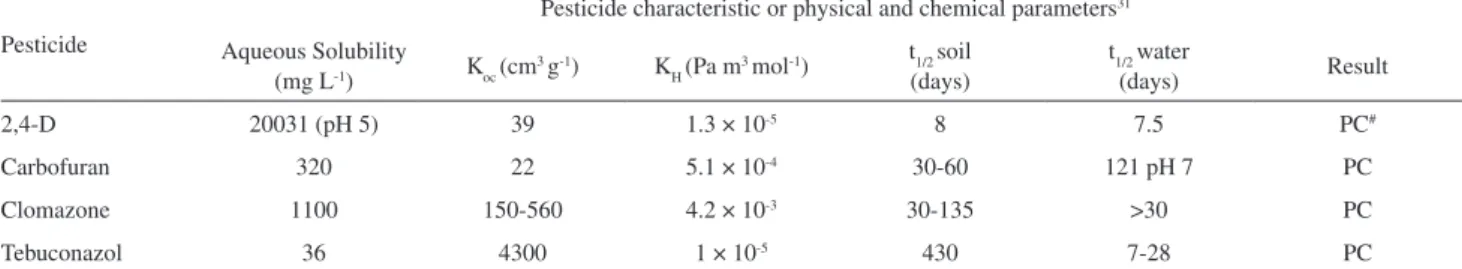
The selection of the analytes included in this study was based on their extensive use as pesticides in agricultural areas. Moreover, these pesticides are some of the mostly used pesticides in the study area; according to the US Environmental Protection Agency (US EPA) they have potential to reach the groundwater systems (Table 1).
Chromatographic methods
HPLC-DAD
HPLC-DAD separation was performed using an HPLC apparatus consisting of a column Hyperclone BDS C18 5 µm 130Å (250 × 4.6 mm i.d.), from Phenomenex, a Waters 600 pump model, associated with a Waters 2996 Photodiode Array Detector, Rheodyne 20 µL loop injector, connected to an Empower PDA software for data acquisition. The UV spectra were recorded in the 210-400 nm range.
For HPLC-DAD analysis, the mobile phase composition was acetonitrile:water (52:48, v/v), pH 3.0 acidiied with
H3PO4 1:1 (v/v), using a low rate program of 0.8 mL min-1
for 8 min, increasing to 1.2 mL min-1 until the 14th min and
then 0.8 mL min-1 until the 15th min. The mobile phases
were degassed for 30 min in an ultrasonic bath before use. The analyses by HPLC-DAD were based on the method
described in Caldas et al.30
LC-ESI-MS/MS
Liquid chromatography with mass spectrometric detection was performed in a Waters Alliance 2695
Table 1. Risk assessment of groundwater pollution, based on criteria established by the U.S. EPA
Pesticide
Pesticide characteristic or physical and chemical parameters31
Aqueous Solubility
(mg L-1) Koc (cm3 g-1) KH (Pa m3 mol-1)
t1/2 soil (days)
t1/2 water
(days) Result
2,4-D 20031 (pH 5) 39 1.3 × 10⁻⁵ 8 7.5 PC#
Carbofuran 320 22 5.1 × 10⁻⁴ 30-60 121 pH 7 PC
Clomazone 1100 150-560 4.2 × 10⁻³ 30-135 >30 PC
Tebuconazol 36 4300 1 × 10⁻⁵ 430 7-28 PC
#PC = probable contaminant of groundwaters. K
Separations Module itted with an autosampler, a membrane degasser and a quaternary pump. Mass spectrometry was performed on a Micromass Quattro Micro API with an ESI interface. The LC separation was carried out in an XTerra analytical column (50 × 3 mm, i.d. 3.5 µm) (Waters, Milford, MA, USA). Analytical instrument control, data acquisition and treatment were performed by software Masslynx version 4.1, 2005 (Waters, Milford, MA, USA).
A sample volume of 20 µL was injected by an autosampler. The mobile phase was acetonitrile:water (52:48, v/v), acidiied with 0.1% formic acid at a constant
flow of 0.4 mL min-1. Parameters were optimized by
continuous infusion of a standard solution (1000 µg L−1)
via a syringe pump at 10 µL min−1 low rate. Ionization
of the compounds was studied by using ESI interface in the positive (PI) and negative (NI) ionization modes. The mass spectrometer was operated in scan, product ion scan and MRM (multiple reaction monitoring) modes. Typical interface conditions were optimized for maximum intensity of the precursor ions as follows: capillary voltage 3.5 kV; nebulizer and desolvation (drying gas) lows were set at 350
and 150 L h-1, respectively; source block and desolvation
temperatures were 120 and 350 ºC, respectively. Nitrogen was used as nebulizing, desolvation and cone gas, and argon was used as collision gas.
Analytical parameters
The validation of the HPLC-DAD procedure had been
previously validated and published by Caldas et al.30
The performance characteristics of the method for LC-ESI-MS/MS were established by validation procedure and use of standard solutions and spiked samples. Linearity, precision, accuracy (recovery), limits of detection and quantiication were evaluated. The linearity was evaluated by using various concentrations of pesticides ranging from
1 to 1000 µg L-1 for LC-ESI-MS/MS, with three replicate
injections per concentration. The linearity was assessed by
linear regression equation (y = ax + b). The results did not show a signiicant deviation from linearity, which means a correlation coeficient of r > 0.99.
In this study, LOD and LOQ were determined considering the LOD 3 times the baseline noise and the LOQ the concentration that produced a signal 10 times greater than the baseline noise, in a period close to the
retention time of the analyte.32 The precision of the
method was evaluated in terms of repeatability (RSDr) and expressed as relative standard deviation (RSD). The precision in terms of repeatability was obtained by carrying out the extraction and analysis of fortiied samples in three
different levels (0.004, 0.04 and 2.0 µg L-1), considering the
250-fold SPE preconcentration step. Each spike level was extracted in three replicates and injected three times. The precision of the method, in terms of repeatability (RSDr), was measured by comparing the standard deviations of the responses after nine injections. The accuracy of the method was investigated through mean recoveries. Recovery was determined by adding known amounts of the reference substance at the beginning of the process. Water samples spiked with all pesticides were extracted by applying the SPE method described above. Analyses were carried out in three replicates of blank water samples spiked at three levels for LC-ESI-MS/MS. The accuracy of the method must be in the range 70-120% at all concentrations with
RSD < 20%.33
Results and Discussion
Chromatographic analysis
HPLC-DAD
The choice of a proper detection mode is crucial to ensure that all components are detected. With DAD, this problem can be overcome by using a multiple wavelength scanning program, which is capable of monitoring several wavelengths simultaneously. It ensures that all UV-Vis absorbing components are detected. DAD is used to record spectra of compounds from 190 to 400 nm, simultaneously. Analytes identification was accomplished comparing analytes retention times and UV spectra of the standard and detected peak of the sample. Quantiication was performed by external calibration and carried out with DAD detection at 220.3 nm. In this wavelength, all compounds present good sensitivity.
The purity of the peaks can be veriied in all samples. This can be done by overlapping the spectra of the same peak taken off halfway up the rising side of each peak, at the top of each peak, and halfway down the trailing edge of each peak. If the peak is pure, the overlapped spectra will remain constant throughout the elution of the entire peak. The main problem of the analysis of water samples using HPLC-DAD is the presence of organic substances, mainly humic and fulvic acids, but it does not interfere in the qualitative and quantitative analysis of the pesticides. The injection of a standard mixture solution prepared in methanol, in a mobile phase based on acetonitrile-ultrapure water, afforded good chromatographic separation for all analytes in 15 min.
LC-ESI-MS/MS
A mobile phase consisting of acetonitrile and ultrapure water permitted the analysis of all analytes in 3 min. In order to obtain good and reproducible retention times for pesticides and, and for the analysis of acidic compounds,
acidiication of the mobile phase is recommended.34 Formic
acid proved to be eficient for ionizing the compounds in question. Under these conditions, a full scan showed that all peaks were resolved.
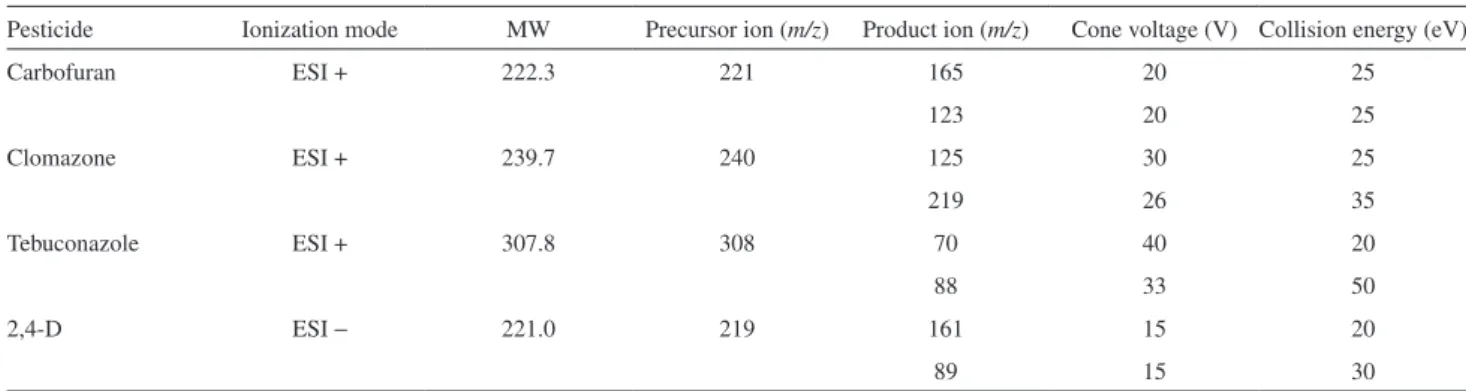
The chromatograms were recorded in full scan mode with the ESI interface in the positive and negative ionization
mode. The scan range was m/z 100-350. The results are
shown in Table 2. Three selected pesticides (clomazone, tebuconazole and carbofuran) showed more efficient ionization in the PI mode, whereas only 2,4-D showed preferential ionization in the NI mode. The cone voltage was also optimized because it was considered to be the parameter with the greatest effect on signal sensitivity that could provide information concerning the fragmentation of the compounds under analysis.
To carry out the analysis of all compounds in a single run, the electrospray interface was programmed to change the mode of operation between NI and PI, along the chromatographic analysis. The change of polarity during the acquisition method was performed without any damage in the intensity of the peaks observed.
The advantages supplied by the LC system were strengthened with its coupling to triple quadrupole instruments (QqQ) operating in multiple reaction monitoring mode (MRM). It allowed us to achieve the best sensitivity for the targeted compounds. Moreover, QqQ instruments exhibit excellent quantiication abilities owing to their wide
linear dynamic range.25 The MRM analysis introduces high
speciicity as it is based on the detection of both a parent ion and one of its known fragments. For each compound, we selected the optimum collision energies with the aim of getting two characteristic MRM transitions with the best signal intensity. We chose the MRM transition with the best
signal intensity for quantiication. The main advantage of the method was the use of MS/MS because it provides a high level of certainty to identify the target compounds.
Analytical parameters
The method validation of SPE and HPLC-DAD was
published in Caldas et al.30 The method using SPE and
HPLC-DAD allows a limit of quantiication 0.2 µg L−1, for
the compounds assayed, considering a pre-concentration step of 250-fold. With these limits of detection the HPLC-DAD method could be applied to the analysis of groundwaters since current legislation stipulates a
maximum value of 30 µg L−1 for 2,4-D, and 7 µg L-1
for carbofuran in groundwaters intended for human consumption. The other compounds under investigation
are not included in the legislation.35
Using LC-ESI-MS/MS, the LOQs were 4.0 ng L-1 for
carbofuran, clomazone and tebuconazole and 40.0 ng L-1 for
2,4-D, considering a 250-fold SPE pre-concentration step. It was veriied that the obtained LOD and LOQ values were lower for LC-ESI-MS/MS, because of the good sensitivity detection that this ionization mode provides to the polar compounds. Another observable difference was that the matrix effect was more pronounced in HPLC-DAD, while this interference was not observed in LC-ESI-MS/MS.
The low LOQs achieved are an important characteristic of this method because they are close to those required for drinking water, and the groundwater analyzed in this study is intended for direct human consumption. The method guarantees the determination of the pesticides below the maximum concentration established by the Brazilian legislation and the European Union for pesticides in drinking water samples.
All compounds presented excellent linearity within the studied concentration range, from instrumental LOQ values
of each compound up to a concentration of 1000 µg L-1 for
Table 2. Results of the mass spectrometer conditions for the simultaneous analysis of pesticides (dwell time 0.3 s)
Pesticide Ionization mode MW Precursor ion (m/z) Product ion (m/z) Cone voltage (V) Collision energy (eV)
Carbofuran ESI + 222.3 221 165 20 25
123 20 25
Clomazone ESI + 239.7 240 125 30 25
219 26 35
Tebuconazole ESI + 307.8 308 70 40 20
88 33 50
2,4-D ESI − 221.0 219 161 15 20
89 15 30
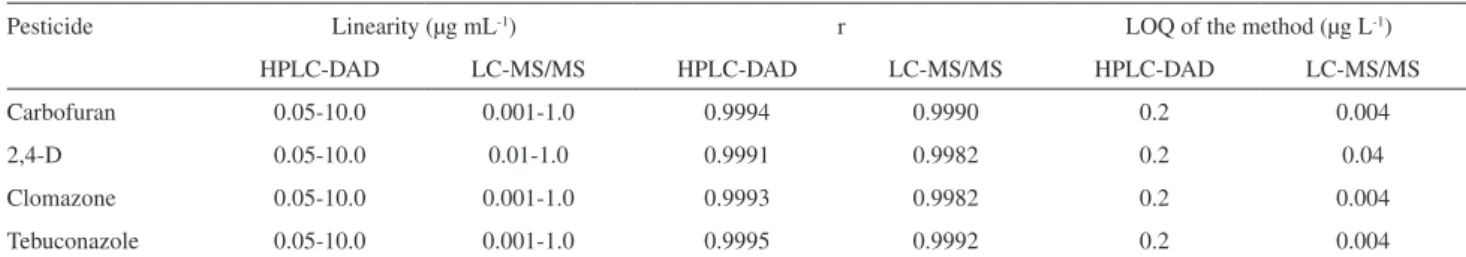
all pesticides. The calibration curves were linear over the whole concentration range tested for all pesticides under study with correlation coeficients (r) better than 0.998 as outlined in Table 3. The precision (repeatability) and the accuracy (recovery), obtained by analyzing in triplicate natural water samples spiked at three different levels for all pesticides under study, are outlined in Table 4. The precision obtained for the overall procedure was similar for both methods SPE and HPLC-DAD, and SPE and LC-ESI-MS/MS; remaining lower than 20%. Precision may have been mainly governed by the SPE step carried out prior to the chromatographic analysis. The recovery values of all compounds, for both methods, varied from 60.3 up to 108.9%. The values found are considered acceptable for chromatographic methods applied to pesticide residue
determinations.33
The proposed HPLC-DAD method allowed the analysis of these compounds in less than 15 min. But, with the use of a more selective detector, such as the MS, the time necessary for chromatographic separation is minimized, with less demand on peak resolution. Thus, the LC-ESI-MS/MS permitted the
analysis of all analytes under study in 3 min. The inluence of the sample matrix was most pronounced in the analyses made by the HPLC-DAD method, with disturbances in base line and background noise. In the LC-ESI-MS/MS method, quantiication in the MRM mode solves this problem and the limits of quantiication are lower than in HPLC-DAD. So, because of the advantages of the LC-ESI-MS/MS, such as velocity, lower solvent consumption, sensitivity and selectivity, the method using SPE and LC-ESI-MS/MS was chosen for groundwater samples analysis.
Environmental water analysis
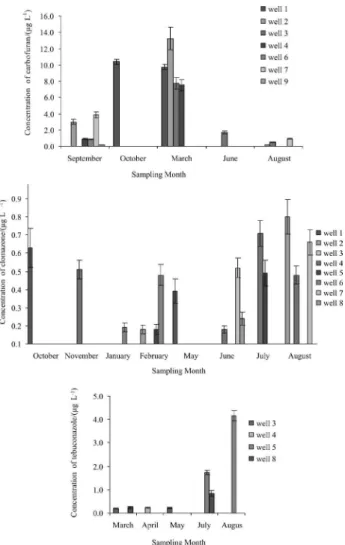
The whole analytical procedure using SPE combined with LC-ESI-MS/MS was applied for determining trace pesticide residues in well water samples taken from ten different wells sites in Quitéria. Quantiication was performed by external calibration. Figure 1 show the pesticide levels detected at each location in several sampling campaigns, carried out from September 2007 until August 2008. Results are not surprising at all, since the agricultural
Table 3. Analytical characteristics of methods HPLC-DAD and LC-ESI-MS/MS
Pesticide Linearity (µg mL-1) r LOQ of the method (µg L-1)
HPLC-DAD LC-MS/MS HPLC-DAD LC-MS/MS HPLC-DAD LC-MS/MS
Carbofuran 0.05-10.0 0.001-1.0 0.9994 0.9990 0.2 0.004
2,4-D 0.05-10.0 0.01-1.0 0.9991 0.9982 0.2 0.04
Clomazone 0.05-10.0 0.001-1.0 0.9993 0.9982 0.2 0.004
Tebuconazole 0.05-10.0 0.001-1.0 0.9995 0.9992 0.2 0.004
Table 4. Recovery (R%) and Repeatability (RSDr) of methods SPE and HPLC-DAD and SPE and LC-ESI-MS/MS for the mixture of carbofuran, 2,4-D,
clomazone and tebuconazole in drinking water samples spiked at different levels
Pesticides
HPLC-DAD LC-ESI-MS/MS
Level
(µg L-1) R (%) RSDr (%)
Level
(µg L-1) R (%) RSDr (%)
Carbofuran 0.20 1.25 5.00 10.00 101.4 66.7 89.8 93.7 19.4 20.7 5.0 12.3 0.004 0.04 2.00 91.4 90.0 67.0 20.0 4.3 1.7
2,4-D 0.20
practice in the area is intense and has been going on for years. Carbofuran, clomazone and tebuconazole were the compounds found. In general, signiicant differences were observed in the levels and the proile of the pesticides detected in distinct sampling periods.
The behavior of the samples was strongly different. 2,4-D was the only pesticide that was not detected, probably because it is less used in Quitéria area than the others. It
is mainly used in cultures of rice, corn, soy and wheat,36
which are not raised in Quitéria. This compound has also lower half life than others and, moreover, has the highest solubility in water and the lowest half life in soil, probably being degraded rapidly before reaching the groundwater.
In surface waters, it has been found in many studies.11,19,37
The pesticide carbofuran showed the highest concentrations. October and March were the months that
showed the highest contamination, 10.4 and 9.75 µg L-1,
respectively, exceeding the maximum value permitted by the Brazilian legislation for groundwaters. Wells 1
(9 m) and 2 (37 m) presented the major occurrence.
Tariq et al.38 detected carbofuran residues in well waters
from Punjab, Pakistanwith a detection frequency of 59
and 43% in July and October 2004, respectively. This is one of the factors related to the high solubility of the compound in water. The highest concentration was
23.1 µg L-1. Bacigalupo and Meroni39 analyzed water
from wells in an agricultural area in the south of Milan for 11 months and found residues of carbofuran in
90% of the samples at concentrations below 5.0 µg L-1.
Hernández et al.40 detected carbofuran in groundwater
in around 25% of samples (Castellón, Spain), but never
in levels higher than 0.1 µg L-1.
Clomazone has high water solubility and water half life higher than 30 days and showed its highest levels in
August in well 2 (9 m), 0.82 µg L-1. The high frequency
clomazone contamination in groundwaters was detected
by Bortoluzzi et al.;5 they detected the compound in
50% of well samples, also in Rio Grande do Sul State at Southeast of Brazil, at a mean concentration of
6.76 µg L-1. In this study, the herbicide clomazone was
detected in 70% of wells.
The high detection frequency of the pesticides carbofuran and clomazone in groundwater, both in shallow and deep wells can be explained by their high potential for leaching as a result of their low soil sorption coeficient and high solubility in water, as well as relatively high half life in the soil.
The systemic tebuconazole fungicide is used to control a wide range of fungi on fruit and vegetables. The concentrations of tebuconazole were higher in July and August, and well 5 (6 m) showed the highest levels,
1.73 µg L-1 in July and 3.65 µg L-1 in August. The compound
tebuconazole was detected in wells 29 m deep. Although it has occurred with low frequency, it conirms the high potential for leaching that this compound has. This compound was
found in groundwaters (in France) by Baugros et al.27 The
amounts ranged from 0.89 µg L-1 to 0.03 µg L-1.
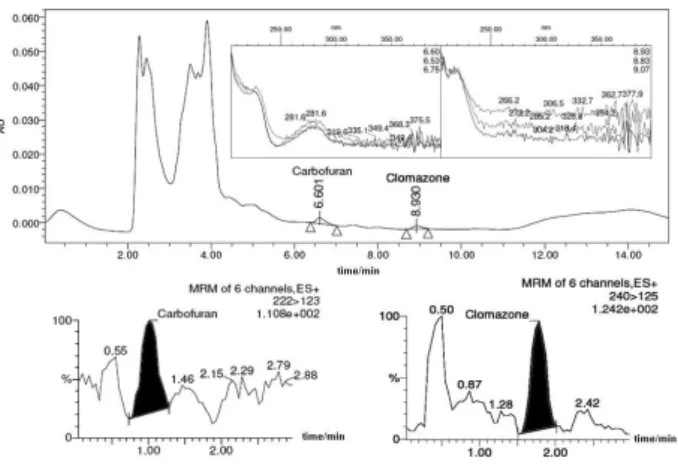
A chromatogram obtained from a positive sample by HPLC-DAD and by LC-ESI-MS/MS is shown in Figure 2. Peaks with retention time of 6.601 and 8.930 min were detected in HPLC-DAD and 1.01 and 1.78 min in
LC-ESI-MS/MS at m/z 222 > 123 and 240 > 125, corresponding to
carbofuran and clomazone, respectively.
Conclusions
The method that we developed showed that SPE proved to be eficient for the extraction of all compounds due to its simplicity, the good recovery results obtained from the spiked water samples, and good data repeatability.
Figure 1. Concentrations of carbofuran, clomazone and tebuconazole
From the point of view of sensitivity, the SPE method, both with HPLC-DAD and LC-ESI-MS/MS, allowed the determination of pesticides at concentrations below the limits established by the Brazilian legislation in groundwater used for human consumption. However, MS detection shows some advantages in relation to DAD detection, such as structural information. It is very important in order to prevent false positives concerning the identity of compounds in the real samples.
Both methods would be suitable for the simultaneous determination of these pesticides in groundwater samples, and the choice of one procedure over the other may depend on the instrument availability at each laboratory.
In the analysis of the groundwater samples from Quitéria by LC-ESI-MS/MS, three out of the four compounds under investigation were found. The pesticides that we found were carbofuran, clomazone and tebuconazole. Taking into account the ten wells we have analyzed, pollution due to pesticides was found in eight of them, at least once. It should be emphasized that the contents of these pesticides in groundwaters have almost no relation with the time of the analysis, thus, it does not seem to be a seasonal phenomenon. The pollution in groundwaters is persistent and seems to be related to the frequency of pesticide application and rainfall, soil permeability, recharge rate of the aquifer, intensive spraying and the occurrence of speciic source contamination due to farmers’ lack of knowledge regarding the safe use of pesticides.
Acknowledgments
The authors acknowledge CNPq, FINEP, CAPES, PETROBRAS and FAPERGS (Term No. 0701984) for inancial support.
References
1. Marchesan, E.; Zanella, R.; Ávila, L. A.; Camargo, E. R.; Machado, S. L. O.; Macedo, V. R. M.; Sci. Agric. (Piracicaba, Braz.) 2007,64, 131.
2. Marques, M. N.; Cotrim, M. B.; Pires, M. A. F.; Quim. Nova
2007,30, 1171.
3. Polati, S.; Bottaro, M.; Frascarolo, P.; Gosetti, F.; Gianotti, V.; Gennaro, M. C.; Anal. Chim. Acta 2006, 579, 146.
4. Capobiango, H. L. V.; Cardeal, Z. L.; J. Braz. Chem. Soc.2005,
16, 907.
5. Bortoluzzi, E. C.; Rheinheimer, D. S.; Gonçalves, C. S.; Pellegrini, J. B. R.; Maroneze, A. M.; Kurz, M. H. S.; Bacar, N. M.; Zanella, R.; Quim. Nova 2007, 30, 1872.
6. Gou, Y.; Eisert, R.; Pawliszyn, J.; J. Chromatogr. A2000,873, 137. 7. Chingombe, P.; Saha, B.; Wakeman, R. J.; J. Colloid Interface
Sci.2006,297, 434.
8. Fonseca, M. B.; Glusczak, L.; Moraes, B. S.; Menezes, C. C.; Pretto, A.; Tierno, M. A.; Zanella, R.; Gonçalves, F. F.; Loro, V. L.; Ecotoxicol. Environ. Saf.2008,69, 416.
9. Schriever, C. A.; Von der Ohe, P. C.; Liess, M.; Chemosphere
2007,68, 2161.
10. Zanella, R.; Primel, E. G.; Machado, S. L. O.; Gonçalves, F. F.; Marchezan, E.; Chromatographia 2002, 55, 573.
11. Primel, E. G.; Zanella, R.; Kurz, M. H. S.; Gonçalves, F. F.; Machado, S. O.; Marchezan, E.; Quim. Nova2005, 28, 605.
12. Jeannot, R.; Sabik, H.; Sauvard, E.; Genin, E.; J. Chromatogr.
A2000, 879, 51.
13. Rodrigues, A. M.; Ferreira, V.; Cardoso, V. V.; Ferreira, E.; Benoliel, M. J.; J. Chromatogr. A2007,1150, 267.
14. Primel, E. G.; Milani, M. R.; Demoliner, A.; Niencheski, L. F.; Escarrone, A. L.; Int. J. Environ. Anal. Chem., in press. 15. Picó, Y.; Fernández, M.; Ruiz, M. J.; Font, G.; J. Biochem. Bioph. Methods2007,70, 117.
16. Gatidou, G.; Kotrikla, A.; Thomaidis, N. K. S.; Lekkas, T. D. S.; Anal. Chim. Acta2005,528, 89.
17. Bruzzoniti, M. C.; Sarzanini, C.; Costantino, G.; Fungi, M.; Anal. Chim. Acta2006,578, 241.
18. Tran, A. T. K.; Hyne, R. V.; Doble, P.; Chemosphere2007,67, 944. 19. Palma, G.; Sánchez, A.; Olave, Y.; Encina, F.; Palma, R.; Barra,
R.; Chemosphere2004, 57, 763.
20. Padrón, M. E. T.; Ferrera, Z. S.; Rodríguez, J. J. S.; Anal. Bioanal. Chem.2006,386, 332.
21. Rodríguez-Cuesta, M. J.; Boqué, R.; Rius, R. X.; Vidal, J. L. M.; Frenich, A. G.; Chemom. Intell. Lab. Syst. 2005,77, 251. 22. Slobodnik, J.; Van Baar, B. L. M.; Brinkman, U. A. Th.;
J. Chromatogr. A1995,703, 81.
23. Vékey, K.; J. Chromatogr. A2001,921, 227.
24. Chaves, A.; Shea, D.; Danehower, D.; Chemosphere2008,71, 629.
25. Rosen, R.; Curr. Opin. Biotechnol.2007,18, 246.
Figure 2. (a) DAD chromatogram corresponding to the analysis of a
26. Peschka, M.; Petrovic, M.; Knepper, T. P.; Barceló, D.; Anal. Bioanal. Chem. 2007,388, 1227.
27. Baugros, J. B.; Giroud, B.; Dessalces, G.; Grenier-Loustalot, M.; Cren-Olivé, C.; Anal. Chim. Acta2008,607, 191. 28. Gervais, G.; Brosillon, S.; Laplanche, A.; Helen, C.;
J. Chromatogr. A2008,1202, 163.
29. Hildebrandt, A.; Guillamón, M.; Lacorte, S.; Tauler, R.; Barcelo, D.; Water Res.2008,42, 3315.
30. Caldas, S. S.; Demoliner, A.; Primel, E. G.; J. Braz. Chem. Soc.
2009,20, 125.
31. Cabrera, L.; Costa, F. P.; Primel, E. G.; Quim. Nova2008,31, 1982.
32. Ribani, M.; Collins, C.H.; Bottoli, C.B.G.; J. Chromatogr. A
2007,1156, 201.
33. Ribani, M.; Bottoli, C. B. G.; Collins, C. H.; Jardim, I. C. F. S.; Melo, L. F. C.; Quim. Nova2004,27, 771.
34. Petrovic, M.; Hernando, M. D.; Díaz-Cruz, M. S.; Barceló, D.; J. Chromatogr. A2005,1067, 1.
35. Environmental National Council (CONAMA), Resolution No. 396, abril 3, 2008 (Resolução nº 396, de 03 de abril de
2008); Deals with classiication and environmental guidance for groundwater speciications and other issues (Dispõe sobre a classiicação e diretrizes ambientais para o enquadramento das águas subterrâneas e dá outras providências), Diário Oicial da República Federativa do Brasil, 07 abril 2008, Brasil , (http:// www.mma.gov.br/port/conama/legiabre.cfm?codlegi=562). 36. Chemistry Regional Council of the 5th Reigion (Conselho
Regional de Química da 5º região, CRQ-V), Agrotoxic chamber (Camara dos agrotóxicos) First agrotoxic maping used in Rio Grande do Sul (Iº mapeamento de agrotóxicos utilizados no Rio Grande do Sul), 1st ed., CRQ-V: Porto Alegre, 2008. 37. Laganà, A.; Bacaloni, A.; Leva, I.D.; Faberi, A.; Fago, G.;
Marino, A.; Anal. Chim. Acta2002,462, 187.
38. Tariq, M. I.; Afzal, S.; Hussain, I.; Environ. Int.2004,30, 471. 39. Bacigalupo, M. A.; Meroni, G.; J. Agric. Food Chem. 2007,55,
3823.
40. Hernández, F.; Sancho, J. V.; Pozo, O.; Lara, A.; Pitarch, E.; J. Chromatogr. A2001,939, 1.
Received: June 3, 2009