WORKING PAPER SERIES
Universidade dos Açores Universidade da Madeira
CEEAplA WP No. 02/2010
Higher Education attainment – the case of
intergenerational transmission of education in
Portugal
Pedro Telhado Pereira
Higher Education attainment – the case of
intergenerational transmission of education in Portugal
Pedro Telhado Pereira
Universidade da Madeira (DGE)
e CEEAplA
Working Paper n.º 02/2010
Março de 2010
CEEAplA Working Paper n.º 02/10
Março de 2010
RESUMO/ABSTRACT
Higher Education attainment – the case of intergenerational transmission
of education in Portugal
The lack of formal education and competences of the Portuguese workers is
one of the biggest problems of the country. This lack is disappearing as quickly
as desired and the young generations still lag far behind those in other OECD
countries. This paper studies the intergenerational transmission of education
achievement, in particular higher education completion, seeking to determine
the influence on future attainment of parents’ education and labor market
conditions while the child was growing up. We conclude that the education of
the parents is very important, even if it is only one of them that has it. This
influence seems not to be independent of the gender of the parent who has it.
The fact that the parents face unemployment has a negative effect on the
educational achievement of the child. Females generally perform better than
males, but there are exceptions. For instance, it is significantly lower if the
father has low education and the mother has secondary or higher education.
Keywords: demand for schooling, human capital, parent’s education.
JEL Code: I21, I28, J11
Pedro Telhado Pereira
Departamento de Gestão e Economia
Universidade da Madeira
Edifício da Penteada
Caminho da Penteada
9000 - 390 Funchal
1
Higher Education attainment – the case of intergenerational
transmission of education in Portugal
Pedro Telhado Pereira
Universidade da Madeira, CEEAplA, IZA and CEPR Universidade da Madeira
Campus Universitário da Penteada 9000-390 Funchal
Tel: 351 – 919251136 Email: [email protected]
Abstract: The lack of formal education and competences of the Portuguese workers is one of the biggest problems of the country. This lack is disappearing as quickly as desired and the young generations still lag far behind those in other OECD countries. This paper studies the intergenerational transmission of education achievement, in particular higher education completion, seeking to determine the influence on future attainment of parents’ education and labor market conditions while the child was growing up. We conclude that the education of the parents is very important, even if it is only one of them that has it. This influence seems not to be independent of the gender of the parent who has it. The fact that the parents face unemployment has a negative effect on the educational achievement of the child. Females generally perform better than males, but there are exceptions. For instance, it is significantly lower if the father has low education and the mother has secondary or higher education.
Keywords: demand for schooling, human capital, parent’s education. JEL Code: I21, I28, J11
2 Introduction
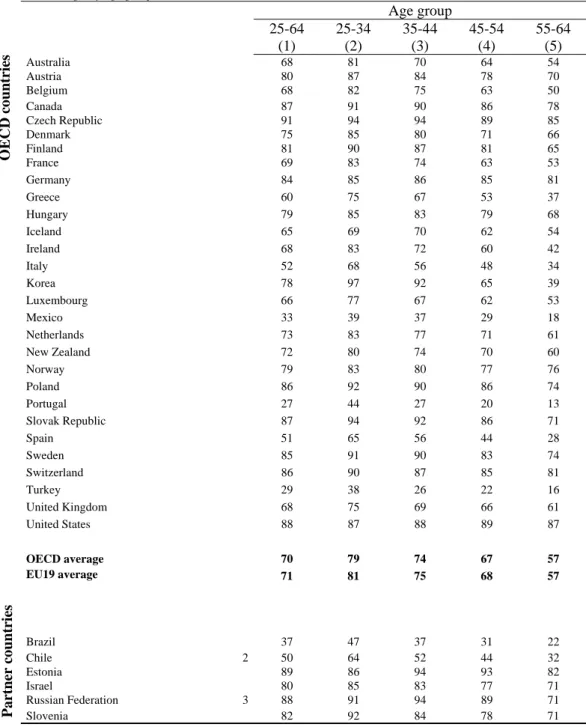
Portugal is one of the OECD’s countries that shows lower educational attainment even among its younger population, as can be seen in the table I.
Table I. Population with at least upper secondary education1 (2007)
Percentage, by age group
Age group 25-64 25-34 35-44 45-54 55-64 (1) (2) (3) (4) (5) OECD c o un tr ies Australia 68 81 70 64 54 Austria 80 87 84 78 70 Belgium 68 82 75 63 50 Canada 87 91 90 86 78 Czech Republic 91 94 94 89 85 Denmark 75 85 80 71 66 Finland 81 90 87 81 65 France 69 83 74 63 53 Germany 84 85 86 85 81 Greece 60 75 67 53 37 Hungary 79 85 83 79 68 Iceland 65 69 70 62 54 Ireland 68 83 72 60 42 Italy 52 68 56 48 34 Korea 78 97 92 65 39 Luxembourg 66 77 67 62 53 Mexico 33 39 37 29 18 Netherlands 73 83 77 71 61 New Zealand 72 80 74 70 60 Norway 79 83 80 77 76 Poland 86 92 90 86 74 Portugal 27 44 27 20 13 Slovak Republic 87 94 92 86 71 Spain 51 65 56 44 28 Sweden 85 91 90 83 74 Switzerland 86 90 87 85 81 Turkey 29 38 26 22 16 United Kingdom 68 75 69 66 61 United States 88 87 88 89 87 OECD average 70 79 74 67 57 EU19 average 71 81 75 68 57 Partner c o untries Brazil 37 47 37 31 22 Chile 2 50 64 52 44 32 Estonia 89 86 94 93 82 Israel 80 85 83 77 71 Russian Federation 3 88 91 94 89 71 Slovenia 82 92 84 78 71
1. Excluding ISCED 3C short programs. 2. Year of reference 2004.
3. Year of reference 2002.
Source: OECD. (www.oecd.org/edu/eag2009).
There is an extensive literature relating children’s educational achievement to the education or income of their parents (Becker 1988, Becker and Tomes 1986, Haveman and
3
Wolfe 1995, Oosterbeek 1995, Heineck and Riphahn 2009, Pascual 2009, Rumberger 2009, just to cite a few). The model behind these studies is one where parents decide the allocation of resources to consumption and investment either in assets or human capital of their children. More education of the parents implies higher income and therefore a larger choice set, allowing the choice of more human capital for their children.
Portugal is a country where returns to education have been very high (see, for instance, Martins and Pereira 2004) and we would therefore expect to find a strong intergenerational transmission of educational achievement and, at the same time, the transmission of the problem of low skills that the country´s population faces.
The labor market situation of the parents, unemployment in particular, can also decrease the choice set and therefore decrease the investment in the human capital of the children.
The questions we address in this study are the following:
1. What is the relationship between parents’ education and the individual’s higher education completion?
2. Is this relationship independent of who has the education (mother or father)? 3. What is the relationship between parents’ labor market situation and the individual’s higher education completion?
4. Do these relationships vary with gender?
1 Methods
We use IEFA1 (Adult education and training survey – 2007) data. It contains 11,289 interviews (5,350 males, 5,939 females) where the respondents were asked about the educational level of the parents and their situation in the labor market while they were growing up (age 12 to 16).
In the dataset there are three educational levels and three labor market situations for the parents:
BAS –corresponding to less than or equal to 9 years of education SEC – degree corresponding to 11 or 12 years of education HIG – Higher education degree
UNE - Unemployed
1
This survey was carried out by Statistics Portugal and took place in all European Member States, following methodological guidelines issued by Eurostat.
4 EMP - Employed
NOT - Not in the labor market
We consider only cases where we have information about both parents (10,433 observations). M stands for mother and F stands for father, e. g. M_BAS/F_BAS is a couple in which both partners have BAS education. M_UNE/F_EMP is a couple where the mother is unemployed and the father is employed.
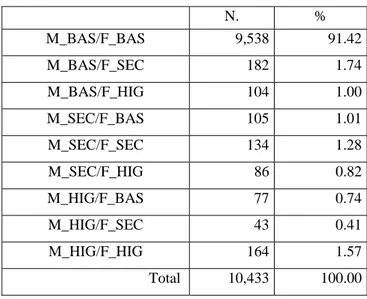
In Table II we see the distribution of education among parents.
Table II. Parents’ educational achievement
N. % M_BAS/F_BAS 9,538 91.42 M_BAS/F_SEC 182 1.74 M_BAS/F_HIG 104 1.00 M_SEC/F_BAS 105 1.01 M_SEC/F_SEC 134 1.28 M_SEC/F_HIG 86 0.82 M_HIG/F_BAS 77 0.74 M_HIG/F_SEC 43 0.41 M_HIG/F_HIG 164 1.57 Total 10,433 100.00
We see that more than 90% of the individuals have both parents with at most 9 years of education. Less than 2% have both parents with a Higher Education Degree.
The distribution of the parents’ labor market situation appears in Table III.
Table III. Parents’ labor market situation
N. % M_NOT/F_NOT 116 1.11 M_NOT/F_UNE 29 0.28 M_NOT/F_EMP 5,172 49.57 M_UNE/F_NOT 3 0.03 M_UNE/F_UNE 6 0.06 M_UNE/F_EMP 29 0.28 M_EMP/F_NOT 93 0.89 M_EMP/F_UNE 12 0.12 M_EMP/F_EMP 4,973 47.67 Total 10,433 100.00
5
More than 97% of the individuals had an employed father and for the majority of these the mother was not in the labor market while they were growing up. The cases of unemployment were rare when the individuals were growing up.
In the dataset the education of the individual (child) appears in four categories, one more than those of the parents. The extra category is for individuals who did not attain any education. The categories and the distribution of education appear in table IV.
NONE – no formal education
BAS –less than or equal to 9 years of education SEC –11 or 12 years of education
HIG – Higher education degree
Table IV. Individual’s education
N. % NONE 514 4.93 BAS 7,098 68.03 SEC 1,675 16.05 HIG 1,146 10.98 Total 10,433 100.00
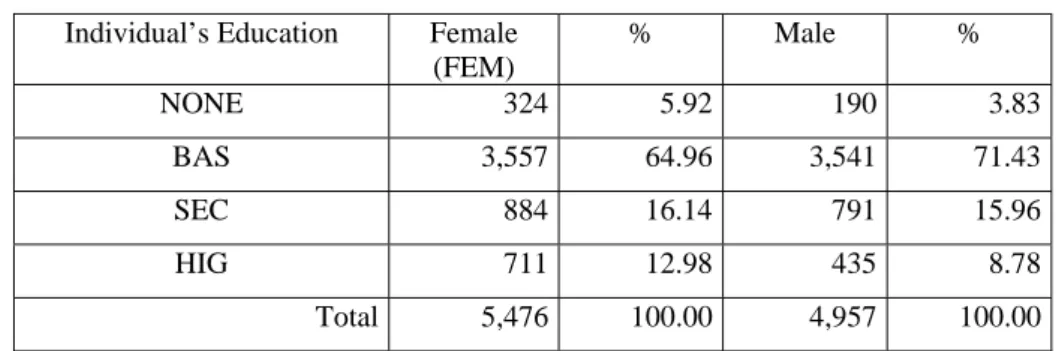
More than 70% of the individuals have up to 9 years of education, meaning that less than 30% of the individuals have at least an upper secondary degree (as already seen in Table I). Educational attainment is not gender blind, as can be seen in Table V.
Table V. Individual’s education by gender
Individual’s Education Female
(FEM) % Male % NONE 324 5.92 190 3.83 BAS 3,557 64.96 3,541 71.43 SEC 884 16.14 791 15.96 HIG 711 12.98 435 8.78 Total 5,476 100.00 4,957 100.00
As in other countries, females (see, for the US, Goldin, Katz, & Kuziemko, 2006) are more prone to achieve a higher education degree than males.
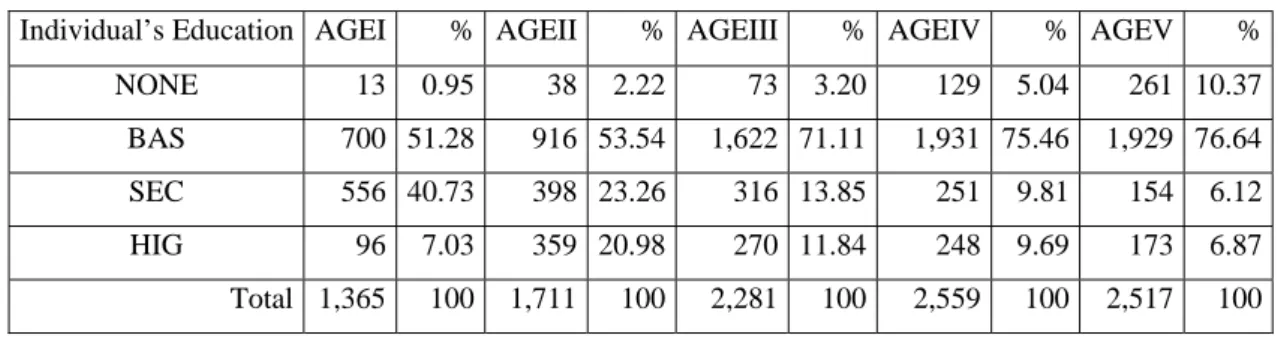
6 AGEI – 18 to 24 years old
AGEII – 25 to 34 years old AGEIII – 35 to 44 years old AGEIV – 45 to 54 years old AGEV – 55 to 64 years old
The educational attainment by age group follows:
Table VI. Individual’s education by age group
Individual’s Education AGEI % AGEII % AGEIII % AGEIV % AGEV %
NONE 13 0.95 38 2.22 73 3.20 129 5.04 261 10.37
BAS 700 51.28 916 53.54 1,622 71.11 1,931 75.46 1,929 76.64
SEC 556 40.73 398 23.26 316 13.85 251 9.81 154 6.12
HIG 96 7.03 359 20.98 270 11.84 248 9.69 173 6.87
Total 1,365 100 1,711 100 2,281 100 2,559 100 2,517 100
We see that completion of higher education decreases with age except in the first age group. In this youngest group there are still people who did not finish their studies.
We perform an ordered probit (four education levels), using as explanatory variables parents’ education, parents’ labor market situation, age of individual, and gender. We allow the influence of the explanatory variables to be different depending on the gender of the individual (creating variables VAR*FEM).
We considered as reference group a young male with both parents with a degree of less than or equal to nine years of education, both not in the labor market.
Due to the small number of individuals whose parents were both unemployed (six individuals) or whose mother was unemployed and father not in the labor market (three individuals) we decided to drop them from our sample.
7
2 Results
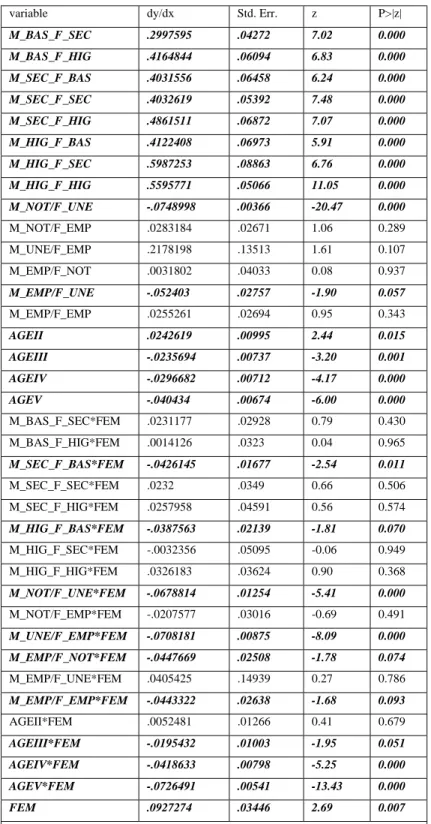
The marginal effects on higher education completion appear in Table VI.
Table VII. Marginal effects on higher education completion
variable dy/dx Std. Err. z P>|z|
M_BAS_F_SEC .2997595 .04272 7.02 0.000 M_BAS_F_HIG .4164844 .06094 6.83 0.000 M_SEC_F_BAS .4031556 .06458 6.24 0.000 M_SEC_F_SEC .4032619 .05392 7.48 0.000 M_SEC_F_HIG .4861511 .06872 7.07 0.000 M_HIG_F_BAS .4122408 .06973 5.91 0.000 M_HIG_F_SEC .5987253 .08863 6.76 0.000 M_HIG_F_HIG .5595771 .05066 11.05 0.000 M_NOT/F_UNE -.0748998 .00366 -20.47 0.000 M_NOT/F_EMP .0283184 .02671 1.06 0.289 M_UNE/F_EMP .2178198 .13513 1.61 0.107 M_EMP/F_NOT .0031802 .04033 0.08 0.937 M_EMP/F_UNE -.052403 .02757 -1.90 0.057 M_EMP/F_EMP .0255261 .02694 0.95 0.343 AGEII .0242619 .00995 2.44 0.015 AGEIII -.0235694 .00737 -3.20 0.001 AGEIV -.0296682 .00712 -4.17 0.000 AGEV -.040434 .00674 -6.00 0.000 M_BAS_F_SEC*FEM .0231177 .02928 0.79 0.430 M_BAS_F_HIG*FEM .0014126 .0323 0.04 0.965 M_SEC_F_BAS*FEM -.0426145 .01677 -2.54 0.011 M_SEC_F_SEC*FEM .0232 .0349 0.66 0.506 M_SEC_F_HIG*FEM .0257958 .04591 0.56 0.574 M_HIG_F_BAS*FEM -.0387563 .02139 -1.81 0.070 M_HIG_F_SEC*FEM -.0032356 .05095 -0.06 0.949 M_HIG_F_HIG*FEM .0326183 .03624 0.90 0.368 M_NOT/F_UNE*FEM -.0678814 .01254 -5.41 0.000 M_NOT/F_EMP*FEM -.0207577 .03016 -0.69 0.491 M_UNE/F_EMP*FEM -.0708181 .00875 -8.09 0.000 M_EMP/F_NOT*FEM -.0447669 .02508 -1.78 0.074 M_EMP/F_UNE*FEM .0405425 .14939 0.27 0.786 M_EMP/F_EMP*FEM -.0443322 .02638 -1.68 0.093 AGEII*FEM .0052481 .01266 0.41 0.679 AGEIII*FEM -.0195432 .01003 -1.95 0.051 AGEIV*FEM -.0418633 .00798 -5.25 0.000 AGEV*FEM -.0726491 .00541 -13.43 0.000 FEM .0927274 .03446 2.69 0.007
Predicted probability for the reference group (young male with both parents with BAS education and not in the labor market) = .07644406
8
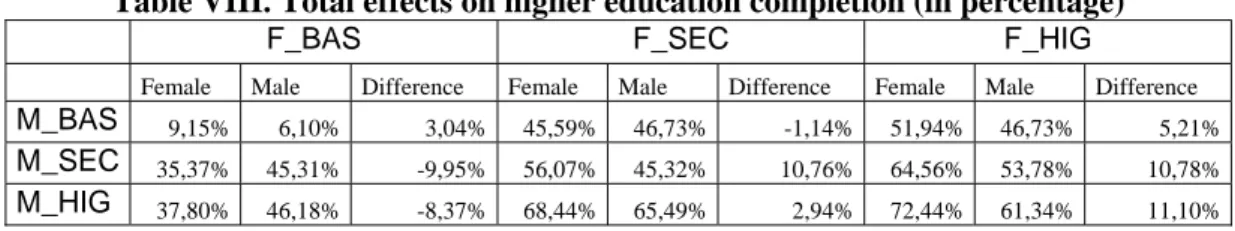
Looking at the results of females’ variables, we see that there is a significant difference between females and males pointing to a female positive effect that decreases when the father has low education. Based on these results we perform independent regressions for the male and female samples (results in the appendix). From the results of these regressions we calculate the probabilities of achieving a Higher education degree, which appear in table VII.
Table VIII. Total effects on higher education completion (in percentage)
F_BAS F_SEC F_HIG
Female Male Difference Female Male Difference Female Male Difference
M_BAS 9,15% 6,10% 3,04% 45,59% 46,73% -1,14% 51,94% 46,73% 5,21%
M_SEC 35,37% 45,31% -9,95% 56,07% 45,32% 10,76% 64,56% 53,78% 10,78%
M_HIG 37,80% 46,18% -8,37% 68,44% 65,49% 2,94% 72,44% 61,34% 11,10%
We see that education of the parents increases significantly the higher education attainment of their children; at least a 25% increase, going as high as 60%. This answers question 1 above.
Given the education of the parents, females seem to perform better than males with the exception of those whose father has low education and the mother has a secondary or tertiary education, and those whose mother has low education and the father has secondary education. Therefore the positive female effect is not observed in all types of families. This answers question 4.
In the female case, having a father with low education and a mother with secondary or higher education is worse than having a mother with low education and father with secondary or higher education. In the male case we do not see that difference.
In the case of one of the parents having secondary education and the other higher education, it is better that the female has the higher education. The difference is much higher in the case of the males. Therefore the effect of the parents’ education on the attainment of the child is not independent of the gender of the parent who has the education (answers question 2), and not independent of the gender of the individual.
From the results in the annex, we see that having a father unemployed decreases significantly the probability of higher education attainment (in the case of the mother being employed the negative effect is not significant for the female sample). This answers question 3.
The young age effect seems to be greater among females meaning that younger female cohorts are improving their performance better than are male cohorts are doing, meaning in turn that the time trend is steeper for females than for males.
9
3 Conclusions
The transmission of education between generations can explain different situations that perpetuate the lag of education of certain groups and the need for policy measures to overcome the unfavorable starting conditions. In Portugal there is a great influence of parents’ education on the child’s higher education attainment. The probability of achieving a higher education degree is more than eight times higher for an individual both of whose parents have a higher education degree than for one whose parents both have at most 9 years of education. Therefore low level of education is going to perpetuate from generation to generation, creating a lasting problem.
Portuguese data show that the effect of parents’ education is not independent of the gender of the parent that has it, and from the education of the partner. As a result we recommend not using the highest education level of one of the members of the couple as an indicator of the couple’s education.
Unemployment of the father decreases the probability of attaining a higher education degree, showing that financial reasons can be the explanation for the low educational attainment.
Females have an advantage in terms of educational attainment – an average increase of around 10% in the probability of attaining a higher education degree. The average disguises situations that are unfavorable for females, such as the case of having the mother with more education than the low educated father.
The time trend seems to be steeper for females than for males.
Given the findings, it is very important to intervene in the educational process to see if the children of parents with low levels of education obtain, in order that do not leave their studies early. This should also be done with children whose parents are unemployed, especially the father. Female children whose father has low education should also have extra support.
References
Becker, G.S. 1988. Family economics and macro behaviors. The American Economic Review 78: 1–13.
Becker, G. S., and N. Tomes. 1986. Human capital and the rise and fall of families. Journal of Labor Economics 4: S1–S39.
Goldin, C., L. F Katz, and I. Kuziemko. 2006. The homecoming of American college women: The reversal of the college gender gap. Journal of Economic Perspectives 20: 133-156.
10
Haveman, R., and B. Wolfe. 1995. The determinants of children’s attainments: A review of methods and findings. Journal of Economic Literature, 33: 1829–1878.
Heineck, G., and R. T. Riphahn. 2009. Intergenerational Transmission of Educational Attainment in Germany - The Last Five Decades. Journal of Economics and Statistics (Jahrbücher für Nationalökonomie und Statistik) 229(1): 36-60.
Martins, P. S., and P. T. Pereira. 2004. Does education reduce wage inequality? Quantile regression evidence from 16 countries. Labour Economics 11: 355– 371.
Oosterbeek, H. 1995. Choosing the optimum mix of duration and effort in education. Economics of Education Review, 14(3): 253-263.
Pascual, M. 2009. Intergenerational income mobility: The transmission of socio-economic status in Spain. Journal of Policy Modeling, 31: 835–846.
Rumberger, R.W. 2009. Education and the reproduction of economic inequality in the United States: An empirical investigation. Economics of Education Review (in press).
11
Appendix
Table AI. Marginal effects on higher education completion
Females Males variable dy/dx Std. Err. z P>|z| dy/dx Std. Err. z P>|z| Par ents’ E ducation M_BAS_F_SEC .3644079 .04845 7.52 0.000 .2872214 .04168 6.89 0.000 M_BAS_F_HIG .4279069 .0637 6.72 0.000 .4062774 .06058 6.71 0.000 M_SEC_F_BAS .2621965 .05444 4.82 0.000 .3921008 .06434 6.09 0.000 M_SEC_F_SEC .4692882 .05732 8.19 0.000 .392137 .05368 7.30 0.000 M_SEC_F_HIG .5541432 .07036 7.88 0.000 .4767576 .06926 6.88 0.000 M_HIG_F_BAS .2865847 .07179 3.99 0.000 .4007239 .06947 5.77 0.000 M_HIG_F_SEC .5928922 .09663 6.14 0.000 .5938867 .09068 6.55 0.000 M_HIG_F_HIG .6329232 .04677 13.53 0.000 .5523683 .05163 10.70 0.000 Parents’ Lab o r Ma rk et M_NOT/F_UNE -.0923406 M_NOT/F_EMP .006795 .00403 .02338 0.29 -22.90 0.000 0.771 -.0604248 .0251655 .0227 1.11 .00368 -16.42 0.000 0.268 M_UNE/F_EMP -.027817 .03806 -0.73 0.465 .2079095 .1301 1.60 0.110 M_EMP/F_NOT -.048463 .01992 -2.43 0.015 .0027343 .03457 0.08 0.937 M_EMP/F_UNE -.0395095 .06189 -0.64 0.523 -.0444237 .02068 -2.15 0.032 M_EMP/F_EMP -.0266651 .02324 -1.15 0.251 .0227805 .02321 0.98 0.326 Age AGEII .0337868 .01158 2.92 0.004 .0214165 .00859 2.49 0.013 AGEIII -.0452848 .00752 -6.02 0.000 -.0209386 .00615 -3.40 0.001 AGEIV -.0753454 .0068 -11.08 0.000 -.0262587 .00595 -4.41 0.000 AGEV -.1211064 .00624 -19.41 0.000 -.0356393 .00564 -6.32 0.000
Predicted probability for the reference group (young female with both parents with BAS education and not in the labor market) = .07644406
Predicted probability for the reference group (young male with both parents with BAS education and not in the labor market) = .06103418