The Effects of Accountability on Higher Education
Marcelo Rezende∗
June 2007
Abstract
This paper analyzes the effect of an accountability system in the Brazilian college market. For each discipline, colleges were assigned a grade that depended on the scores of their students on the ENC, an annual mandatory exam. Those grades were then disclosed to the public, giving applicants information about college quality. The system also established rewards and penalties based on the colleges’ grades. I find that the ENC
had a substantial effect
on different measures of college quality, such as faculty education and the proportion of full-time faculty. The detailed information from this unique dataset and the fact that the ENC started being required for different disciplines in different years allow me to control for time-specific effects, thus minimizing the bias caused by policy endogeneity. Indeed, I find strong evidence on the importance of controlling for time-specific effects: estimates of the impact of the ENC on college quality more than double when I do not take those effects into account. The ENC also affects positively the ratio between applicants and vacancies, and it decreases the faculty and the entering class sizes. The results suggest that its introduction fostered competition and favored colleges entering the market.
∗
1 Introduction
Accountability systems have become prevalent among policies intended to improve school quality. They typically require students to take a standardized test. The results, aggregated by school, are then disclosed to the public, and schools are rewarded or penalized depending on their performance. The impact of these policies on school quality is twofold. On one hand, rewards and penalties have a direct effect on incentives to invest in quality. On the other hand, grades disclosure informs applicants, thereby allowing them to identify high-quality schools and eliminating the low-quality ones from the market, providing additional incentives to invest in low-quality.1 Examples of these policies are found mostly in the United States, in particular since the No Child Left Behind Act of 2001, but they are also found in other countries as well.
In contrast with its widespread application in basic education and despite the strength of the incentives, accountability is rarely imposed in higher education markets.2 For this reason, empirical analysis on the effects of accountability on higher education is also scarce compared to research on the former. However, research on this subject is particularly important given the large body of literature examining the returns to higher education.3 Moreover, it has become extremely opportune since a federal commission was established to consider the expansion of standardized testing into higher education in the United States (Arenson, 2006).
This paper analyzes the effect of an accountability policy in the Brazilian college market. I study the consequences of the National Exam of Courses (ENC henceforth) created in 1996 by the Ministry of Education of Brazil.4 The ENC was an annual exam mandatory for every senior college
1
Accountability usually implies information disclosure because penalties or rewards are based on school performance, which is publicly announced. For this reason the effects of information disclosure and accountability itself may become indiscernible.
2
Accountability policies are less frequent in college than in primary or secondary education to some extent because colleges are generally more subject to competition than the latter. For instance, college students are typically more mobile than primary and secondary school students. However, for this very reason, accountability policies might have stronger results on higher education.
3
Card (1999) and Katz and Autor (1999) survey the literature on returns to schooling and wage structure and discuss the research on the returns to higher education.
4
student from a certain list of disciplines.5 For each discipline, colleges were assigned a grade, ranging from A to E, which depended on the average score of their students. Those grades were then published by the Ministry of Education and widely publicized in the media, thus giving applicants information about college quality.
Besides providing information to applicants, the ENC was created as part of an accountability system that determined rewards and penalties for colleges depending on their performance. Colleges with good grades would be allowed to admit more students and create new campuses while those with bad grades would be temporarily prohibited from admitting new students. However, the system was weakened because its main threat – suspending the accreditation of college-discipline pairs - was not enforced. Colleges obtained an exemption from those standards in court; therefore, the consequences of poor performances on the exam were not as drastic as initially planned (Souza, 2005). Thus, the ENC was considered mainly a mandatory information disclosure policy.6
In this paper I use a unique panel dataset where the unit of observation is a college-municipality-discipline-year quartet.7 I employ two different sets of dependent variables, one to measure college quality exclusively and another to capture other changes in the college market caused by the ENC. College quality is measured by faculty education and by the number of weekly hours they are employed at the college. The other changes studied are the effect of the ENC on student competition for vacancies, college size, and enrollment, which are measured, respectively, by the ratio between applicants and vacancies, faculty size, and entering class size. The impact of the ENC is identified comparing college-municipality-discipline triples’ characteristics before and after it covers a discipline, which happened in different years for different disciplines.
5
Unless otherwise noted, I refer to colleges, universities and other higher education institutions generally as colleges.
6
As the Minister of Education in the period of the ENC Paulo Renato Souza observes: “The most important, without a doubt, was the reaction of the society to the information about the evaluation of the higher education institutions.” (Souza, 2005, page 165, author’s translation from Portuguese).
7
The empirical results suggest that the ENC had a substantial effect on college quality. I find that the ENC caused colleges to increase the percentage of faculty members with Ph.D. degrees by 1.21, a large effect considering the sample mean is equal to 18.66%. Similar results are found for other measures of faculty education. The percentage of full-time faculty also increases by 1.07 percentage points, which is also large, considering the mean of 38.95%.8
In principle, those estimates might be biased due to time-specific or discipline-specific unobservable variables that may affect both the start of the ENC and college quality. Failure to account for such effects could bias the estimates of the impact of the ENC on college quality. However, the fact that the ENC started being required for different disciplines in different years allows me to use an empirical strategy that alleviates these biases. Since I have observations at the year level, I can control for state-year and college-municipality-discipline-fixed effects. Such an approach therefore helps mitigate the effects of time- and discipline-specific unobservable variables on the year the ENC starts and on college quality, while at the same time controlling for unobservable characteristics of college-municipality-discipline triples and time-varying characteristics of states.
Indeed, I do find evidence on the importance of controlling for time- and discipline-specific unobservable variables. Year effects in particular are found to have a stronger impact on college quality than the ENC itself. Moreover, when I do not control for time effects, the estimated effect of the ENC more than doubles. Failure to control for time effects therefore would lead to an overestimation of the effect of this policy.
I also study the effect of the ENC on the number of faculty members, the size of the entering class, and the ratio between candidates and vacancies. Two reasons motivate the analysis of its effect on those variables. First, it may help understand how the ENC affects college quality. Second, it reveals the impact of this accountability system on the enrollment and the size distributions of colleges and, thus, its effect on competition among colleges. The ENC positively affects the ratio between
8
applicants and vacancies, consistent with the disclosure of information lowering applicants’ search costs. I find some evidence that such effect is weaker the lower the grade received, as expected. This effect disappears, however, when I allow the impact of the ENC to depend on college ownership, which is found to be relevant. The ENC increases that ratio by 17.1% and 14.7% for federal and state colleges, respectively, while its impact on private and municipal ones is negligible, suggesting that colleges react differently to the ENC. Indeed, the impact should be different for public and private colleges, since the former do not charge tuition, while the latter can raise it in response to higher demand.
The introduction of the ENC also causes the number of faculty members of incumbent colleges to decrease by 4.9% and their entering class sizes to decrease by 4.3%. These results suggest that the ENC favored colleges entering the market, which could not hold good reputations because they lacked a history. The ENC disclosed information about college quality, therefore serving as a substitute for reputations in indicating the best new colleges to applicants. With more information, applicant demand may have shifted from incumbents to high-quality entrants. This shift was possibly reinforced by the threat of having low-quality college-discipline pairs closed, and since this penalty was based on the record of grades, it could not be applied to entrants. Independently of whether the impact of the ENC was through information disclosure or accountability, the results indicate that it favored entrants in this market.
Since the main effect of the ENC was through information disclosure, this paper also contributes to the literature on the impact of information disclosure about product quality, which has documented strong and varied effects in different industries. This literature has documented substantial effects of information disclosure on the quality of salad dressings (Mathios, 2000) and restaurant hygiene levels (Jin and Leslie, 2003), on the prices of child care services (Chipty and Witte, 1998), on the decisions of doctors and hospitals to treat severely ill patients (Dranove et al., 2003), and on consumer learning about the quality of HMOs (Dafny and Dranove, 2005). All these papers however do not control for time effects, presumably due either to data restrictions or because they analyze policy changes that apply to all firms in the sample at the same time. As mentioned above, the data and the policy change I analyze allow me to control for those effects - which are found to be large - yielding more reliable estimates.
This paper is organized as follows. Section 2 describes the Brazilian college market, the ENC, and the dataset. Section 3 discusses the potential effects of the ENC. Section 4 analyzes the effect of the ENC on college quality. Section 5 studies its impact on applicant competition, college size, and sales. Section 6 concludes.
2 The Brazilian College Market, the ENC, and the Data
2.1 The Brazilian College Market and the ENC
The Brazilian college market has grown significantly since the mid-nineties, both in the number of students and the number of colleges, as shown in figures 1 and 2.9 Annual college enrollment more than doubled from 1996 to 2002. The number of private colleges also doubled in the same period, while the number of public ones remained roughly constant. Such growth was caused, among other reasons, by regulatory changes promoted by the Federal Government after 1996, which allowed more entry as well as expansion in the number of vacancies and disciplines by incumbents.10
9
The data in these figures are taken from Souza (2005), and were provided by the Ministry of Education.
10
In order to measure the quality of the colleges in this newly deregulated market, the Federal Government created the ENC in 1996. The ENC was an annual exam that was mandatory for every college senior majoring in a specific list of disciplines. Students were required to take the exam in order to obtain their degrees, although the granting of the degree did not depend on the ENC score.11 Incentives for students to perform well on the exam were twofold. First, they could show their scores when applying to jobs or graduate schools. Second, starting in 2001, students with the highest performance in each discipline were awarded fellowships for graduate studies.
The number of disciplines covered by the exam increased gradually from 3 in the first year, 1996, to 26 in the last year, 2003. Table 1 shows the changes in the list of disciplines evaluated and in the number of college-discipline pairs with valid grades until 2002.12 The initial choice of the disciplines was based on the Ministry of Education’s assessment of the tradition and importance of careers, the resistance against the exams across disciplines, and the number of students in those disciplines. For these reasons, Business Administration, Civil Engineering, and Law were already chosen in the first year (Souza, 2005). New disciplines were announced one year before the exam in which they were introduced.
The content of the ENC was specific to each discipline. The exam was offered annually in a single day in June. For all disciplines, it lasted four hours, and its questions were divided between multiple choice and discursive ones. In December, students received in the mail a document containing their scores on the exam. The document included the overall score of the student as well as her scores on the multiple choice and discursive parts. In order to facilitate comparison, the document also included the average score of students in Brazil, in the region, in the state, and in the college where she studied.
For each discipline, colleges were assigned a grade, ranging from A to E, which depended on the average score of their students. From 1996 until 2000, college-municipality-discipline triples were
11
Students who did not take the ENC in their senior year needed to take the exam in the next year in order to obtain their degrees.
12
assigned A, B, C or D if their averages were above the 88th, 70th, 30th, or 12th percentiles, respectively, and E if they were below the 12th percentile. From 2001 on, these boundaries were replaced by the sample mean plus one standard deviation, the mean plus one half standard deviation, the mean minus one half standard deviation, and the mean minus one standard deviation, respectively. These grades were then published by the Ministry of Education and widely publicized in the media.
Besides providing information to applicants, the ENC was created as part of an accountability system that determined rewards and penalties for colleges depending on their performance. On the rewards side, universities and university centers that obtained grades of A or B would be allowed to increase the number of admitted students and to open new campuses without requesting approval from the Ministry of Education. On the penalties side, college-discipline pairs that received grades of D or E for three consecutive years and were considered unqualified in two out of three criteria (faculty qualification, educational project, and facilities) would not be allowed to admit new students until they improved their quality.13 In case they did not, they would not be able to renew their accreditation from the Ministry, and thus would be obliged to close.14
This accountability system however was weakened because its main threat – suspending the accreditation of college-discipline pairs - was not enforced. In 2001, the Ministry of Education suspended the accreditation of 12 colleges, but they obtained the right to maintain their status in court (Souza, 2005). Moreover, the number of colleges in this situation was small, suggesting that this threat was a concern for a few colleges only. Thus, the role of the ENC - besides disclosing information - was very restricted.
Two additional characteristics of the Brazilian college market deserve attention. First, students must choose the discipline they are going to follow when applying to college. Thus, competition for admission is separate and can be measured for each distinct college-municipality-discipline triple.
13
In 1998, 101 college-discipline pairs of Business Administration, Civil Engineering and Law were in this situation but eventually corrected their deficiencies.
14
Second, application requirements and course sequences are usually specific for each discipline. This second characteristic, together with the first one, implies that students find it costly to move between disciplines in college. A student who has already started college and who decides to move to another discipline usually must reapply to college and start taking a new course sequence. The consequence for my empirical estimation is that the reaction of college students to the ENC must have been very limited. More specifically, students were very unlikely to change disciplines due to the ENC after starting college because it was costly to do so.
2.2 The Data
The data used in the paper are publicly provided by the Ministry of Education of Brazil. The unit of observation is a college-municipality-discipline-year quartet. The data have three important limitations. First, colleges may have multiple campuses offering different disciplines, but the data do not distinguish campuses in the same municipality. If a college has more than one campus offering the same discipline in a municipality, then the data from the different campuses are aggregated in a single observation.15
Second, the primary dataset contains information for every college-municipality-discipline-year quartet with students graduating in the corresponding college-municipality-discipline-year and only for these. Thus, colleges that already have students but do not have a senior class yet are not included in the sample. This restriction therefore limits the information on colleges that entered the market recently.
Third, observations were collected only for disciplines covered by the ENC, even though they also contain information not directly related to it, such as faculty characteristics. This is relevant because the impact of the ENC is identified comparing colleges’ characteristics before and after it covers a discipline. However, since the ENC grade is released only in December – the end of the academic year in Brazil – observations from the first year a discipline is covered actually contain
15
characteristics before grades disclosure. Thus, the impact of the ENC can be estimated by the comparison between first-year observations with the subsequent ones. Table 2 summarizes these data.
Two different sets of dependent variables are used in the empirical exercises: one to measure college quality exclusively and another to capture other changes in the college market caused by the ENC. College quality is measured using data about their faculty. Faculty education is measured by the fraction of Ph.D.s, M.A.s, B.A.s with specialization courses, and B.A.s with no specialization courses. The more educated the faculty, the better the college. I also have information on the distribution of the faculty by the number of weekly hours they are employed by the college. The data contain the fraction employed for 40 hours (full time), 20 to 39 hours, 8 to 19 hours, and up to 8 hours. The fraction of full-time faculty - or faculty with more time devoted to the college - is positively related to college quality.16 These data are complemented with information on the distribution of the faculty by the number of weekly hours worked inside the classroom, separated into the same groups: the fraction of the faculty who teaches 40 hours (full time), 20 to 39 hours, 8 to 19 hours, and up to 8 hours weekly. These data are available from 1999 to 2002 only.
A second set of dependent variables captures other changes in the college market caused by the ENC. The number of faculty members measures the size of each college-municipality-discipline-year quartet, but it is also available from 1999 to 2002 only. I have data from 1996 to 2002 on the size of the entering class and the ratio of candidates to vacancies.17
This dataset also provides important independent variables from 1996 to 2002. For each observation with a valid grade I have the grade itself, ranging from A to E. Some observations were
16
Evidence on the effects of faculty composition on student performance, however, is ambiguous. Ehrenberg and Zhang (2005) provide evidence that students’ graduation rates are negatively affected by the fraction of part-time and non tenure-track faculty employed at four-year colleges. Bettinger and Long (2004) study the impact of adjunct and graduate assistant instructors compared to full-time faculty members on students’ performance in a sample of four-year public colleges in Ohio. They find that their impact on course completion rates can be positive or negative, depending on the field of study. Hoffman and Oreopoulos (2006) find that, in a sample from a Canadian university, students’ grades or course dropout rates are not affected by objective characteristics of faculty members such as whether they teach full-time or part-time, time devoted to research, tenure or salary. Perceived effectiveness of these instructors however is found to affect student performance.
17
not assigned a valid grade by the Ministry of Education, either due to a small number or a low percentage of students graduating attending the exam. For each observation I also have the number of students taking the exam and this number as a percentage of the total number of students graduating. This percentage is an important piece of the data because it controls for one mechanism colleges may resort to in order to cheat this accountability system: Similar to what has been documented for schools subject to accountability, colleges may select only their best students to take the ENC in order to obtain a grade better than they would if all their students took it.18 However, it is highly unlikely that this practice was usual, since students needed to take the exam in order to obtain their degrees.19 In fact, anecdotal evidence suggests that this sort of gaming was uncommon and therefore should not affect the estimations. On average, attendance was very high (see table 2) and the cases when it was low were mostly due to students’ protests against the ENC, which were unrelated to colleges’ initiatives. Moreover, this percentage is far from economically or statistically significant as an explanatory variable in any of the estimations, as shown later in the paper.
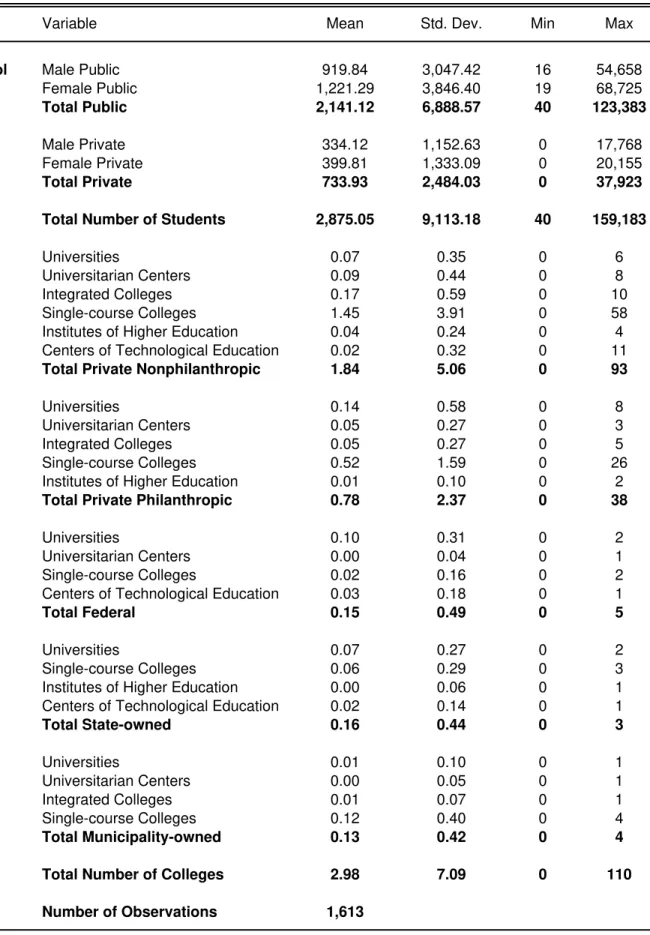
A secondary dataset containing municipality-level observations - summarized in table 3 - provides other important control variables. It contains annual observations from 1999 to 2002 on market structure and the number of high-school students graduating in a given year. Information on market structure includes the number of colleges per ownership type and its academic classification determined by the Ministry of Education. The division of colleges by ownership separates them into the following categories: for-profit private, nonprofit private, federal, state, and municipal colleges.20 The academic classification divides them according to the complexity of their organization. From the most complex to the most simple, they are classified as: universities, university centers, integrated
18
See Haney (2000), Deere and Strayer (2001), Figlio and Getzler (2002), Figlio (2005), Jacob (2005), and Cullen and Reback (2006) for evidence of schools changing the pool of students taking exams in order to obtain better grades.
19
Indeed, in 1998 a few colleges were accused of restricting their pool of students taking the ENC. However, these cases were detected before the exam date, and the excluded students were then able to register and take it (Souza, 2005).
20
colleges, colleges, institutes of higher education, and centers of technological education. This secondary dataset, however, only registers each college’s main campus. Anyway, it represents an important and detailed measure of market structure.
The data on high-school students graduating per year is divided between gender and two categories of school ownership: public and private. Information on market structure and high-school students was missing for a significant number of those pairs. From the 2,299 municipality-year pairs with observations in the primary dataset from 1999 to 2002, I was able to match data from this secondary one for 1,613 of them. However, after eliminating college-municipality-discipline triples that did not have a valid ENC score in every year, most remaining triples had information on market structure and high-school students: 3,305 triples from a total of 3,488. Moreover, as shown later in the paper, the regression results obtained when the sample is restricted to observations with information on market structure and high-school students are roughly the same as those obtained with the unrestricted sample.21
3 Potential Effects of the ENC
In this section I consider the potential effects of the ENC on the college market equilibrium. I give special attention to dependent variables I observe in the dataset in order to test these predictions. Unfortunately, the data do not contain any price or revenue information, and for this reason I abstain from discussing the impact of the ENC on those variables.22
In order to predict the effects of the ENC, it is important to first determine what colleges maximize. Colleges in the sample differ in important dimensions such as ownership and for-profit or nonprofit status. Those institutions therefore may have different objectives, but these should generally
21
The fact that after eliminating triples without a valid ENC score in every year the large majority of remaining triples had municipality-level data implies that the dropped and the remaining observations have different characteristics. More specifically, data is more likely to be available for municipalities with colleges with valid scores. These regression results however suggest that the ENC had a similar impact in municipalities with and without these data.
22
be a combination of profits and quality maximization. In any case, the effects of the ENC must be qualitatively the same for any college. This accountability system imposes information disclosure of grades as well as rewards and penalties for colleges depending on those grades. Information disclosure affects colleges through applicant demand, and it is fair to assume that any college benefits from higher demand regardless of its objective. Rewards and penalties in their turn are also expected to provide similar incentives for colleges with different objectives.
The rewards and penalties create very clear incentives for colleges. The fact that universities and university centers that obtained grades of A or B would be allowed to grow without having to ask for permission implied lower bureaucratic costs or growth restrictions for those with good performances. On the other hand, bad grades could result in being prohibited from accepting new students or potentially being obliged to close, thus creating additional incentives for good performances. However, it must be highlighted that the latter penalty had never been enforced, putting in doubt the strength of these incentives.
The main effects of the ENC therefore seem to be caused by information disclosure. When grades are disclosed, applicants can identify good colleges. Even if colleges do not respond to it, applicant demand may shift from bad colleges to good ones. Thus, the ratio of applicants to vacancies should increase for good colleges relative to bad ones. If colleges are able to respond by changing their capacity but still assuming they do not change their quality, I should also expect the student enrollment and the size of good colleges to increase relative to the bad ones.
The demand shift from bad colleges to good ones actually creates an incentive for all colleges to invest in quality. College quality should, then, increase in general. Applicants should also respond to this with higher demand. Consequently, applicants to vacancies ratio, enrollment and size should increase too.
consider a larger set of colleges. Moreover, with more information about quality, applicants do not need to rely on colleges’ reputations so much when choosing where to apply. Since only incumbents can have good reputations, once they become less relevant for applicants’ decisions, entrants are able to compete more evenly with the former. Indeed, during the period of the ENC many new colleges entered the market, and their ability to compete with incumbents may have improved due to the exam, thus having important consequences for their size and student enrollment.
The discussion above considered only effects of the ENC that do not depend on ownership. The impact of the ENC, however, may depend on ownership because private colleges are able to respond by changing tuition prices, as opposed to public colleges, which do not charge tuition. Thus, an increase in demand should have a weaker impact on the applicants to vacancies ratio for the former because – depending on their market power - they would be likely to increase tuition in response.
Summarizing, college quality is expected to increase with the ENC. Applicant to vacancies ratio, college size, and enrollment should be higher the better the ENC grade is, although its effect - on average - is ambiguous due to fiercer competition.
4 The Effect of the ENC on Colleges’ Quality
4.1 Empirical Method
and the independent variables. More generally, I am concerned with potential biases caused by time-specific or discipline-time-specific unobservable variables that may affect both the start of the ENC and college quality. Failure to account for such effects would bias the estimates of the impact of the ENC on college quality.
The policy I study allows me to use an empirical strategy that alleviates the biases discussed above. The ENC started being required for different disciplines in different years. Indeed, for every year in the sample, at least two disciplines were added to those covered by the ENC. Moreover, observations were collected at the college-municipality-discipline-year level. Thus, I control for state-year and college-municipality-discipline-fixed effects. Such an approach therefore helps to mitigate the effects of time- and discipline-specific unobservable variables on the year the ENC starts and college quality, while at the same time controlling for unobservable characteristics of college-municipality-discipline triples and time-varying characteristics of states.
Another concern might be the fact that new disciplines were announced one year before the exam in which they were introduced. Colleges might respond to these announcements before a discipline started being covered by the ENC, therefore biasing the results of this before and after analysis. Unfortunately, the data are not available for previous years, preventing me to control for such response. However, a significant part of the reaction to the ENC should be concentrated in the year it starts covering the relevant discipline because this is actually when grades start being published. Moreover, an anticipated response should bias the coefficient of the ENC towards zero in a regression analysis, if it does. Thus, a positive and significant estimate of the effect of the ENC on measures of college quality should still be interpreted as evidence of a positive impact.
The regressions in this section have the form:
ijkt t ijk jt ijkt
kt
ijkt
ENC
X
W
Y
=
α
+
β
+
Γ
+
Θ
+
γ
+
δ
+
ε
(1)Where
Y
ijkt is a measure of quality of college i in municipality j in discipline k and year t.α
,discipline k is covered by the ENC in period t and zero otherwise.
X
ijkt andW
jt are vectors containingcollege-municipality-discipline and municipality time-varying observables, respectively.
γ
ijk andδ
tare college-municipality-discipline- and time-fixed effects, respectively.
ε
ijkt represents acollege-municipality-discipline-year specific unobservable error.
For
Y
ijkt, I use two different groups of quality measures: faculty education and the number ofweekly hours they are employed at the college. These measures present an advantage over typical ones, such as the grades themselves, because they are not directly related to any action colleges may undertake in order to manipulate their grades, such as selecting only the best students to take the exam. Thus, they constitute accurate quality measures. The number of faculty members might also serve as a measure of quality. In fact, holding the number of students constant, a larger faculty body implies smaller classes and more attention to students. However, it is unclear whether faculty or class size is indeed a good measure of quality.23 Moreover, the number of faculty members also measures college size, and for these reasons, I analyze the effect of the ENC on faculty size in the next section only.
The vector
X
ijkt contains the number of students taking the exam and their percentagecompared to the total number of students graduating. The vector
W
jt includes the market structure andhigh-school students variables described in the previous section and shown in table 3.
The main coefficient of interest is
β
, which captures the effect of the ENC on colleges’ quality. A large coefficient implies a strong impact of the exam on product quality in this market.4.2 Descriptive Statistics
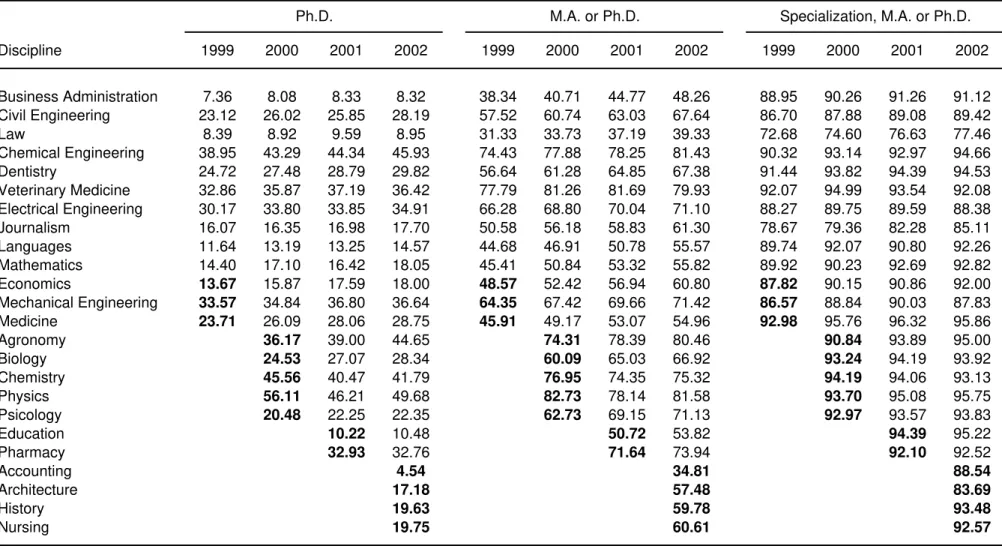
Tables 4 and 5 present the sample means of the dependent variables analyzed in this section over time and across disciplines. Numbers in bold correspond to disciplines covered by the ENC for the first time. Table 4 shows the average percentage of faculty members separated by their education.
23
Each of the three sets of four columns contains the average fraction with Ph.D. degrees, M.A. or Ph.D. degrees, and Specialization, M.A. or Ph.D. degrees, respectively, for each of the four years there are data. Faculty education increases over time for all the disciplines according to these three measures. Indeed, the 2002 averages exceed the 1999 averages without exception.
The contribution of the ENC to this improvement, however, is unclear. I can evaluate it by comparing, for example, the increase in the averages between two consecutive years when the ENC becomes available as opposed to when it is already available. Faculty education increases for most disciplines after the ENC becomes required. However, such an increase is also observed between consecutive years after the first with the ENC. Moreover, there are also examples in which faculty education actually decreases with the ENC and later starts increasing, such as the percentage of Ph.D.s in Chemistry.
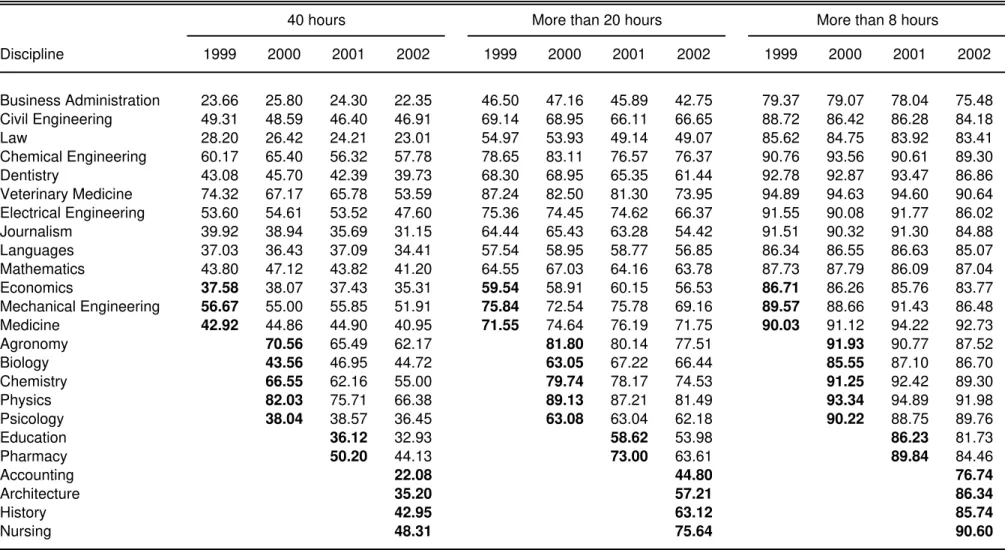
Table 5 presents the average percentage of faculty members discriminated by the number of weekly hours they are employed. These averages decrease over time for most cases. The impact of the ENC is unclear again. There is no obvious difference between changes when the ENC starts being required as compared to when it is already required. In summary, tables 4 and 5 do not provide definitive evidence that the ENC had a strong impact on college quality.
4.3 Regression Results
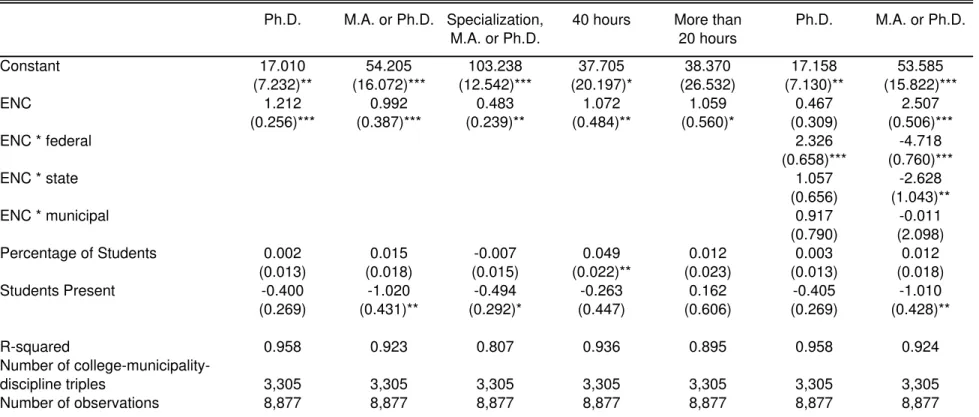
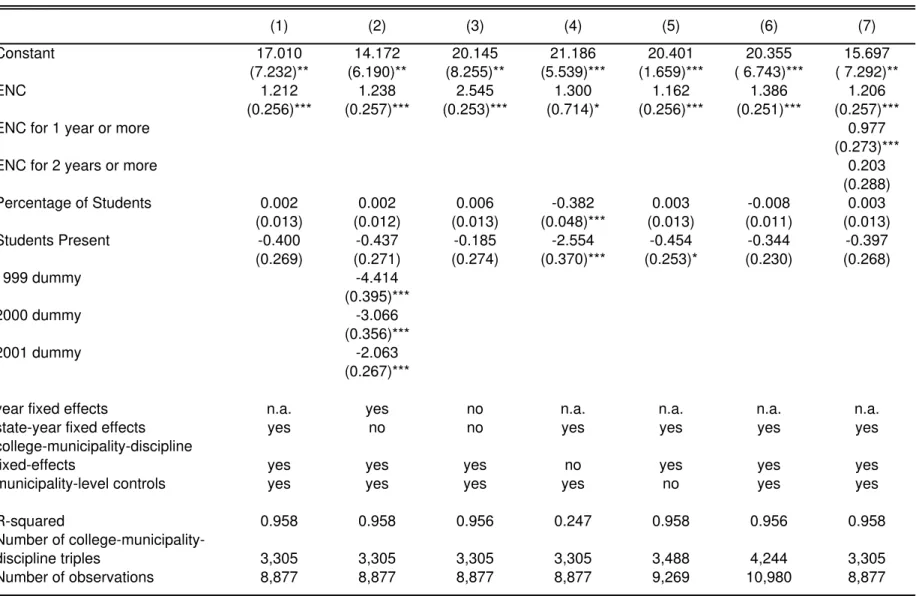
This subsection presents the estimates of the impact of the ENC on college quality. The first five columns of table 6 represent alternative measures of college quality. The five measures used are the percentages of faculty members with (1) Ph.D. degrees, (2) M.A.s or Ph.D.s, (3) specialization courses, M.A.s or Ph.D.s, and the percentage of faculty members employed for (4) 40 weekly hours and for (5) at least 20 hours. Columns 6 and 7 use the same dependent variables as 1 and 2 but also include interaction terms between the ENC and college ownership among the regressors. All specifications include the municipality-level variables described above as well as state-year fixed effects and college-municipality-discipline fixed effects among its independent variables. I cluster observations by municipality-year pairs in order to obtain robust standard error estimates.24 I also restrict the data used in these regressions to college-municipality-discipline triples with valid grades in every year the ENC covered the corresponding discipline.25 Later in this section I show that this restriction does not significantly affect my estimates.
The coefficient I am mainly interested in is the one for the ENC. It is always positive and statistically significant, confirming the predictions from section 3. In fact, the estimates imply a substantial effect of the ENC on college quality. The estimate from column 1 implies it causes colleges to increase the percentage of faculty members with Ph.D. degrees by 1.21. This is a large effect considering the sample mean is equal to 18.66% (see table 2). The impact of the ENC on other measures of faculty education is also significant, although smaller. According to column 2, the ENC causes the percentage of faculty members with M.A. or Ph.D. degrees to increase by 0.99, which is still relevant considering that the sample mean is equal to 54.58%. It also causes the percentage of
24
In order to account for potential serial correlation over the years, observations can be clustered by municipality or college-municipality-discipline triples. Standard errors then become larger than those reported in the paper, but the results are mostly robust. For example, the standard error for the ENC coefficient in the first column of table 6 goes from 0.256 to 0.297 and 0.323, respectively, but even with these changes this coefficient remains significant at the 1 percent level.
25
faculty members with specialization courses, M.A.s or Ph.D.s to increase by 0.48 according to column 3, where the mean value is equal to 89.93%.
Columns 4 and 5 show the results when the percentage of faculty members separated by the number of weekly hours of employment is used as a measure of college quality. Column 4 shows that the percentage of faculty members employed for 40 hours (full-time) increases by 1.07 percentage points, which is significant, considering the mean of 38.95%. The effect of the ENC is similar on the percentage of faculty members employed for at least 20 hours according to column 5. Similar but weaker results were obtained when the number of weekly hours spent teaching was used as the dependent variable.26 The ENC therefore has a significant impact on different measures of college quality. Such impact is consistent both with the effects of information disclosure, which gives colleges incentives to improve because applicants become able to identify college quality, and also with the effects of accountability, which provides similar incentives because rewards and penalties depend on grades.
Columns 6 and 7 repeat the specifications from columns 1 and 2, respectively, but also include interaction terms between the ENC dummy and ownership dummies. The ownership dummies correspond to federal, state, and municipal colleges, where private colleges are the reference group. The coefficients on the ENC and the interaction terms indicate that ownership determines colleges’ reactions to the ENC. The coefficients on the ENC are positive but differ in magnitude from their counterparts in columns 1 and 2. Interestingly, the coefficients on the interaction terms of federal and state colleges are positive when the dependent variable is the percentage of Ph.D.s (column 6) and negative when it is the percentage of M.A.s or Ph.D.s (column 7). The opposite signs of these coefficients are initially counterintuitive, but they are consistent with the fact that federal and state universities are in general better and employ more Ph.D.s on average. Thus, they should react to the ENC by hiring more Ph.D.s relative to municipal or private colleges.
26
Table 7 assesses the robustness of the results to different specifications. In order to facilitate comparison, the percentage of Ph.D.s is used as the dependent variable in all columns. In column 1, I repeat the results from the benchmark specification reported in column 1 of table 6. In column 2, I substitute the state-year fixed-effects for year fixed-effects.27 I include dummies for 1999 to 2001, while the year 2002 is left as the reference group. The coefficient on the ENC remains roughly unchanged. The coefficients on the year dummies strongly support my argument that one must control for time effects when studying such a policy change. The year dummies are all statistically and economically significant, negative and monotonically increasing. The fact that they are negative and monotonically increasing suggests that unobservable variables correlated with time must also be positively affecting college quality. The coefficients are large; for example, the –2.063 estimate for the 2001 dummy implies that moving from 2001 to 2002 has an impact on college quality much stronger than the ENC itself (1.238 estimate).
Column 3 provides additional evidence that ignoring time effects may overestimate the effect of the ENC. I use the same specification as in the previous column, but now I drop the year dummies. The estimate for the ENC coefficient is now 2.545, more than twice as large as the value from my benchmark. It is also the largest among all the specifications analyzed. In summary, failure to control for time effects may lead one to overestimate the effect of this policy change substantially.
In column 4, I drop the college-municipality-discipline fixed-effects. The results show that unobserved characteristics from those triples play an important role in determining their quality. The estimate on the ENC coefficient loses significance and becomes slightly larger than the one from the benchmark specification. More importantly, the regression now fits the data poorly; the R-squared drops from 0.958 to 0.247. In column 5, I repeat the benchmark specification but drop municipality-level controls. Such specification is important because it adds to the sample all the observations I could not match with the municipality-level data. The number of observations increases from 8,877 to
27
9,269, and the number of college-municipality-discipline triples goes from 3,305 to 3,488. Despite the larger sample, the coefficient on the ENC decreases negligibly: from 1.212 to 1.162. Column 6 repeats the benchmark specification again, but this time I also include in the sample college-municipality-discipline triples that did not receive a valid ENC score in every year. This sample therefore includes colleges that entered in recent years as well as those that did have classes graduating in the years sampled but for some reason were not assigned a valid score. The number of observations now increases from 8,877 to 10,980, and the number of college-municipality-discipline triples goes from 3,305 to 4,244. Once again, the coefficient on the ENC changes by a small value: from 1.212 to 1.386.
Column 7 returns to the specification and the sample of the benchmark regression, but now augmented in order to explore how colleges responded to the ENC over time. I add two dummy variables for whether a college-municipality-discipline triple’s ENC grades have already been published for at least one year and for at least two years. These dummies capture colleges’ responses to the ENC after one year the grades started being announced.28 The estimated coefficients indeed imply that the responses after the first year are still substantial. The coefficient on the dummy for at least one year is statistically significant and equal to 0.977, which is close to the estimate of 1.206 of the first year with grades announced. The estimates however also suggest that these responses are concentrated in the first two years: the coefficient on at least two years is not significant and much lower than the previous one, equal to 0.203.
Two conclusions can be taken from this last regression. First, the coefficient on the ENC remains roughly unchanged when those two dummies are included in the regression. It goes from 1.212 to 1.206 only; once again showing that the results from the benchmark specification are robust. Second, the fact that most of the estimated response is concentrated in the first two years after the ENC suggests that unobservable variables are not driving the results. If unobservables correlated with faculty education actually caused the start of the ENC across disciplines, then those results imply that
28
the introduction of this exam also matched with some precision those short intervals. Although possible, this is quite unlikely, especially considering that those intervals started in different years for different disciplines. Instead, it is much more reasonable to consider that the ENC actually caused colleges to improve the quality of their faculties.
5 The Effects of the ENC Grades on Competition for Admission, College Size and
Enrollment
5.1 Empirical Method
In this subsection I discuss the empirical strategy used to measure the impact of the ENC grades on student competition for college admission, college size and enrollment. I measure competition for admission by the ratio of applicants to vacancies, college size by the number of faculty members, and enrollment by the number of students entering each year. These variables constitute the dependent variables used in the regressions in this section. They are appropriate to assess the impact of the ENC for two reasons in particular. First, once again, they are not directly related to any action colleges may undertake in order to manipulate grades. Second, they are unlikely to be correlated with noise in colleges’ grades. Such noise makes grades - and variables correlated with them as well - subject to mean-reversion along the years. Mean-reversion may cause a spurious estimate of the effect of grades on any variable correlated with it. For instance, with mean reversion, a grade significantly below its historical mean is likely to improve in the next year, simply because grades vary around their means.29 Such effect, however, may be confounded with a real one depending on the variable used. I give particular attention to it because in this section I also measure the impact of different grades.
The regressions have the same form as in (1) but are now augmented by dummies for the ENC grades received by college-municipality-discipline triples. I include dummies for receiving grades of
29
B, C, D, or E in the previous year, respectively, where A is left as the reference group. I expect them to be negative and monotonically decreasing since college demand should be lower the worse the grade.
5.2 Results
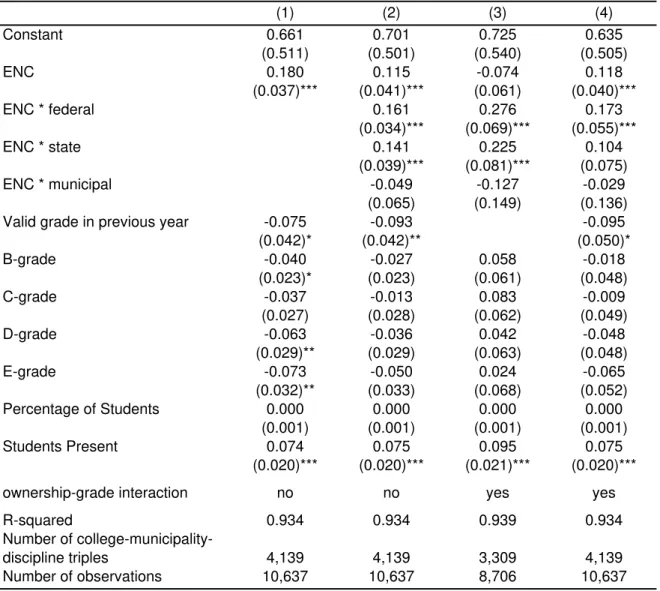
Table 8 presents the regression results using the natural logarithms of the ratio of applicants to vacancies, the number of faculty members, and the number of freshman students, respectively, in columns 1 and 2, 3 and 4, and 5 and 6. In the even columns I add dummies for the interaction between the ENC and federal, state, and municipal college ownership, leaving private colleges as the reference group. The sample used in this table is restricted to college-municipality-discipline triples with valid grades since the ENC started covering the respective discipline. A triple does not have a valid grade in a year the ENC already covered a discipline either if it did not have a senior class before and thus could not be evaluated, or if it did but for some reason - such as having few students graduating or present at the ENC - it did not in fact obtain a valid grade. In the appendix I show that these results are robust to the use of the unrestricted sample and also to the inclusion of dummies for the interaction between ownership and grades.
The estimates in the first column indicate that the ENC increases the ratio of applicants to vacancies for colleges in general, but this effect is weaker the lower the grade received, as expected. Since the reference group corresponds to triples that received an A in the previous year, the estimate of the ENC coefficient implies that the exam causes an 8.7% increase in that ratio for those colleges. The grade dummies are statistically significant for grades of D and E. The estimates imply a positive monotonic impact of grades on the applicants to vacancies ratio, with the exception of the 0.028 and -0.024 estimates for the B and C dummies, respectively. These results are consistent with applicants becoming better informed about the quality of colleges, having lower search costs, and also fearing entering a college that might close later on because of bad grades.
interaction dummies are large and statistically significant. The results imply that the ratio of students to vacancies remains the same for municipal and private colleges, while it increases by 17.1% and 14.7%, respectively, for federal and state colleges after the ENC. One possible explanation – as discussed in section 3 - is that the ENC increased college demand and that colleges’ responses to it varied depending on their ownership. While private ones may have increased tuition prices, federal and state colleges – which do not charge tuition – obviously did not. Thus the number of applicants to the latter should increase more.
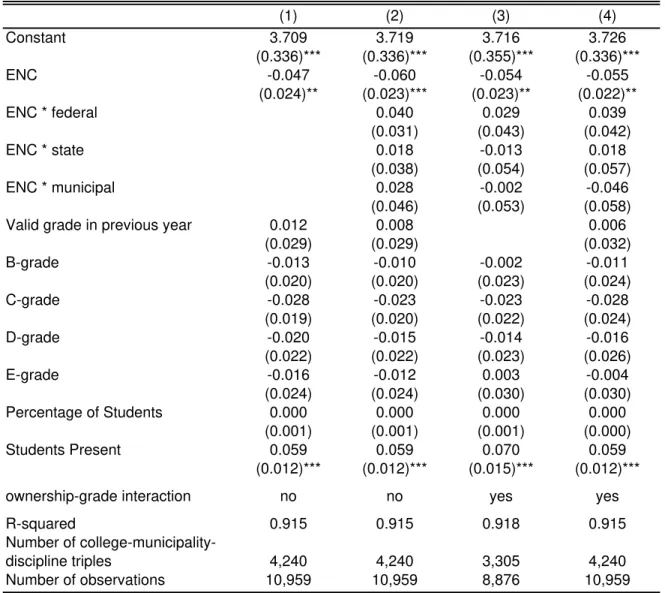
The introduction of the ENC negatively affects the size of the faculty body, as shown in columns 3 and 4. According to column 3, it causes the faculty size to decrease by 4.9%. The grade dummies are not found to be significant, having no clear effect on the number of faculty members. Similar results are found when entering class size is used as the dependent variable in columns 5 and 6. The ENC decreases by 4.3% the number of freshman students according to column 5. Different from the results when the ratio between students and vacancies is used as the dependent variable, the coefficients on the interaction dummies between the ENC and ownership are not significant in any specification in columns 4 and 6. Moreover, the coefficient on the ENC does not lose significance - and in fact becomes even larger – when those dummies are added to the regression. The results therefore indicate a negative impact of the ENC on size and enrollment, which is independent of college ownership.
As discussed in section 3, the potential impact of the ENC on size and enrollment was ambiguous. The result that it in fact lowered those variables therefore suggests that it fostered competition. It may have increased competition in this market by lowering consumers’ search costs, thus making them informed about the quality of more colleges when choosing where to apply. It may also have diminished the value of the reputation held by high-quality incumbents, thus allowing entrants to compete in better terms.30 They also suggest that applicant demand may have shifted from
30
incumbents to entrants because the latter were better, and this shift may have been reinforced by the threat of closing low-quality college-discipline pairs. This threat in fact favored entrants over incumbents because the penalties were based on the last three grades received. The record of grades was shorter for college-discipline pairs that had their first class graduating after the ENC started covering the respective discipline compared to incumbents. Therefore, the former could only be penalized at least one year after the latter. In any case, those results indicate a strong impact of the ENC on enrollment and college size.
Independently of whether the ENC affected student competition, enrollment and college size through information disclosure or accountability itself, two conclusions emerge from the analysis in this section. First, the results indicate that the ENC had a significant impact on the market equilibrium as measured by those variables. Second, the evidence also suggests that the ENC favored entrants in this market. The student enrollment and the size of colleges individually decreased with the ENC, despite the fact that the ENC increased the number of applicants per vacancies ratio and that there was a huge increase in the number of college students in the period. These apparently contradictory results can be reconciled if entrants absorbed more students, which is in fact consistent with the opening of new colleges during the period analyzed.
6 Conclusions
In recent years, public policy intended to improve education quality has been based primarily on accountability systems, particularly due to the No Child Left Behind Act of 2001. Those systems, however, have been mostly implemented in basic education, and as a consequence, research on the effects of accountability on higher education is scarce. This paper studied the effects of an accountability policy in the Brazilian college market. This policy was found to improve college
quality, increase the ratio of applicants to vacancies, and decrease the number of faculty members and the entering class sizes.
The robustness checks reinforced the importance of appropriate data to measure the effects of accountability and information disclosure policies. The detailed dataset and the fact that the ENC started being required for different disciplines in different years allowed me to control for time-specific effects. Time-time-specific effects were found to be large, and the estimated impact of the ENC on college quality differed significantly when I did and did not take those effects into account. Indeed, such policy changes may arise because consumers demand more information or quality over time, and estimates of their impact are subject to the bias caused by such endogeneity. Further research evaluating similar policies therefore should consider in particular whether the data allow the econometrician to control for policy endogeneity and thus, to obtain reliable estimates of their effects.
The results on the relation between accountability and entry raised some issues to be considered in further research and public policy. I found evidence of an uneven impact of the ENC, favoring entrants over incumbents. This evidence calls for more research on the competitive effects of accountability and information disclosure policies, which up to now has not given enough attention to differences in their impact among competing firms or schools. This bias had a particularly strong effect due to the massive college entry observed in the period. Further research and policy therefore should also consider changes in market structure when evaluating the effects of those policies.
It may have favored entrants by providing information about colleges that did not have a good reputation yet, or it may simply have fostered competition by lowering consumers’ search costs. Those questions, which relate to many industries where similar policies have been applied as well, are left for future research.
Appendix
In this appendix I test whether the results in table 8 are robust to the inclusion in the sample of college-municipality-discipline triples that did not have valid grade in every year and also to the inclusion of dummies for the interaction between grades and ownership. The results presented in tables A1, A2 and A3 were obtained using as the dependent variables, respectively, the natural logarithms of the ratio of applicants to vacancies, the number of faculty members, and the number of freshman students.
The first two columns in each of these tables correspond to the same specifications used in each pair of columns in table 8, but now I also include in the sample the triples that did not have valid grade in every year. I add to the specifications a dummy for having a valid grade in the previous year. The results in tables A1, A2 and A3 are roughly the same as those in table 8. In particular, the estimates of the coefficient on the ENC in table 8 are very close to the sums of the coefficients on the dummies for the ENC and for having a valid grade in the previous year in the respective columns in tables A1, A2 and A3. Therefore, the results presented in section 5 are not sensitive to changes in the sample used.
counterparts in column 2 of table 8. However, these differences are compensated by the estimates of the respective ENC coefficients. Thus, the implied effects of the ENC are roughly the same. Therefore, these robustness checks allow me to conclude that the results presented in section 5 are not sensitive to the inclusion of those interaction dummies as well.
References
Angrist, Joshua D. and Victor Lavy, “Using Maimonides’ Rule to Estimate the Effect of Class Size on Scholastic Achievement,” Quarterly Journal of Economics, vol. 114, no.2, May, 1999, pp. 533-575.
Arenson, Karen W., “Panel Explores Standard Tests For Colleges”, New York Times, February 9, 2006.
Bettinger, Eric and Bridget T. Long, “Do College Instructors Matter? The Effects of Adjuncts and Graduate Assistants on Students’ Interests and Success,” NBER working paper no. 10370, March, 2004.
Card, David, “The Causal Effect of Education on Earnings,” in Orley Ashenfelter and David Card (eds.), Handbook of Labor Economics, vol. 3A, Amsterdam: North Holland, 2000, pp. 1801-1863.
Chay, Kenneth Y., Patrick J. McEwan and Miguel Urquiola, “The Central Role of Noise in Evaluating Interventions that Use Test Scores to Rank Schools,” American Economic Review, vol. 95, no. 4, September, 2005, pp. 1237-1258.
Chipty, Tasneem and Ann Dryden Witte, “Effects of Information Provision in a Vertically Differentiated Market,” NBER working paper no. 6493, April, 1998.
Cullen, Julie B. and Randall Reback, “Tinkering toward Accolades: School Gaming under a Performance Accountability System,” working paper, Barnard College, January, 2006.
Deere, Donald and Wayne Strayer, “Putting Schools to the Test: School Accountability, Incentives, and Behavior,” Private Enterprise Research Center working paper no. 114, Texas A&M University, March, 2001.
Donovan, Colleen, David N. Figlio and Mark Rush, “Cramming: The Effects of School Accountability on College Study Habits and Performance,” working paper, University of Florida, April, 2006.
Dranove, David, Daniel Kessler, Mark McLellan and Mark Satterthwaite, “Is More Information Better? The Effects of “Report Cards” on Health Care Providers,” Journal of Political Economy, vol. 111, no. 3, June, 2003, pp. 555-588.
Ehrenberg, Ronald G. and Liang Zhang, “Do Tenured and Tenure-Track Faculty Matter?,” Journal of Human Resources, vol. 40, no. 3, Summer, 2005, pp. 647-659.
Figlio, David N., “Testing, Crime and Punishment,” forthcoming, Journal of Public Economics, 2005.
Figlio, David N. and Lawrence S. Getzler, “Accountability, Ability, and Disability: Gaming the System,” NBER working paper no. 9307, October, 2002.
Figlio, David N. and Cecilia E. Rouse, “Do Accountability and Voucher Threats Improve Low-performing Schools?,” Journal of Public Economics, vol. 90, no. 1-2, January, 2006, pp. 239-255.
Figlio, David N. and Joshua Winicki, “Food for Thought: The Effects of School Accountability Plans on School Nutrition,” Journal of Public Economics, vol. 89, no. 2-3, February, 2005, pp. 381-394.
Haney, Walt M., “The Myth of the Texas Miracle in Education,” Education Policy Analysis Archives, vol. 8, no. 41, August, 2000, (http://epaa.asu.edu/epaa/v8n41/).
Hanushek, Eric A. and Margaret E. Raymond, “Does School Accountability Lead to Improved Student Performance?,” NBER working paper no. 10591, June, 2004.
Hoffmann, Florian and Philip Hoffman, “Professor Qualities and Student Achievement,” working paper, University of Toronto, 2006.
Hoxby, Caroline M., “The Effects of Class Size on Student Achievement: New Evidence from Population Variation,” Quarterly Journal of Economics, vol. 115, no. 4, November, 2000, pp. 1239-1286.
Jacob, Brian, “Accountability, Incentives and Behavior: Evidence from School Reform in Chicago,” Journal of Public Economics, vol. 89, no. 5-6, June, 2005, pp. 761-796.
Jin, Ginger and Phillip Leslie, “The Effect of Information on Product Quality: Evidence from Hygiene Grade Cards,” Quarterly Journal of Economics, vol. 118, no. 2, May, 2003, pp. 409-451.
Kane, Thomas J. and Douglas O. Staiger, “The Promise and Pitfalls of Using Imprecise School Accountability Measures,” Journal of Economic Perspectives, vol. 16, no. 4, Autumn, 2002, pp 91-114.
Katz, Lawrence and David Autor, “Changes in the Wage Structure and Earnings Inequality,” in Orley Ashenfelter and David Card (eds.), Handbook of Labor Economics, vol. 3A, Amsterdam: North Holland, 2000, pp. 1463-1555.
Krueger, Alan, “Experimental Estimates of Education Production Functions,” Quarterly Journal of Economics, vol. 114, no.2, May, 1999, pp. 497-532.
Krueger, Alan, “The Effect of Attending a Small Class in the Early Grades on College-Test Taking and Middle School Test Results: Evidence from Project STAR,” Economic Journal, vol. 111, January 2001, pp. 1-28.
Mathios, Alan D., “The Impact of Mandatory Information Disclosure Laws on Product Choices: An Analysis of the Salad Dressing Market,” Journal of Law and Economics, vol. 43, October 2000, pp. 651-677.
Pitoli, Adriano and Paulo Picchetti, “O Problema da Assimetria de Informação no Mercado de Cursos Superiores – O Papel do Provão,” working paper, Universidade de São Paulo, April, 2005.
Rivkin, Steven G., Eric Hanushek and John F. Kain, “Teachers, Schools, and Academic Achievement,” Econometrica, 73(2), March 2005, pp. 417-458.
Figure 1
Annual College Enrollment (millions of students)
0.7 0.7 0.7 0.8 0.8 0.8 0.9 0.9 1.1 1 1.1 1.1 1.2 1.3 1.5
1.8 2.1
2.4
1994 1995 1996 1997 1998 1999 2000 2001 2002
Year
public private
Figure 2 Number of Colleges
218 210 211 211 209 192 176 183 195 633 684 711 689 764 905 1004
1208 1442
1994 1995 1996 1997 1998 1999 2000 2001 2002
Year
Discipline 1996 1997 1998 1999 2000 2001 2002 Total
Business Administration 303 347 374 419 443 493 613 2,992
Civil Engineering 89 103 104 109 116 122 128 771
Law 174 195 209 221 250 272 297 1,618
Chemical Engineering 41 42 43 46 47 51 270
Dentistry 82 81 85 90 102 113 553
Veterinary Medicine 33 34 38 44 50 58 257
Electrical Engineering 77 82 86 87 95 427
Journalism 79 92 97 113 130 511
Languages 342 361 375 412 468 1,958
Mathematics 262 272 278 315 348 1,475
Economics 167 176 180 185 708
Mechanical Engineering 70 73 74 78 295
Medicine 81 81 83 86 331
Agronomy 68 72 73 213
Biology 221 255 287 763
Chemistry 99 99 113 311
Physics 66 69 81 216
Psicology 117 123 135 375
Education 470 598 1,068
Pharmacy 84 107 191
Accounting 406 406
Architecture 96 96
History 281 281
Nursing 144 144
Total 566 801 1,604 2,040 2,726 3,522 4,971 16,230
Variable Mean Std. Dev. Min Max
Number of graduating students present 73.69 96.05 0 3,730 Percentage of students graduating 95.94 16.81 0 100
Candidates / vacancies ratio 5.80 8.33 0 137 Entering class size 120.73 165.20 0 9,165
Number of faculty members 40.86 42.13 1 831 Fraction of Ph.D.s 18.66 21.84 0 100 Fraction of M.A.s 35.92 18.25 0 100 Fraction of Specialized 35.81 24.29 0 100 Fraction of B.A.s 10.07 12.73 0 100
Fraction of 40 hours faculty 38.95 35.08 0 100 Fraction of 20 to 39 hours faculty 21.91 18.99 0 100 Fraction of 8 to 19 hours faculty 25.38 22.92 0 100 Fraction of up to 8 hours faculty 14.57 20.87 0 100
Fraction of 40 hours exercises 2.15 10.12 0 100 Fraction of 20 to 39 hours exercises 10.89 17.24 0 100 Fraction of 8 to 19 hours exercises 49.45 26.27 0 100 Fraction of up to 8 hours exercises 37.69 28.61 0 100
Number of Observations 19,890
Variable Mean Std. Dev. Min Max
High-School Male Public 919.84 3,047.42 16 54,658
Students Female Public 1,221.29 3,846.40 19 68,725
Total Public 2,141.12 6,888.57 40 123,383
Male Private 334.12 1,152.63 0 17,768 Female Private 399.81 1,333.09 0 20,155
Total Private 733.93 2,484.03 0 37,923
Total Number of Students 2,875.05 9,113.18 40 159,183
Colleges Universities 0.07 0.35 0 6
Universitarian Centers 0.09 0.44 0 8 Integrated Colleges 0.17 0.59 0 10 Single-course Colleges 1.45 3.91 0 58 Institutes of Higher Education 0.04 0.24 0 4 Centers of Technological Education 0.02 0.32 0 11
Total Private Nonphilanthropic 1.84 5.06 0 93
Universities 0.14 0.58 0 8
Universitarian Centers 0.05 0.27 0 3 Integrated Colleges 0.05 0.27 0 5 Single-course Colleges 0.52 1.59 0 26 Institutes of Higher Education 0.01 0.10 0 2
Total Private Philanthropic 0.78 2.37 0 38
Universities 0.10 0.31 0 2
Universitarian Centers 0.00 0.04 0 1 Single-course Colleges 0.02 0.16 0 2 Centers of Technological Education 0.03 0.18 0 1
Total Federal 0.15 0.49 0 5
Universities 0.07 0.27 0 2
Single-course Colleges 0.06 0.29 0 3 Institutes of Higher Education 0.00 0.06 0 1 Centers of Technological Education 0.02 0.14 0 1
Total State-owned 0.16 0.44 0 3
Universities 0.01 0.10 0 1
Universitarian Centers 0.00 0.05 0 1 Integrated Colleges 0.01 0.07 0 1 Single-course Colleges 0.12 0.40 0 4
Total Municipality-owned 0.13 0.42 0 4
Total Number of Colleges 2.98 7.09 0 110
Number of Observations 1,613
Discipline 1999 2000 2001 2002 1999 2000 2001 2002 1999 2000 2001 2002
Business Administration 7.36 8.08 8.33 8.32 38.34 40.71 44.77 48.26 88.95 90.26 91.26 91.12 Civil Engineering 23.12 26.02 25.85 28.19 57.52 60.74 63.03 67.64 86.70 87.88 89.08 89.42 Law 8.39 8.92 9.59 8.95 31.33 33.73 37.19 39.33 72.68 74.60 76.63 77.46 Chemical Engineering 38.95 43.29 44.34 45.93 74.43 77.88 78.25 81.43 90.32 93.14 92.97 94.66 Dentistry 24.72 27.48 28.79 29.82 56.64 61.28 64.85 67.38 91.44 93.82 94.39 94.53 Veterinary Medicine 32.86 35.87 37.19 36.42 77.79 81.26 81.69 79.93 92.07 94.99 93.54 92.08 Electrical Engineering 30.17 33.80 33.85 34.91 66.28 68.80 70.04 71.10 88.27 89.75 89.59 88.38 Journalism 16.07 16.35 16.98 17.70 50.58 56.18 58.83 61.30 78.67 79.36 82.28 85.11 Languages 11.64 13.19 13.25 14.57 44.68 46.91 50.78 55.57 89.74 92.07 90.80 92.26 Mathematics 14.40 17.10 16.42 18.05 45.41 50.84 53.32 55.82 89.92 90.23 92.69 92.82 Economics 13.67 15.87 17.59 18.00 48.57 52.42 56.94 60.80 87.82 90.15 90.86 92.00 Mechanical Engineering 33.57 34.84 36.80 36.64 64.35 67.42 69.66 71.42 86.57 88.84 90.03 87.83 Medicine 23.71 26.09 28.06 28.75 45.91 49.17 53.07 54.96 92.98 95.76 96.32 95.86 Agronomy 36.17 39.00 44.65 74.31 78.39 80.46 90.84 93.89 95.00 Biology 24.53 27.07 28.34 60.09 65.03 66.92 93.24 94.19 93.92 Chemistry 45.56 40.47 41.79 76.95 74.35 75.32 94.19 94.06 93.13 Physics 56.11 46.21 49.68 82.73 78.14 81.58 93.70 95.08 95.75 Psicology 20.48 22.25 22.35 62.73 69.15 71.13 92.97 93.57 93.83
Education 10.22 10.48 50.72 53.82 94.39 95.22
Pharmacy 32.93 32.76 71.64 73.94 92.10 92.52
Accounting 4.54 34.81 88.54
Architecture 17.18 57.48 83.69
History 19.63 59.78 93.48
Nursing 19.75 60.61 92.57
Table 4: Average Percentage of Faculty by Education Degree
Discipline 1999 2000 2001 2002 1999 2000 2001 2002 1999 2000 2001 2002
Business Administration 23.66 25.80 24.30 22.35 46.50 47.16 45.89 42.75 79.37 79.07 78.04 75.48 Civil Engineering 49.31 48.59 46.40 46.91 69.14 68.95 66.11 66.65 88.72 86.42 86.28 84.18 Law 28.20 26.42 24.21 23.01 54.97 53.93 49.14 49.07 85.62 84.75 83.92 83.41 Chemical Engineering 60.17 65.40 56.32 57.78 78.65 83.11 76.57 76.37 90.76 93.56 90.61 89.30 Dentistry 43.08 45.70 42.39 39.73 68.30 68.95 65.35 61.44 92.78 92.87 93.47 86.86 Veterinary Medicine 74.32 67.17 65.78 53.59 87.24 82.50 81.30 73.95 94.89 94.63 94.60 90.64 Electrical Engineering 53.60 54.61 53.52 47.60 75.36 74.45 74.62 66.37 91.55 90.08 91.77 86.02 Journalism 39.92 38.94 35.69 31.15 64.44 65.43 63.28 54.42 91.51 90.32 91.30 84.88 Languages 37.03 36.43 37.09 34.41 57.54 58.95 58.77 56.85 86.34 86.55 86.63 85.07 Mathematics 43.80 47.12 43.82 41.20 64.55 67.03 64.16 63.78 87.73 87.79 86.09 87.04 Economics 37.58 38.07 37.43 35.31 59.54 58.91 60.15 56.53 86.71 86.26 85.76 83.77 Mechanical Engineering 56.67 55.00 55.85 51.91 75.84 72.54 75.78 69.16 89.57 88.66 91.43 86.48 Medicine 42.92 44.86 44.90 40.95 71.55 74.64 76.19 71.75 90.03 91.12 94.22 92.73 Agronomy 70.56 65.49 62.17 81.80 80.14 77.51 91.93 90.77 87.52 Biology 43.56 46.95 44.72 63.05 67.22 66.44 85.55 87.10 86.70 Chemistry 66.55 62.16 55.00 79.74 78.17 74.53 91.25 92.42 89.30 Physics 82.03 75.71 66.38 89.13 87.21 81.49 93.34 94.89 91.98 Psicology 38.04 38.57 36.45 63.08 63.04 62.18 90.22 88.75 89.76
Education 36.12 32.93 58.62 53.98 86.23 81.73
Pharmacy 50.20 44.13 73.00 63.61 89.84 84.46
Accounting 22.08 44.80 76.74
Architecture 35.20 57.21 86.34
History 42.95 63.12 85.74
Nursing 48.31 75.64 90.60
Table 5: Average Percentage of Faculty by Number of Weekly Hours Employed
Ph.D. M.A. or Ph.D. Specialization, 40 hours More than Ph.D. M.A. or Ph.D. M.A. or Ph.D. 20 hours
Constant 17.010 54.205 103.238 37.705 38.370 17.158 53.585 (7.232)** (16.072)*** (12.542)*** (20.197)* (26.532) (7.130)** (15.822)***
ENC 1.212 0.992 0.483 1.072 1.059 0.467 2.507
(0.256)*** (0.387)*** (0.239)** (0.484)** (0.560)* (0.309) (0.506)***
ENC * federal 2.326 -4.718
(0.658)*** (0.760)***
ENC * state 1.057 -2.628
(0.656) (1.043)**
ENC * municipal 0.917 -0.011
(0.790) (2.098) Percentage of Students 0.002 0.015 -0.007 0.049 0.012 0.003 0.012
(0.013) (0.018) (0.015) (0.022)** (0.023) (0.013) (0.018) Students Present -0.400 -1.020 -0.494 -0.263 0.162 -0.405 -1.010 (0.269) (0.431)** (0.292)* (0.447) (0.606) (0.269) (0.428)**
R-squared 0.958 0.923 0.807 0.936 0.895 0.958 0.924 Number of
college-municipality-discipline triples 3,305 3,305 3,305 3,305 3,305 3,305 3,305 Number of observations 8,877 8,877 8,877 8,877 8,877 8,877 8,877
Note: All specifications include municipality-level regressors, state-year and college-municipality-discipline fixed-effects. Observations are clustered by municipality-year pairs. Standard errors in parethesis. *, **, *** denote significance at the 90, 95, and 99 percent levels, respectively.