CHARACTERISATION AND TECHNICAL EFFICIENCY OF PORTUGUESE
WINE FARMS
Carvalho M. L. 1, Henriques P.D. 2 , Costa F.3 and Pereira R. 4
1 University of Évora/Department of Economics/ICAM/CEFAGE/leonor@uevora.pt, Évora, Portugal 2
University of Évora/Department of Economics/pdamiao@uevora.pt, Évora, Portugal 3
Ministry of Agriculture/GPP/ fatimacosta@gpp.pt, Lisbon, Portugal 4
Ministry of Agriculture/GPP/ rpereira@gpp.pt, Lisbon, Portugal
Abstract — This study aims to characterise the
evolution of vineyard production, to measure the levels of technical efficiency, and to relate these with farmers and farms attributes. The sample used is composed of a panel of vineyard farms, for the period 2000-2005, belonging to Portuguese Alentejo region. The methodology used to estimate technical efficiency, was the stochastic production frontier.
The results showed that there are room to improve the levels of technical efficiency in input use and that efficiency is variant with time. It was observed that technical efficiency increases with economic size and net farm income, as well as with family entrepreneurship.
Keywords— efficiency, parametric, vineyard
I. INTRODUCTION
Vineyard and wine production have an important role in the production structure of Portuguese and European Union agriculture. The greatest EU wine producers are the Mediterranean countries, representing around 90% of the Union production, 96% of the area, and 88% of the production value. For these amounts, Portugal contributes with 4% in production, 7% in area and 3.2% in production value.
Portugal ranks the tenth place among the fifteen main world wine producers and over the period 2001/03 ranked the seventh position on world wine exports. The increase on competitiveness, particularly with the entrance of new producers and new consumer patterns, brought about a stagnation of the value generated by Portuguese wine exports.
Vineyard and wine production represented about 10% of the total agriculture output in 2000 and 13.9% in 2004. For the period 2001 to 2003, self-consumption was of 118%, exports were 1.76 times imports, and per capita consumption was 49.3 litters.
Small size with a high number of plots by farm is the rule, which is a limitative factor to the profitability of the wine farms. Very small and small farms are dominant. In absolute terms, the large farms represent almost 25% of the total area (around 42 000 ha).
Wine producers are old, prevailing individual producers with more than 50 years old, and only 4% of the area is exploited by farmers with less than 35 years old. About 25% of the farmers do not have any level of education, and more than 50% do not have more than the basic education. The Alentejo is the region where the farmers have the greatest levels of education. Labour costs are similar to variable costs for specialized wine farms, while for unspecialized farms the weight of the labour costs is inferior.
In regions such as Alentejo, where the production of quality wines is dominant, farms specialized in quality wine have almost the double of the income obtained by those unspecialized. The production of quality wines such as VQPRD and DOC, has been increasing in recent years, as a result of the improvement of production conditions, of higher consumer demanding in quality and higher intra-sector competitiveness. Vineyard productivity is about 28 hl/ha, and 45% of the total area is dedicated to quality wines. Adding regional wines, this percentage rises to 65%.
The entrepreneurship structure is diversified, with family farms, some economic groups of international size and some operatives wine cellars. The co-operative sector contributes to about half of the national output, and performs an important activity of concentration and marketing for an expressive number of producers.
Concerning the Alentejo region, it contributes to approximately 15.7% of the national agriculture output. In 1999, the vineyard activity represented around 14.7% of the number of farms with permanent
crops and occupied 10.3% of the area with permanent crops. Between 1989 and 1999, the vineyard area has increased around 30%. In 2000, the wine production represented 5% of the region agricultural output and contributed with 7% and 8% to national wine production in volume and value, respectively.
Unlike the country where the table wine production (with lower value added) represents 33.2% of the total output, this one is residual in the Alentejo, 2.2%. The region produces wines with superior quality, mostly type VQPRD and regional wine, with a weight of 44.9% and 52.7% on total, respectively. The proportion between red and white wine was of 60% in 2000, lower than national average (67%).
During the last decade with the entrance of new producers, the production and marketing structure have changed, with an increase in the number of wine producers. Some of the established producers made their production autonomous from the co-operatives with the creation of own cellars and brands. The importance of vineyard activity and wine production has been increasing, demanding for attention to its different aspects, in particular to farm efficiency.
In summary, the wine sector pays an essential role in the structure of the Portuguese agriculture, particularly in the Alentejo region. The national and international competitiveness of the farms in the sector depends, among other factors, on their production efficiency. Thus, the objective of this paper is to characterise the productive structure of the wine farms of the Alentejo region, to evaluate their technical efficiency and to identify some of the factors that can explain their inefficiency
II . METHODOLOGY
Most of the literature about efficiency is based on Farrell’s pioneer paper (1957). Efficiency is measured as the deviation relatively to the best production performance of a given representative set of producers. The best performance corresponds to the production frontier (PF). The same author has also introduced the distinction between technical efficiency (TE) and price or allocative efficiency (PE). Technical efficiency of a farm is its deviation from production frontier, while price efficiency is the distance relatively to the conditions of profit maximization or
cost minimization. Economic efficiency is reached when both technical and price efficiencies are satisfied.
In the presence of panel data, Pitt and Lee (1981) used the original specification of Aigner, Lovell and Schimdt (1977) for a semi-normal distribution of the component measuring the efficiency:
( )
yit xit. vit uitln = β+ − (1)
with i=1,2,,N farms, and t=1,2,…,T moments in time, where yi is the level of production of farm i, xi is the
input of farm i, β is a (kx1) vector of parameters to be estimated, the random terms vi represent the
component associated to the stochastic production and the component ui measures the technical efficiency of
farm i.
Battese and Coelli (1992) proposed a similar model, where the ui have a random truncated normal
distribution, which can vary with time in an exponential way and having only a parameter to be estimated. The previous equation is estimated, with the following constraint for the terms of the technical inefficiency:
[
]
{
}
itit exp (t T) u
u = −η − (2)
with i=1,2,N farms; and t=1,2,3,…T periods of time. The ui’s are non-negative random variables
contributing to the production technical inefficiency, are i.i.d. and have a normal distribution with mean µ and varianceσ2u, while η is a parameter to be estimated.
For this, the authors utilised the parameterization of Battese and Corra (1977) where σ2= σ2V + σu2 and γ=
2 u
σ /( σ2v+ σu2), that is, 0<= γ <=1. We can test if there is inefficiency, using the parameter γ (H0:γ =
0versus H1: γ > 0).
In this model the following constraints can be imposed: 1) if η be equal to zero, the efficiency is invariant with time, if η be different from zero, the efficiency varies with time; and 2) if µ be zero, the ui’s
have a semi-normal distribution and if be different from zero, the ui’s have a normal truncated distribution
(Battese and Coelli, 1989). For testing the above hypothesis, the generalized likelihood ratio test (LR) can be used. This test, in general, uses to have a
2
truncated for the positive and zero values, then that error distribution is a mixed χ2, having the critical values been defined by Kodde and Palm (1986).
According to Coelli (1989), the statistic for the LR test is computed by the following expression:
[
]
{
lnL(H )/L(H )}
2{
ln[
L(H )] [
lnL(H )]
}
, 2LR=− 0 1 =− 0 − 1
where L(H0) and L(H1) are the values of the likelihood function, respectively, under the null and the alternative hypothesis.
The software FRONTIER 4.1 was utilised to estimate the stochastic production frontier and the levels of efficiency of each farm.
III. CHARACTERISATION OF THE VINEYARD FARMS
Data for this study are composed of a sample of 22 farms, for the 2000-2005 period, belonging to the Alentejo region. All farms produce grape for wine, being the whole production sold to co-operative wine-cellar. These farms are enrolled in the European Farm Accounting System.
The majority of the farmers, 82%, has a level of education inferior to the compulsory one, while only 9% has higher education. About 55% of producers are less than 50 years old, whereas 31.8% are more than 60 years old.
Owned farms represent 54.5% of the sample, 9.1% are rented and 36.4% have other forms of ownership. The area of farms varies from a minimum of 7.1 to a maximum of 171.9 hectares, being the average area of 61.9 hectares. From this area, 53.2% is owned, 11.7% is irrigated and 26.4% is occupied with vineyards. Around 54.5% of the farms have irrigated land, varying from 71.5% to 2.2% of total area.
In average, farms utilise 2.3 annual working units (AWU), 1 AWU from family and 1.3 AWU from hired labour. However, around 60% of the farms utilise more than 80% of non-hired labour.
In the costs structure, the weight of variable costs (49.8%) is similar to the weight of fixed costs (50.2%). In variable costs, 33.9% are due to machinery and equipments, 39.6% to crop activities, 3.8% to animal activities and 22.75% to other costs. Regarding fixed costs, depreciation corresponds to 67.4% and labour to 19%.
About 68% of the farms finance their production activity with loans. The majority of the loans is of short term, and only 14% of the farms have long term credit to finance their investments. The average investment by farm, for the period, was around 90,000 €. Among the farms that realized investments, only 40% received investment subsidies. The investment structure is dominated by machinery and equipments (67%) and by plantations (28%).
As expected, the composition of the product is dominated by revenues from crop production (77.3%), animal production is residual (2.1%) and the remaining is due to diverse product. For this, current subsidies represent about 75.5%, or, when expressed in terms of total product, 15.2% of the total vineyard farm income. The revenues from vineyard activity represent 78.2% of crop production.
The profitability in terms of farm gross added value allows to say that, in average, farms produce 1,308 € per hectare of arable land and about 20,436 € per AWU.
IV. RESULTS
The estimated stochastic production frontier is the one given by equations 1 and 2. The dependent variable named PRO represents the gross agricultural output, including subsidies. The regressor variables utilized were: 1) agricultural arable land (SAU); 2) labour quantity in annual hours (AWU); 3) total costs with machinery and equipments (CME); 4) and the specific costs of crops (EEC). The proposed model is given by:
ln(PROit) = β0 + β1ln(SAUit) + β2ln(UTAit) +
β3ln(CMEit) + β4ln(EECit) + Vit - Uit, with i=1,2,…,22
farms, and t=1,2,…,6 time periods.
The choice of the model that better fits to the data is done utilizing the test LR. The alternative hypothesis (H1) corresponds to the less restrictive model, µ≠0 and η≠0. The first null hypothesis to be tested is if exist an explicative term of efficiency, γ =0 versus γ≠0.If this hypothesis is rejected, the different options, relating µ and η, have to be tested, as presented on Table 1. This table presents the value of the LR test for each one of the H0 considered. We can conclude
that for the first hypothesis (µ=0, η=0 e γ=0), as well the other three are rejected. So, the model
corresponding to the alternative hypothesis (µ≠0 e
η≠0) cannot be rejected. This means that the efficiency
term has a normal truncated distribution and that the efficiency varies with time.
Table 1 – Tests for Selection of the Model
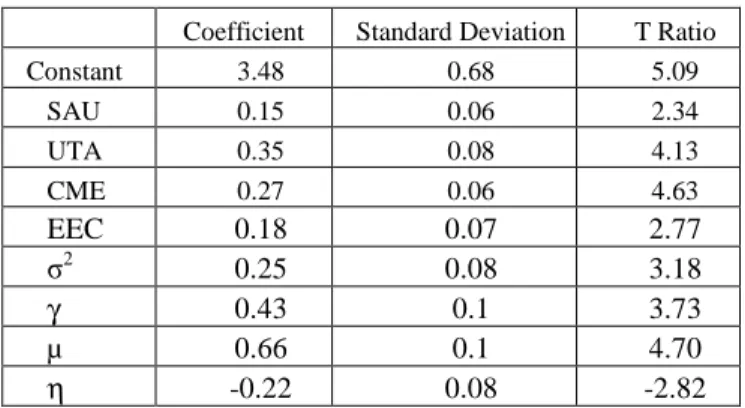
H0 H1 LR Test DF Critical Value Decision µ=0, η=0; γ=0 µ≠0; η≠0 31.26 3 7.045 Reject H0 µ=0 and η=0 µ≠0; η≠0 22.42 2 5.138 Reject H0 µ=0 and η≠0 µ≠0; η≠0 4.56 1 2.706 Reject H0 µ≠0 and η=0 µ≠0; η≠0 22.4 1 2.706 Reject H0 The maximum likelihood estimation of the variables included on the selected model, as well as the parameters, is presented on Table 2. All the variables and parameters are significant, for a 95% confidence level. The parameter η is negative, indicating that the technical efficiency decreases with time. The sum of the coefficients is equal to 0.95, revealing that we are facing decreasing returns to scale.
Table 2 – Parameters of the Model (η≠0 and µ≠0)
Coefficient Standard Deviation T Ratio
Constant 3.48 0.68 5.09 SAU 0.15 0.06 2.34 UTA 0.35 0.08 4.13 CME 0.27 0.06 4.63 EEC 0.18 0.07 2.77 σ2 0.25 0.08 3.18 γ 0.43 0.1 3.73 µ 0.66 0.1 4.70 η -0.22 0.08 -2.82
Figure 2 shows, for each farm, the technical efficiency estimated for each considered year. As indicated by parameter η, -0.22, the technical efficiency presents a decreasing trend, with an average value of 79.3% in 2000 and of 52.0% in 2005.
Based on average efficiency of each farm, it was tested the relation among efficiency and some farm attributes like age, level of education, class of area, percentage of rented land on total, percentage of family AWU on total, percentage of vineyard area on total, agri-environmental measures of production, percentage of vineyard output on total output, percentage of subsidies on total output, economic size,
producer legal status, land ownership, gross added value (GAV), net farm income (NFI), investment in permanent crops and existence of irrigated land.
0.200 0.300 0.400 0.500 0.600 0.700 0.800 0.900 1.000 1 3 5 7 9 11 13 15 17 19 21 Exploração E fi c iê n c ia 2000 2001 2002 2003 2004 2005 Farm T e c h n i c a l E f f i c i e n c y
Figure2 – Efficiency by Farm, 2000 to 2005
For each one of these attributes, classes or groups were built. The tests of analysis of variance and of Kruskal-Wallis were used in order to associate the levels of technical efficiency with selected attributes. The test of analysis of variance compares the variation with groups and among groups, and the test of Kruskall-Wallis brings about the analysis of variance based on the grouping (ranking) of the levels of efficiency.
The results showed that the averages for the considered groups on economic size, legal status and net income are statistically significant. It was observed an increase on technical efficiency with an increase on economic size and net farm income. Family farms are more efficient than commercial farms.
The levels of efficiency do not depend significantly on the other considered items. However, we can say that farms are more efficient when: producers are less than 50 years old or more than 60 years old, and have more than the compulsory education; farms size and vineyard land increase; gross value added and vineyard product value increase; farms benefit from agri-environmental measures; and farms are owned or rented.
V. CONCLUSIONS
The vineyard activity has a strategic importance for Portuguese agriculture and Alentejo region due to its role in creation of wealth, both in terms of production value and exports. Land structure is atomized, vines are aged and producers are old and with inadequate education levels.
The objective of this study was to characterise the production structure, to estimate the levels of technical efficiency and understand the principal causes of inefficiency for a sample of vineyard farms of Alentejo region belonging to the European farm accounting system.
The farms analysed have an average area of 62 ha from which 26.4% are occupied with the vine activity. All farms sell the grapes to cooperative wine cellar. Producers show low levels of education and almost 50% are less than 50 years old. The majority of labour used is family labour. The proportion between variables and fixed costs are similar. Costs with crop activities and depreciation are the major contribution for variable costs and fixed costs, respectively. Almost all farms made investments, which are dominated by machinery and permanent crop plantations. The income generated is dominated by the revenues from crop activities, principally from vineyard activity.
The results obtained, using a stochastic production frontier, show that technical efficiency is time variant, there is room to improve technical efficiency of vineyard farms and technical efficiency increases with size, family entrepreneurship and farm profitability.
As referred before all farms send their grapes production to cooperative wine cellars. These cooperatives show weakness in their management, qualification and access to international markets. For the vineyard farms studied, it is not only important an improvement in their production efficiency, both in terms of input use and vine renewal, but also that wine cellar cooperatives have a persistent improvement in marketing, value creation, maintenance and conquest of new external markets.
REFERENCES
1. Farrell M J (1957) The Measurement of Productive Efficiency. Journal of the Royal Statistical Society 120: 253-281.
2. Pitt M, Lee F (1981) The Measurement and Sources of Technical Inefficiency in the Indonesian Weaving Industry. Journal of Development Economics 9: 43-64. 3. Aigner D, Lovell C, Schmidt P (1977) Formulation and
Estimation of Stochastic Frontier Production Function Model. Journal of Econometrics 6: 21-36.
4. Battese G, Coelli T J (1992) Frontier Production Functions, Technical Efficiency and Panel data: with applications to Paddy Farmers in India. The Journal of Poductivity Analysis 3: 153-169.
5. Battese G, Corra G (1977) Estimation of a Production Frontier Model: With Application to the Pastoral Zone of Eastern Australia. Australian Journal of Agricultural Economics 21: 169-179.
6. Battese G, Coelli T J (1988) Prediction of Firm-Level Technical Efficiencies with Generalized Frontier Production Function and Panel Data. Journal of Econometrics 38: 387-399.
7. Kodde D, Palm F (1986) Wald Criteria for Jointly Testing Equality and Inequality Restrictions. Econometrica 54, 5:. 1243-1248.
Corresponding author
Maria Leonor da Silva Carvalho
University of Évora, Department of Economics Largo dos Colegiais, 2
7000 Évora Portugal