Clarifying What Is a Safe Haven:
An Application to the Gold
Market
Final report in Dissertation form
Presented to Universidade Católica Portuguesa To obtain a Finance Master's degree
by
Ana Matos
Under the guidance of Professor Carlos Santos
Universidade Católica Portuguesa – Porto – Faculdade de Economia e Gestão September 2015
Acknowledgements
To my dissertation advisor, Professor Carlos Santos, for the constant support, advice, flexibility and understanding, during the dissertation’s development.
To my friends and colleagues within and outside the university, for transmitting me their confidence and support, and in particular to those, who have inspired me with their academic example.
To my family, for doing their best in enabling the necessary conditions favourable to the prosecution of this dissertation, even under challenging circumstances.
Abstract
In this thesis, a new approach to the notion of safe haven is developed, building on earlier innovative work by Paulos (2015), and departing from the widely used Baur and Lucey (2010) benchmark. It is our view that such a benchmark neglects the flight-to-quality property a safe haven asset should have. As such, we suggest implications for risk preferences in safe haven assets namely in their possible flight to quality property, we develop a method to test such preferences, and we conduct an extensive study, for a large class of assets, on whether or not gold could be perceived as a safe haven with respect to them. Gold was chosen for this application for the purposes of comparison with similar studies in the Baur and Lucey (2010) tradition. The role of volatility is extensively discussed, and explicitly incorporated in the definition of safe haven, shifting from the correlation between returns paradigm.
Our analysis finds out that when the safe haven definition is extended in the ways we have suggested, gold is a safe haven against a wide variety of financial assets. This result differs from the existing literature, but makes perfect sense in our sample period (2008-2013), which comprises the financial crisis of 2007-08 and the European debt crisis.
The debate between gold as a hedge and as a safe haven is also analysed. The prevailing dichotomy between such roles in the literature is broken, since our approach to safe haven uses volatility measures, whilst the previous paradigm was based on assets’ returns. As such, we find that there were subperiods where gold did perform the role of hedge, but we do not find a contradiction between that and the role of safe haven for the entire sample period.
Resumo
Nesta dissertação, é desenvolvida uma nova abordagem ao conceito de ativo de refúgio, com base na intuição inovadora presente em Paulos (2015), e abandonando a referência conceptual dominante na literatura, formalizada por Baur e Lucey (2010). Na nossa perspetiva, essa referência negligencia a propriedade da “preferência pela qualidade” própria dos ativos de refúgio. Deste modo, sugerimos implicações nas preferências dos agentes quanto ao risco que um ativo desta tipologia terá, desenvolvemos uma metodologia para testar essas preferências e conduzimos um amplo estudo, para uma larga classe de ativos, sobre se o ouro pode ou não, de acordo com a nova proposta conceptual, desempenhar a função de refúgio face a estes. O ouro é escolhido para possibilitar a comparação com os resultados de estudos que seguem a tradição de Baur e Lucey (2010). O papel da volatilidade é extensivamente analisado e incorporado de forma explícita na definição de ativo de refúgio, mudando o paradigma face à mera análise da correlação entre retornos.
Neste estudo encontramos evidência que demonstra que o ouro é um refúgio face a todos os ativos testados, no âmbito da nossa proposta de conceito. Este resultado empírico difere da literatura existente, mas parece coerente com os eventos do período amostral (2008-2013), que compreende a crise financeira de 2007-08 e a crise das dívidas soberanas na Zona Euro.
O debate entre as funções de ativo de refúgio versus elemento de cobertura de risco que o ouro pode desempenhar é também analisado. A dicotomia prevalecente entre as duas funções na literatura é abandonada, na medida em que a nossa definição de ativo de refúgio assenta em volatilidades, enquanto a abordagem dominante assentava na correlação entre taxas de retorno. Assim, na amostra temporal considerada encontramos subperíodos em que o ouro foi um elemento de cobertura de risco, mas este resultado não traduz qualquer contradição com o papel de ativo de refúgio que o ouro desempenha na totalidade o período amostral.
Palavras-chave: ativo de refúgio; cobertura de risco; ouro; preferência pela qualidade; volatilidade.
The beauty of gold is, it loves bad news.
Table of Contents
Acknowledgements ... iii
Abstract ... v
Resumo ... vii
Table of Contents ... xi
List of Figures ... xiii
List of Tables ... xv
Introduction ... 17
Background and purpose ... 17
Methods and main contributions ... 17
Dissertation’s structure ... 18
1. Literature Review ... 20
1.1. Defining safe haven and hedge ... 20
1.2. Identifying and measuring a safe haven asset ... 23
1.2.1. Measuring asset relations ... 23
1.2.2. Measuring market stress... 24
1.2.3. Methodology particularities... 25
1.3. Evidences of safe haven and gold ... 26
1.3.1. Evidences of gold and its potential safe haven or hedge properties 26 1.3.2. Evidences of other financial assets as safe haven or hedge ... 27
2. Methodology ... 29
2.1. Definitions ... 29
2.1.1. Hedge ... 29
2.1.2. Safe haven ... 30
2.2. Econometric model ... 32
2.2.1. Hedge and DCC-MGARCH ... 32
2.2.2. Safe haven and GARCH-X ... 32
2.2.3. Flight to quality and DCC-MGARCH and GARCH-M ... 33
3. Empirical Analysis ... 34
3.1. Data caractherisation ... 34
3.1.1. Sample contextualisation ... 35
xii
3.2.1.1. Forex market – strong positive correlation ... 36
3.2.1.2. Stock market indexes – medium positive correlation ... 37
3.2.1.3. Government bond market – positive/negative correlation ... 39
3.2.1.4 Credit derivatives – negative correlation ... 40
3.2.2. Gold as safe haven ... 41
3.2.2.1. Stock market indexes ... 41
3.2.2.2. Low vs high risk security ... 43
3.2.2.3. Diverse securities ... 45
3.2.3. Gold as a flight to quality ... 47
3.2.3.1. Analysis of asset volatility level ... 47
3.2.3.2. Testing risk aversion on gold market ... 50
4. Conclusions ... 52
References ... 54
Appendixes ... 57
List of Figures
Figure 1: Conditional correlation of Gold and USD/EUR ... 36
Figure 2: Conditional correlation of Gold and FTSE100 ... 37
Figure 3: Conditional correlation of Gold and ATHEX ... 38
Figure 4: Conditional correlation of Gold and EMU ... 39
Figure 5: Conditional correlation of Gold and CDS U.S. Treasury ... 40
Figure 6: Conditional volatility of Gold and FTSE100 ... 48
Figure 7: Conditional volatility of Gold and CDS U.S. Treasury ... 49
List of Tables
Table 1: Estimation results for EURONEXT100, S&P500 and FTSE100 ... 41
Table 2: Estimation results for EURONEXT100, S&P500 and FTSE100 - Reverse Causality Test ... 42
Table 3: Estimation results for German Bund 10 yr and ATHEX Index ... 43
Table 4: Estimation results for German Bund 10 yr and ATHEX Index - Reverse Causality Test ... 44
Table 5: Estimation results for USD/EUR, CDS U.S. T. and EMU ... 45
Table 6: Estimation results for USD/EUR, CDS U.S. T. and EMU - Reverse Causality Test ... 46
Table 7: Estimation results for Gold market ... 50
Table 8: Gold tested against other assets ... 53
Introduction
Background and purpose
Financial markets have been presenting turbulence since The Global Financial Crisis of 2007-08, which intensified with the collapse of Lehman Brothers. These events have raised risks within the financial system and potentially reinforced the need for safe haven and hedge. There has been increasing research on both safe haven and hedge, which differs in conceptualization: some authors suggest investors purchase safe haven assets when uncertainty increases (2006), while other (2010) associate both safe haven and hedge with zero or negative correlation between asset returns, which seems to point to an attempt to oppose or compare both concepts.
This paper aims to clarify safe haven definition, by distinguishing it from hedge and by investigating the potential role of gold as safe haven within financial market turbulence.
Gold is chosen as a candidate to safe haven, for two main reasons: literature evidence suggests gold serving as a safe haven in financial markets; moreover, the nominal gold price has risen since the referred financial crisis, which is impressive by itself in a crisis context but also given the losses suffered in other asset classes.
Methods and main contributions
This paper builds on the innovative work of Paulos (2015), where the aim was to study and assess the evolution of gold market as a safe haven asset or as a hedge instrument, in periods of high volatility in stock and forex markets, by using univariate GARCH (1,1) model. We extend this analysis in a number of significant ways.
18
Firstly, we pursue a multi-class asset analysis where further asset types are included, testing not only stock and forex markets, but also including government bonds and credit derivatives, within a six year period from January 2, 2008 until December 31, 2013. This way, the spectrum of results will be larger and potentially better grounded.
Secondly and differently, we test flight to quality – i.e. a safe haven situation towards lower risk – by assessing risk aversion on gold market using a GARCH-M (-in-mean) model where the gold returns’ mean depends not on several regressors (cf. Paulos (2015)) but rather on gold’s own volatility alone. By using gold’s volatility regressor isolated, it is intended to avoid multicollinearity, i.e. a phenomenon that occurs when several regressors are highly correlated within a multiple regression model, which may affect results’ validity in regards to any individual regressor, in this case in regards to gold’s volatility. This way, the potential impact of gold’s volatility on gold returns can be better assessed, to infer on risk aversion on gold market. Furthermore, flight to quality is additionally tested by comparing volatility levels between gold/asset pairs, using graphics from the DCC-MGARCH model, to better infer on gold risk levels in comparison to those of other financial assets.
It is concluded that: (i) gold tends to act as safe haven against a diverse set of financial assets, with no reverse causality and regardless of gold’s hedge potential; (ii) gold seems to be believed as a flight to quality opportunity, regardless of its volatility and any associated compensation (risk premium); (iii) there seems to be evidence of gold as a stronger safe haven over flight to liquidity movements, when the liquid asset presents volatility.
Dissertation’s structure
The present dissertation is structured in four main sections: 1. Literature Review, were a critical overview of the extant literature is given namely in
regards to safe haven and hedge concepts, and to evidences of safe haven and gold; 2. Methodology, where definitions of hedge and safe haven are set, and the econometric model presented; 3. Empirical Analysis, where data is characterized and econometric results presented; and 4. Conclusions, where findings are analysed and concluded.
20
1. Literature Review
To conduct this study, we first need to understand (i) how we can define a safe haven asset, (ii) how we can identify and measure a safe haven asset, and – most importantly – (iii) what evidences have been associated to gold, to safe haven asset and to both in relation to one another. This will be achieved by analysing previous authors and studies in this field, and presenting the most relevant findings and gaps for the current thesis.
1.1. Defining safe haven and hedge
There are several ways of defining a safe haven and a hedge asset. The majority of the early literature concentrates on the opposed movements of an asset in relation to others. For instance, Mills (2004a) and Capie, Mills, and Wood (2005) refer hedge as an asset, whose dollar (i.e. nominal) price would rise at exactly the same rate and time as the number of units of foreign currency per dollar fell. Additionally, safe haven has been associated to occur in times of market stress. Gulko (2002) refers a negative correlation between the returns of stocks and safe haven asset during stock market crashes. Similarly, Hartmann, Straetmans, and Vries (2004) refer to haven asset rally probability during a crash in another stock market, while Ranaldo and Söderlind (2007) refer to safe haven as an asset with lack of or negative correlation when the reference portfolio suffers significant losses.
A more quantifiable metric comes from Baur and Lucey (2010) and Baur and McDermott (2010), who define hedge as an asset with zero or negative correlation with the risky portfolio on average, and safe haven as an asset with that same property but in extreme market conditions, both neutralizing or compensating investment losses respectively. They argue that assets that work as a hedge against the stock market might – in certain crisis periods – co-move
with the stock market. In this case, such hedge assets will not function as safe haven, although authors do not explicitly deny that an asset can have both properties simultaneously. The authors suggest this fact might occur because investors tend to sell all types of assets concurrently, which can result in herd behaviour or contagion (see e.g. Boyer, Kumagai, and Yuan (2006); Calvo and Mendoza (2000); Forbes and Rigobon (2002)). In these same papers under analysis, one can infer an informal dichotomy as the authors seem to suggest an opposition or comparison between both concepts, but, in reality, safe haven and hedge may not necessarily be comparable or interrelated concepts.
Furthermore, Baur and McDermott (2010) also distinguish between weak and strong forms of hedge and safe haven: strong (weak) form is defined as an asset that is negatively correlated (uncorrelated) with another asset or portfolio.
Coudert and Raymond-Feingold (2011) use the same idea of safe haven being negative or zero correlated with stocks during crises. These authors present the possibility of a safe haven having a high volatility nature (cf. the case of gold), which seems to be somewhat differing from other definitions presenting safe havens as low risk assets, such as on Upper (2000).
A complementary formulation is then brought by Lucey (2011), who uses a slightly different definition for safe haven entailing low/negative correlation of an asset with others plus positive skewness, pointing out that the attractiveness of
gold (…) comes from its low correlation combined with its positive skewness, where there is a greater chance of a, say, 1% rise in one day than there is a 1% fall in any one day.
Alternatively, according to financial time’s lexicon1,a financial safe haven is
a currency, stock or commodity that is favoured in times of crisis, because of its stability and/or easy liquidation. This conceptualization points to a flight to quality or flight to liquidity perspective of the safe haven asset. The first occurs when investors sell what they perceive to be higher-risk investments and
22
purchase safer investments (see, for example, Gulko (2002) and Hartmann et al. (2004) that refer movements from stocks to bonds after negative market shocks as flight to quality); while flight to liquidity occurs when investors sell what they perceive to be less liquid or higher risk investments, and purchase more liquid investments instead.
This same rationale can be indirectly inferred from McCauley and McGuire (2009) and Flavin, Morley, and Panopoulou (2014) claim that a general safe haven definition would be that of an asset with low market risk (quality) and high liquidity, sought when investors become nervous of market losses, like the 10 year German Bund bought by non-residents during the LTCM/Russian crisis (Upper (2000)). Baur and McDermott (2010) also reveal their intention to verify the flight to quality property of gold, but end up not exploring this to a large extent.
A more stringent definition from Flavin et al. (2014) requires both the first and the second order moments (cf. statistic measurement) of the candidate safe haven asset to be insulated from negative shocks on another market.
Other authors have different perspectives, such as McCown and Zimmerman (2006) for whom gold can be perceived as a “zero beta asset”, bearing no market risk, and thus having the features of a safe haven; and as Kaul and Sapp (2006), who suggest investors purchase safe haven assets when uncertainty increases, like during the turn of the year 2000.
More recently, Paulos (2015) clarifies hedge concept as negative correlation between asset returns on average and safe haven concept as an asset sought in response to the risk increase of another market with positive correlation between the safe haven’s asset returns and other markets’ volatility. The present dissertation is grounded precisely on this latest definition.
1.2. Identifying and measuring a safe haven asset
As we could explore in the previous section, there are several definitions about safe haven and hedge, with points-of-parity and points-of-difference among them. In this chapter, we will see that, even in cases of definition similarity, methodology and/or concepts may differ, namely (i) in the way asset relation is measured and identified, (ii) in the way stress markets are considered and found, and (iii) in methodology idiosyncrasies.
1.2.1. Measuring asset relations
To test asset relation, one first needs to define how to measure the relation between assets.
Baur and Lucey (2010) and Baur and McDermott (2010) measure the relation between gold and financial assets discontinuously, by using GARCH models with dummies in the mean equation.
Coudert and Raymond-Feingold (2011), in turn, aim to present an increased continuity level in the relation between gold and stocks returns, by using bivariate ARMA-GARCH-X modelling. In this model they allow for dummies in the volatilities equations, which in reality leads to some level of discontinuity.
An alternative towards higher stability, would be, for example, the regime switching approach used by Flavin et al. (2014) to identify safe haven assets, instead of using RS_GARCH or TV GARCH models. Their methodology consists in testing the relation between two object markets, the one of equity and the one of potential safe haven, through a bivariate factor model. In this model, returns (excess log returns) are assumed to have an expected and an unexpected component, where the latter captures common and idiosyncratic shocks that can independently switch between a low- and a high-volatility state. As part of this analysis, the authors test not only the common shock’s transmission stability but
24
potential of one market to influence another market during a high-volatility scenario, an occurrence often designated by literature as pure contagion.
Joy (2011) uses a DCC-MGARCH approach when assessing the path of correlations between returns on gold and on a set of different currencies, to determine whether one is observing hedge, safe haven behaviour or neither. The author’s aim is to test null of CCC against increased different conditional return for each of three upper quantiles of negative market returns, in the forex market of the USD. This study goes a step further regarding previous literature (cf. Baur and McDermott (2010)) from a technical or econometric viewpoint, by using correlation modelling techniques of Engle (2002). Nevertheless, Joy’s approach seems to ignore or neglect the volatility role.
Finally, on Fang, Fan, and Lu (2012), rather than an explicit relation between gold and financial assets, there is a three-component-decomposition of gold price, with the spreads of U.S. Treasury CDS being the identified component to assess gold as a hedge.
1.2.2. Measuring market stress
There are different ways of measuring market stress. Baur and Lucey (2010) refer safe haven as being related with times of market stress or turmoil: although this could potentially point out to high volatility, the authors only come to relate it withdays of extremely negative stock returns.
On Baur and McDermott (2010) the safe haven scenario is verified only in certain periods, such as in cases of falling stock markets: although this is not necessarily the same as high volatility periods, the authors end up associating the referred certain periods with high volatility, even calling the top 10% e 5% quantiles “periods of increased stock market volatility” and to the top 1% quantile “spell of extreme volatility”.
This way, even if none of the authors explicitly includes volatility in the definition of a safe haven scenario, one could argue that market stress or turmoil does not necessarily imply extreme negative returns, as it can merely or also correspond to extreme volatile days; or, in other words, market stress can be related to a) negative returns, b) volatile days, or even to 3) the combined scenario of both.
Coudert and Raymond-Feingold (2011) are in agreement with these authors but move a step further in terms of methodology objectivity, since they ground a crisis period identification on the algorithms of Pagan and Sossounov (2003). In truth, in this latest model the authors still allow for breaks in covariance related to crisis periods, so it can be argued that there is also an imposed dummy break that brings some level of arbitrariness. If the aim was to introduce a stronger objectivity level, one could use STCC-GARCH, DCC-MGARCH or any other method that allowed for endogenously changing correlations instead.
1.2.3. Methodology particularities
In regards to methodology, different studies present different particularities when analysing gold and safe haven assets. While Mills (2004b) uses gold prices for daily data, Kaul and Sapp (2006) use bid-ask spread data to conclude about safe havens.
Baur and McDermott (2010), in turn, use gold returns in their econometric model, although they actually discuss prices for most of their paper. Our feeling is that these latest use gold returns for no other reason than the necessity to use returns from the stock market in the time-varying GARCH model, i.e. for convenience to adjust data to model.
Another possible identified inconsistency is the one of Baur and McDermott (2010), when including volatility effects in their study. In particular, they estimate GARCH (1,1) models for several stock indexes, where the main
26
regression model assumes gold dependence on stock market changes. For one of these models the authors include the uncertainty of the markets captured by the lagged conditional volatility of world index within different regimes. These regimes are captured by dummy variables that are equal to one, if this volatility lays on the top 10%, 5% and 1% of its distribution; and zero, if otherwise. The mean equation is therefore for gold returns as a linear function for stock returns. However, the time varying coefficient in the mean equation can change in periods of high volatility in the stock market, when dummies take value one – which may blur the true impact of market volatility on gold, since there is a certain interdependence of effects within the equation.
1.3. Evidences of safe haven and gold
Several evidences can be found on the extant literature regarding (i) gold and its potential safe haven or hedge properties, and regarding (ii) other financial assets as safe haven or hedge.
1.3.1. Evidences of gold and its potential safe haven or hedge properties
On Lawrence (2003) gold appears to be insulated from the business cycle, in contrast to other commodities. In fact, the author argues that gold’s potential for high liquidity and response to price changes can be perceived as its major differentiator from other commodities. Complementarily, the author concludes gold may be an effective portfolio diversifier.
Capie et al. (2005) provide evidence of gold as hedge against exchange rate risk, pertaining the dollar: since the price of gold is in USD, when the value of the USD falls, the price of gold rises, offsetting losses in cash. This is also a typical of a hedge against inflation (see McCown and Zimmerman (2006)).
Baur and Lucey (2010) gathered two main findings of gold as a safe haven or hedge. Firstly, gold seems to be a hedge against stocks on average; whereas in extreme stock market conditions gold is considered a safe haven within a short period. Secondly and differently, gold seems to be generally neither a safe haven nor a hedge against bonds.
Baur and McDermott (2010) show that gold can be both a hedge and a safe haven for the U.S. and major European stock markets but not for Australia, Canada, Japan and large emerging markets (cf. BRIC countries). Regarding crisis periods, the authors evidence gold as a strong safe haven for most developed markets during the “subprime” financial crisis (September 2008).
Flavin et al. (2014) find that, despite 1-year bonds being a good hedge in relation to common risk sources, these risks’ relevance is relatively low. In fact, idiosyncratic risks tend to have a higher influence in asset returns and consequently in the decision-making process for a safe haven. Plus, bi-directional contagion was verified in the combination of equity with a 1-year bond, which indicates a risky portfolio. In addition, the authors point gold or the longer-dated bonds as safe haven assets, due to their tendency to mitigate correlation and improve the portfolio’s returns in stock market fluctuation scenarios - a ‘flight-to-quality’ effect - , even though there is also some weak contagion evidence. Finally, the 10-year bond is presented as a low-risk alternative safe haven, by delivering a higher stability, although not generating as much returns as gold. For the authors, this means that decision between gold and long-term bonds will mainly rely on the fund manager’s risk profile.
1.3.2. Evidences of other financial assets as safe haven or hedge
Froot and Thaler (1990) argue that excess returns in the USD from the early eighties are due to investors’ perception of dollar as a safe haven.
28
Similarly, Kaul and Sapp (2006) associate the safe haven hypothesis with the widening of bid-ask USD spread around the end of the 1999, which the authors interpret as evidence of flows into this currency due to fears of the Y2K episode, allied to a perception of U.S. as a better prepared country to cope with it. They conclude that safe haven flows can significantly impact market liquidity.
Differently, Joy (2011) concludes against the hypothesis of dollar as a safe haven in extreme market situations but in favour of dollar as hedge.
Another way of analysing a safe haven scenario is from a flight to quality and flight to liquidity perspective. Beber, Brandt, and Kavajecz (2009) discuss both in the context of sovereign Euro Area bonds and conclude that large flows into the bond market are determined almost exclusively due to liquidity. In times of market stress, investors chase in fact liquidity and not quality. Credit quality explains the bulk of sovereign yield spreads, but liquidity also plays a relevant role for low risk countries and during times of heightened market uncertainty.
Ultimately, it is a stylized fact that forex is the most liquid financial market and that USD is the most liquid currency. Therefore, when facing uncertainty, there may be a flow to liquidity.
Please refer to Table 9 on Appendix I, for further details on extant literature and related research objects, methodologies and findings.
2. Methodology
To investigate the hypothesis of gold as a safe haven and hedge against different assets, as well as to test it as a flight to quality phenomenon, we will start by presenting in advance (i) a clear definition of safe haven and hedge and (ii) the econometric methods chosen for the subsequent analysis.
2.1. Definitions
The present dissertation is grounded on Paulos (2015) approach to safe haven and hedge concepts, differently from the most commonly used definitions, such as that from Baur and Lucey (2010).
Whereas the majority of the extant literature associates both safe haven and hedge with zero or negative correlation between assets, safe haven will be here related to assets’ volatility instead, as detailed further below.
2.1.1. Hedge
Definition 12. An asset W is a hedge in relation to an asset Z, during the time
in which:
E[correl(𝑟𝑊,𝑡; 𝑟𝑍,𝑡) < 0], ∀𝜕𝑉𝑎𝑟𝑡(𝑍) 𝜕𝑡
Hedge translates into negative correlation between asset returns on average, and therefore it has effective impacts on reduction of portfolio risk. Hedge concept is therefore associated with the correlation between the W and Z asset returns, while safe haven concept is associated with the correlation between the safe haven asset returns (W) and the other asset’s volatility (Z), as further explained below.
30
2.1.2. Safe haven
Definition 23: An asset is a safe haven during the time in which its price rises
at a growing rate, in response to the risk increase of another market. By considering the price variation rate as the rate of return, then an asset W is a safe haven in respect to an asset Z, when:
𝜕𝑟𝑊,𝑡
𝜕𝑉𝑎𝑟𝑡(𝑍)> 0
Since the price of W is determined by 𝑃𝑡, this implies not only that 𝑃𝑡 > 𝑃𝑡−1 and therefore that 𝑙𝑛𝑃𝑡> 𝑙𝑛𝑃𝑡−1 , but also that 𝑙𝑛𝑃𝑡+𝑠− 𝑙𝑛𝑃𝑡+𝑠−1 > 𝑙𝑛𝑃𝑡− 𝑙𝑛𝑃𝑡−1 , 𝑠 > 0 , for the time period during which the asset behaves as safe haven.
Corollary 14: In high volatility periods of market Z, one can verify episodes of
both positive as negative correlation between Z and W returns.
In fact, Corollary 1 unveils the fragility of safe haven’s definition as an asset with zero or negative correlation with another asset during market stress (Baur and Lucey (2010)): in reality, a safe haven scenario happens when the increase of volatility of Z leads to the increase of demand for W, which boosts W’s returns.
This volatility increase, i.e. higher fluctuation scenario, can correspond both to increasing or decreasing returns of Z, which means that W and Z can have either positive corr(𝑟𝑊,𝑡; 𝑟𝑍,𝑡)>0 as negative corr(𝑟𝑊,𝑡; 𝑟𝑍,𝑡)<0. In other words, a safe haven scenario can include both positive as negative asset correlation.
Contrarily to Baur and Lucey (2010) and Baur and McDermott (2010), negative correlation is not considered a necessary condition for the safe haven function of an asset in relation to another. As previously demonstrated, the correlation
3 Id. at 3. 4 Id. at 3.
between asset returns can actually be temporarily positive. The imperative condition for a safe haven scenario is actually the positive correlation between the safe haven asset returns (W) and the other asset’s volatility (Z). This intuition is near to Kaul and Sapp (2006) who suggest investors purchase safe haven assets when uncertainty increases. FT Lexicon’s definition is also pointing in this same direction5.
Corollary 26: Safe haven identification/recognition cannot be based on the
graphical analysis of the dynamic conditional correlation of a DCC-MGARCH alone.
In truth, DCC-MGARCH analysis (cf. Engle (2002)) relates asset returns, but it does not allow for testing return causality with volatility – a key factor for safe haven recognition.
Complementarily, some authors7 argue safe haven as flight to quality,
towards a flow to lower risk. This argument meets the referred Definition 1, in that safe haven is a sought asset for its lower risk in relation to the risk increase of another asset: this does not mean that safe haven represents no risk at all, but rather that investors perceive it as representing a lower risk, at least for a certain period of time.
Contrarily, and still based on Definition 1, we have to disagree with flight to liquidity phenomenon, i.e. when investors sell what they perceive to be less liquid or higher risk investments and purchase more liquid investments instead. As an example analysed further, the forex market is one of the most liquid securities in the world, and yet there is evidence of flew from this market in periods of high volatility.
5 Cf. Financial Times Lexicon (2015). 6
32
2.2. Econometric model
In the present study, univariate and multivariate GARCH models are used through maximum-likelihood estimation.
As previously discussed for Corollary 2, the mere graphical correlation analysis of DCC-MGARCH multivariate models does not allow for conclusion on the safe haven hypothesis. When graphical conditional correlation is negative, though, it allows to unequivocally conclude some hedging effect for a certain period of time.
Safe haven is rather studied using univariate GARCH-X, and flight to quality using GARCH-M and graphical volatility representations from DCC-MGARCH.
2.2.1. Hedge and DCC-MGARCH
When testing for hedge, our empirical approach is the multivariate GARCH model of dynamic conditional correlations – also known as the DCC-MGARCH model – first proposed by Engle (2002). This model allows for several outputs, including the graphic representation of conditional correlations between several assets within each moment, which will enable testing gold as hedge within each gold/asset pair. In this model, correlations are dynamic, i.e. their matrix can vary over time.
2.2.2. Safe haven and GARCH-X
Univariate GARCH-X (Bollerslev (1986)) is used to analyse gold as safe haven against a set of assets. This model contemplates the following two equations.
The first equation represents the safe haven returns’ mean (𝑟𝑊,𝑡) for the period
The second equation represents the conditional volatility of those returns (ℎ𝑡) for the same period, in which 𝑎0, 𝑎1 and 𝛽 are constant parameters to be estimated, namely:
(1) 𝑟𝑊,𝑡 = 𝜇 + 𝜃𝑉𝑎𝑟𝑟𝑍,𝑡+ 𝑢𝑡 (2) ℎ𝑡= 𝑎0+ 𝑎1𝑢𝑡−12 + 𝛽ℎ
𝑡−1
As it can be verified, Z volatility is present in the mean equation (1). In truth, the null hypothesis from Definition 1 implies the volatility coefficient to be positive (𝜃 > 0). This shows evidence for safe haven, since – as a refuge from Z’s volatility – investors look for more gold, which leads to higher returns in that market.
Furthermore, to capture the kurtosis’ excess of asset returns, the random error term is modelled as a Student's t-distribution, for which degrees of freedom are estimated.
The possibility of gold as a safe haven against different assets is tested by applying this model to each gold/asset pair. A reverse causality check is also performed, by testing each asset against gold, in order to better assess the causality’s (bi)direction and discern between cause and effect.
2.2.3. Flight to quality and DCC-MGARCH and GARCH-M
As previously mentioned, safe haven is seen as flight to quality, when the intention is to pursue lower risk. To test gold as a flight to quality phenomenon two steps are performed:
(i) Analysis of asset volatility level – using graphics from the
DCC-MGARCH model to compare volatility levels between gold/asset pairs.
(ii) Testing of risk aversion on gold market – through a GARCH-M
(-in-mean), where the gold returns’ mean depends on gold’s own volatility. This way, one can test, if gold returns rise due to demand for a risk premium, in response to a gold risk increase.
34
3. Empirical Analysis
3.1. Data caractherisation
Data is based on daily continuously compounded asset returns or spreads and on its conditional volatility. Data sample was obtained from Datastream database and estimations were performed using Oxmetrics 6.2 econometric system. The range of assets / indexes tested against gold are the following:
ATHEX Market Index – stock market index of Athens Stock Exchange listed companies.
CDS U.S. Treasury – U.S. Sovereign Credit Default Swap.
EMU – Datastream weighted index of the government bonds of euro area countries.
EURONEXT100 – European stock market index seated in Amsterdam, Brussels, London, Lisbon and Paris.
FTSE100 – stock market index of London Stock Exchange listed companies.
German Bund 10 yr – German 10 year government bond.
S&P500 – stock market index of New York Stock Exchange and
NASDAQ8 listed companies.
USD/EUR – exchange rate pair ‘euros per U. S. dollar’.
In this way, a variety of markets are covered: from stock indices, government bonds, forex and credit derivatives, to regional financial markets such as euro, European and American.
The data sample is extended over a six year period, from January 2, 2008 until December 31, 2013, covering more than 1300 observations.
3.1.1. Sample contextualisation
The analysed sample was chosen, as the financial stress and the related strength of gold registered between 2008 and 2013 constitute a good scenario to test for safe haven within financial market turbulence.
In fact, these timeframe was characterized by two major financial crisis: The Global Financial Crisis of 2007-08, during which economies
worldwide slowed down, as credit tightened and international trade declined, which caused worldwide stock markets to drop and deepened in September 2008 with Lehman Brothers’ collapse.
The European Sovereign-Debt Crisis, which was greatly influenced by the previous crisis and affected most European banks, rescued by government. In this context, Greece’s government-debt crisis was aggravated and Greek government's capacity to repay its creditors was drastically reduced, which resulted in two financial bailouts, from 2010 to 2012. Complementarily, uncertainty towards Germany, one of the largest European economies, arise from its major role in rescuing some European banks, such as the Greek and the Portuguese.
Thereby, we chose a variety of securities from countries affected by this period of stress – mostly focusing on European and U.S. markets – to test hedge and safe haven as gold properties.
Furthermore and as stated, gold was strengthen during this period: its value started by rising (reaching 1,900 U.S. dollars per troy ounce), then shortly stabilised around 2012 and finally decreased by 2013 – still presenting high levels though (1,597 U.S. dollars per troy ounce), when comparing with gold’s value at the beginning of this crisis period. For this reason, gold seemed to be evidenced as a possible hedge and/or safe haven asset. This evidence, together with the valuable related literature, grounded the choice for gold as the asset to be tested in this dissertation.
36
3.2. Econometric results
3.2.1 Gold as hedge
It is important to recall that hedge concept is associated with negative return correlation between assets on average.
By analysing the graphic representation of conditional correlations (DCC-MGARCH) between several assets within each moment to infer gold as hedge, four different trend groups were identified, namely:
(i) Forex market – strong positive correlation
(ii) Stock market indexes – medium positive correlation (iii) Government bond market – positive/negative correlation (iv) Credit derivatives – negative correlation.
Each of these trend groups is analysed in the following sub-sections.
3.2.1.1. Forex market – strong positive correlation
From the analysis of gold returns and the USD/EUR exchange rate returns conditional correlation – Figure 1 – one can firstly identify its great fluctuation during the sample period, reaching values from -0.1 to 0.7. Nevertheless, it is clear that, for most of the time, there is a prevalence of positive correlation between the two markets.
This fact alone, indicates that only occasionally gold can be thought as a hedge against the foreign exchange market in question, in the few periods that it presents a negative correlation.
This finding is quite surprising, since it is contrary to some literature that evidences gold as being a hedge against foreign exchange value of dollar (see e.g. Capie et al. (2005); Joy (2011); Mills (2004a)).
3.2.1.2. Stock market indexes – medium positive correlation
By analysing results of return conditional correlations between gold/asset pairs, namely between gold and each of the four stock market indexes presented in this study – ATHEX, EURONEXT100, FTSE100 and S&P500, one can find a similar behaviour between each gold/asset pair, although some differences among them can be found.
For this reason, this section will simply illustrate the correlation relative to gold and FTSE100 (Figure 2), whose inferences are close to those for EURONEXT100 and S&P500 illustrations, and the correlation relative to gold and ATHEX Market Index (Figure 3), since this presents some variations that should be mentioned.
38
Similarly as the previous scenario, some variability of each conditional correlation over the sample period can be noticed. The difference states on the length of values covered: for EURONEXT100, S&P500 as well for FTSE100 correlation values vary approximately from -0.4 to 0.7 (see FTSE100 example on Figure 2), whereas for ATHEX market index values’ length is much smaller, covering values from -0.1 to 0.1 (Figure 3).
In all conditional correlations relative to stock market indexes we can observe a solid presence of positive correlation on the sample frame. Nevertheless, there are some negative correlation periods such as: over the year 2008, with exception of last quarter, in the beginning of 2009 and in some months of 2011 and 2013 (cf. Figure 2 and Figure 3).
It is important to notice that the pattern and the magnitude of the values are not exactly the same among indexes. For example, during 2010 the conditional correlation of gold and ATHEX market index recorded negative values, while other indexes recorded positive ones; moreover, the negative peak of 2011 presented a correlation of -0.1 for ATHEX (Figure 3), whereas for the others indexes presented a correlation of -0.4 (see FTSE100 example on Figure 2).
Nonetheless the differences, the most important conclusion to withdraw is that within the various verified periods of negative correlation gold can be used as a hedging instrument. This conclusion does not restrain gold from being a safe haven in those periods, as gold can still have positive correlation with indexes’ volatility, regardless of also being a hedge or not.
3.2.1.3. Government bond market – positive/negative correlation
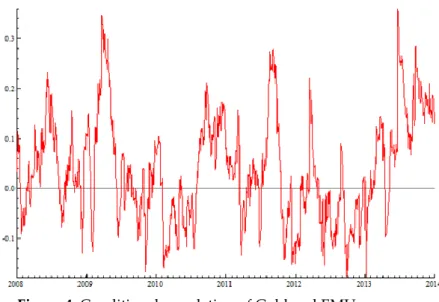
By analysing results of return conditional correlations between gold and both EMU, which represents government bonds of euro area countries, and the specific case of German government bond, through German Bund 10 yr, a really close scenario is found between these two gold/asset pairs, which seems reasonable since EMU is influenced by German bund securities. Again, for this reason, it will only be presented the illustration related to EMU, since this can be representative of both markets (Figure 4).
As on previous illustrations, some variability of each conditional correlation can be noticed over the sample period, reaching values from approximately -0.2 to over 0.3 (see EMU example on Figure 4). The difference regarding the previous sections is the similar presence of both positive and negative correlation
40
periods. The hedging property of gold, when facing negative correlation, seems more frequent in this scenario. This finding comes in contrast with that of Baur and Lucey (2010), which concludes gold is generally neither a safe haven nor a hedge against bonds.
3.2.1.4 Credit derivatives – negative correlation
Finally, by analysing gold returns and CDS U.S. Treasury spreads conditional correlation – Figure 5 – one can infer, differently from the previous scenarios, that there are quieter fluctuations during the sample period, with a lower range of correlation values from -0.15 to 0.05, with exception of February 2010.
Looking at Figure 5, it becomes clear that, during the majority of the sample’s time, the correlation between the two markets is negative. So, this last security, apart from having the more stable conditional correlation with gold, is the one presenting more periods of negative correlation within it, which translates into a strong evidence of gold hedging property against CDS U.S. Treasury.
3.2.2. Gold as safe haven
In order to perform our key analysis – testing gold as safe haven against a set of assets – univariate GARCH-X models are used, as previously mentioned. The results are divided into three sections: (i) testing gold against three stock market indexes, (ii) testing gold against a perceived risky security versus a perceived safe security, (iii) testing gold against three distinctive markets – currency, credit derivative and government bond markets. As stated before, a reverse causality check is performed, by testing each asset against gold, in order to better assess the causality’s (bi)direction and to discern between cause and effect.
3.2.2.1. Stock market indexes
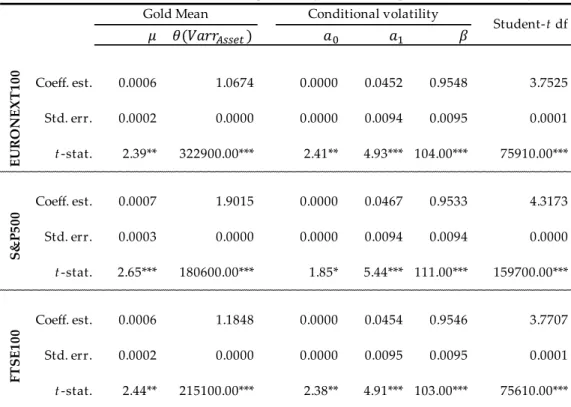
The first table presented below (Table 1) represents the average effect of three stock index returns’ volatility – EURONEXT100, S&P500 and FTSE100 – on gold returns during the sample period, estimated by a GARCH (1,1).
Table 1: Estimation results for EURONEXT100, S&P500 and FTSE100
Coeff. est. 0.0006 1.0674 0.0000 0.0452 0.9548 3.7525 Std. err. 0.0002 0.0000 0.0000 0.0094 0.0095 0.0001 t -stat. 2.39** 322900.00*** 2.41** 4.93*** 104.00*** 75910.00*** Coeff. est. 0.0007 1.9015 0.0000 0.0467 0.9533 4.3173 Std. err. 0.0003 0.0000 0.0000 0.0094 0.0094 0.0000 t -stat. 2.65*** 180600.00*** 1.85* 5.44*** 111.00*** 159700.00*** Coeff. est. 0.0006 1.1848 0.0000 0.0454 0.9546 3.7707 Std. err. 0.0002 0.0000 0.0000 0.0095 0.0095 0.0001 t -stat. 2.44** 215100.00*** 2.38** 4.91*** 103.00*** 75610.00*** S& P 5 0 0 F T SE 1 0 0
***, **, * indicate statistical significance at the 0.01, 0.05 and 0.10 le ve l, re spe ctive ly.
Re sults of GARCH (1,1) mode l within me an equation of gold re turns de pe nds on asse t volatility.
Gold Mean Conditional volatility
Student-t df E U R O N E X T 1 0 0 𝜇 𝜃(𝑉𝑎𝑟𝑟 𝑠𝑠 𝑡) 𝑎 𝑎1 𝛽
42
As Definition 1 states, the imperative condition for a safe haven scenario is actually the positive correlation between safe haven asset returns, in this case gold returns, and the other asset’s volatility – in this way, it is required that the volatility coefficient, presented in the second data column of Table 1, is positive (𝜃 > 0). As a matter of fact, looking for coefficient 𝜃 for the three stock indexes studied we can conclude they present positive figures – 1.07, 1.90 and 1.18 respectively – and are statistical significant at 1% level (cf. t-stat.’s values).
Subsequently, the reverse causality test was performed, for which results are displayed on Table 2. This test represents instead the average effect of gold returns’ volatility on each stock index’s return, during the sample period estimated through a GARCH (1,1).
By analysing Table 2, we can conclude that the coefficient 𝜃 is not significant for each reverse causality test, for neither 1%, 5% nor 10% significance level. This
Table 2: Estimation results for EURONEXT100, S&P500 and FTSE100 - Reverse Causality Test
Coeff. est. 0.0007 -0.6493 0.0000 0.0914 0.8985 6.9424 Std. err. 0.0003 0.6556 0.0000 0.0177 0.0180 1.2580 t -stat. 2.38** -1.07 2.26** 4.45*** 43.70*** 5.87*** Coeff. est. 0.0008 -0.8937 0.0000 9.0946 0.9054 8.7732 Std. err. 0.0003 1.3080 0.0000 0.0093 0.0147 1.9110 t -stat. 3.08*** -0.61 2.31** 5.44*** 66.60*** 4.24*** Coeff. est. 0.0007 -0.6263 0.0000 0.0873 0.9034 7.0724 Std. err. 0.0002 0.5260 0.0000 0.0167 0.0171 1.3810 t -stat. 2.75*** -1.44 2.14** 4.66*** 46.30*** 5.54*** S& P 5 0 0 F T SE 1 0 0
***, **, * indicate statistical significance at the 0.01, 0.05 and 0.10 le ve l, re spe ctive ly.
Re sults of GARCH (1,1) mode l within me an equation of asse t re turns de pe nds on gold volatility.
Asset Mean Conditional volatility
Student-t df E U R O N E X T 1 0 0 𝜇 𝜃(𝑉𝑎𝑟𝑟 ) 𝑎 𝑎1 𝛽
result indicates that all stock indexes tested – EURONEXT100, S&P500 and FTSE100 – do not respond to gold’s volatility, in terms of average returns.
In short, evidence exhibits positive and significant correlation between gold returns and each stock index volatility with no reverse causality effect. Therefore, safe haven’s causality direction is well-defined being gold to behave as a safe haven against EURONEXT100, S&P500 and FTSE100 indexes in positive correlation periods between gold’s returns and these stock indexes’ return volatility.
3.2.2.2. Low vs high risk security
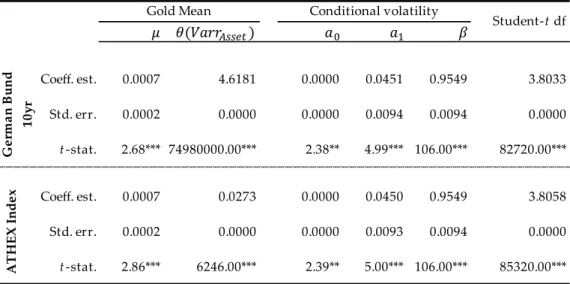
In order to analyse gold’s safe haven potential in moments of market turbulence, we thought to test it against a perceived riskier asset – ATHEX market index – in contrast to a safer one – German bund 10 yr. The intuition idea, is to test safe haven responsiveness towards a critical and a safe market. The results of each univariate GARCH (1,1) are presented on Table 3 below.
The coefficient 𝜃 of German bund is clearly a positive statistical significant coefficient. Similar conclusions are inferred for ATHEX market – both coefficients
Table 3: Estimation results for German Bund 10 yr and ATHEX Index
Coeff. est. 0.0007 4.6181 0.0000 0.0451 0.9549 3.8033 Std. err. 0.0002 0.0000 0.0000 0.0094 0.0094 0.0000 t -stat. 2.68*** 74980000.00*** 2.38** 4.99*** 106.00*** 82720.00*** Coeff. est. 0.0007 0.0273 0.0000 0.0450 0.9549 3.8058 Std. err. 0.0002 0.0000 0.0000 0.0093 0.0094 0.0000 t -stat. 2.86*** 6246.00*** 2.39** 5.00*** 106.00*** 85320.00*** A T H E X I nd e x
***, **, * indicate statistical significance at the 0.01, 0.05 and 0.10 le ve l, re spe ctive ly.
Re sults of GARCH (1,1) mode l within me an equation of gold re turns de pe nds on asse t volatility.
Gold Mean Conditional volatility
Student-t df G e rm a n B un d 1 0 y r 𝜇 𝜃(𝑉𝑎𝑟𝑟 𝑠𝑠 𝑡) 𝑎 𝑎1 𝛽
44
being statistical significant at 1% level. The difference arises from the coefficients greatness, which for German bund takes value 4.62, whereas for ATHEX takes a smaller amount of 0.03. Again, one can say that an increase in these securities’ return volatility leads to an increase in gold returns.
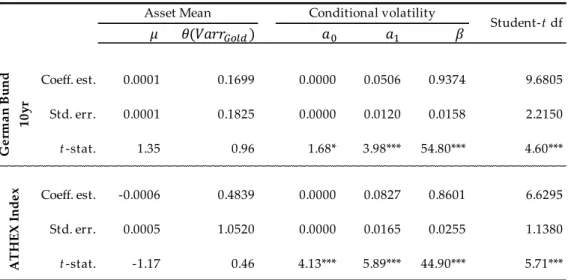
As before, a reverse causality analysis is performed, results being illustrated on Table 4.
When analysing Table 4, we can conclude that the coefficient 𝜃 is not significant for both reverse causality test, for neither 1%, 5% nor 10% significance level. These results indicate that both securities – German bund 10 yr and ATHEX Index – do not respond to gold’s volatility, in terms of average returns.
As before, gold performs as safe haven without reverse causality reaction regarding ATHEX and German Bund markets, for the reported period. The inference over a safe or quiet market as this latest one (German Bund) is somehow curious, since – from intuition: (i) safer securities should not need to react to their own volatility and therefore impact another asset’s returns; and, furthermore, (ii) safer securities should potentially behave as safe haven against other markets, when these face volatility – and, as demonstrated, neither of the cases occurs between German Bund in relation to gold.
Coeff. est. 0.0001 0.1699 0.0000 0.0506 0.9374 9.6805 Std. err. 0.0001 0.1825 0.0000 0.0120 0.0158 2.2150 t -stat. 1.35 0.96 1.68* 3.98*** 54.80*** 4.60*** Coeff. est. -0.0006 0.4839 0.0000 0.0827 0.8601 6.6295 Std. err. 0.0005 1.0520 0.0000 0.0165 0.0255 1.1380 t -stat. -1.17 0.46 4.13*** 5.89*** 44.90*** 5.71*** A T H E X I nd e x
***, **, * indicate statistical significance at the 0.01, 0.05 and 0.10 le ve l, re spe ctive ly.
Re sults of GARCH (1,1) mode l within me an equation of asse t re turns de pe nds on gold volatility.
Asset Mean Conditional volatility
Student-t df G e rm a n B un d 1 0 y r 𝜇 𝜃(𝑉𝑎𝑟𝑟 ) 𝑎 𝑎1 𝛽
In this manner, results evidence gold’s safe haven ability to operate either in great turbulence markets as in perceived safer ones.
3.2.2.3. Diverse securities
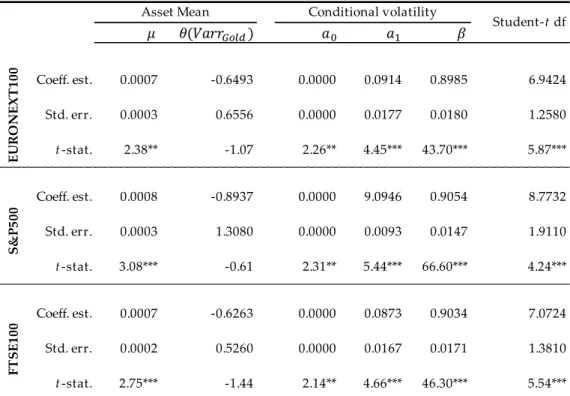
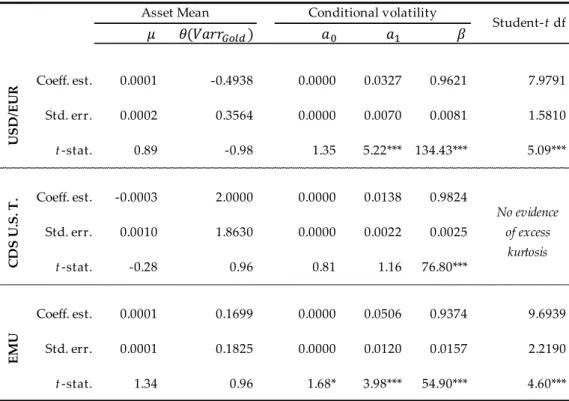
This last section studies safe haven scenarios, by testing gold against three distinctive markets – currency (USD/EUR exchange rate), credit derivative (CDS U.S. Treasury) and government bonds (EMU). The results of each univariate GARCH (1,1) are presented on Table 5.
As seen so far, also coefficient 𝜃 for both CDS U.S. Treasury and EMU is positive and statistical significant at 1% level. The coefficient for the first security take value 0.06 and for the latter takes value 4.58. Similarly, the forex’s (USD/EUR) return volatility effect on gold’s returns is significant and positive but at a 5% level instead, recording an amount of 12.30.
Table 5: Estimation results for USD/EUR, CDS U.S. T. and EMU
Coeff. est. -0.0002 12.3019 0.0000 0.0611 0.9263 Std. err. 0.0003 3.5220 0.0000 0.0115 0.0134 t -stat. -0.49 2.10** 1.06 1.43 18.50*** Coeff. est. 0.0006 0.0641 0.0000 0.0422 0.9545 3.9064 Std. err. 0.0003 0.0223 0.0000 0.0099 0.0096 0.4342 t -stat. 2.59*** 5.64*** 1.91* 4.27*** 104.00*** 9.05*** Coeff. est. 0.0007 4.5834 0.0000 0.0451 0.9549 3.8034 Std. err. 0.0002 0.0000 0.0000 0.0094 0.0094 0.0000 t -stat. 2.68*** 80590000.00*** 2.38** 4.99*** 106.00*** 82750.00*** C D S U .S. T . E MU
***, **, * indicate statistical significance at the 0.01, 0.05 and 0.10 le ve l, re spe ctive ly.
Re sults of GARCH (1,1) mode l within me an equation of gold re turns de pe nds on asse t volatility.
Gold Mean Conditional volatility
Student-t df U SD /E U R No evidence of excess kurtosis 𝜇 𝜃(𝑉𝑎𝑟𝑟 𝑠𝑠 𝑡) 𝑎 𝑎1 𝛽
46
On Table 6 it is shown that there is no reverse causality for the three markets, since gold’s return volatility does not affect the securities’ return, i.e. each coefficient 𝜃 is not significant for neither 1%, 5% nor 10%.
The results indicate gold as a clear safe haven within this period towards these specific markets with no reverse causality.
The results for forex market are quite interesting in relation to flight to liquidity phenomenon, i.e. when investors sell what they perceive to be less liquid or higher risk investments, and purchase more liquid investments instead. Actually, results for forex market evidence flights to other markets, when facing higher volatility, even though this is considered one of the most liquid securities in the world. From this perspective, liquidity cannot be necessarily sought for representing a lower risk and, for that reason, flight to liquidity cannot be necessarily seen as a safe haven and/or a flight to quality phenomenon, at least when the liquid asset presents volatility. In fact, as demonstrated, flight to liquidity does not occur, when the forex asset presents volatility. Instead, the
Coeff. est. 0.0001 -0.4938 0.0000 0.0327 0.9621 7.9791 Std. err. 0.0002 0.3564 0.0000 0.0070 0.0081 1.5810 t -stat. 0.89 -0.98 1.35 5.22*** 134.43*** 5.09*** Coeff. est. -0.0003 2.0000 0.0000 0.0138 0.9824 Std. err. 0.0010 1.8630 0.0000 0.0022 0.0025 t -stat. -0.28 0.96 0.81 1.16 76.80*** Coeff. est. 0.0001 0.1699 0.0000 0.0506 0.9374 9.6939 Std. err. 0.0001 0.1825 0.0000 0.0120 0.0157 2.2190 t -stat. 1.34 0.96 1.68* 3.98*** 54.90*** 4.60*** C D S U .S. T . E MU
***, **, * indicate statistical significance at the 0.01, 0.05 and 0.10 le ve l, re spe ctive ly.
Re sults of GARCH (1,1) mode l within me an equation of asse t re turns de pe nds on gold volatility.
Asset Mean Conditional volatility
Student-t df U SD /E U R No evidence of excess kurtosis 𝜇 𝜃(𝑉𝑎𝑟𝑟 ) 𝑎 𝑎1 𝛽
flight for a safer asset as safe haven seems to prevail over higher liquidity. Or, in other words, there seems to be evidence of gold as a stronger safe haven, even over flight to liquidity movements.
3.2.3. Gold as a flight to quality
To test gold as a flight to quality phenomenon based on risk preferences two steps are performed: (i) analysis of asset volatility level and (ii) testing of risk aversion on gold market through a GARCH-M (-in-mean) model.
3.2.3.1. Analysis of asset volatility level
As previously mentioned, safe haven is seen as flight to quality, when the intention is to pursue lower risk. In this context, we compared volatility levels between gold/asset pairs using graphics from the DCC-MGARCH model. From comparative analysis towards gold, three trends were identified (i) similar volatilities (ii) higher volatilities and (iii) lower volatilities.
From the gold/asset pairs presented in this study, the USD/EUR exchange rate was left out of this section, which can be of interest for further analysis.
(i) Similar volatilities to gold
Analysing the volatility graphs for the four stock indexes – ATHEX, EURONEXT100, FTSE100 and S&P500 – in comparison to gold’s volatility, the stock indexes have quite analogous inferences. As illustration, it is presented below the graphic regarding FTSE100 – Figure 6.
48
Indexes’ volatility level and behaviour are a lot in line with gold’s volatility performance. However, indexes present slightly higher levels during some of the sample’s periods, with an extreme peak around November 2008 in comparison to gold (see example of FTSE100 in Figure 6, in that gold is represented by the red line and FTSE100 by the blue one). It is important to notice that for ATHEX index the gap between volatility levels towards gold is slightly wider than for the other indexes, which seems reasonable since Greece was one of the most financially affected countries during that period.
(ii) Higher volatilities than gold
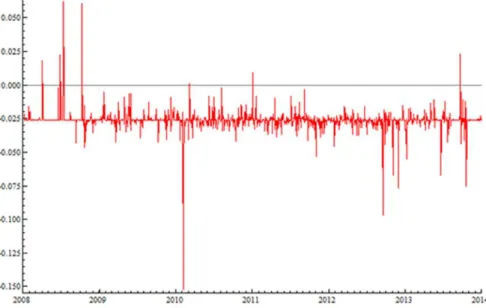
Analysing the volatility graph for CDS U.S. Treasury in comparison to gold’s volatility, is it clear that CDS market (Figure 7) has a much higher level of volatility, being sharper in periods of great turbulence.
(iii) Lower volatilities than gold
Analysing the volatility graphs for the government bond markets – EMU and German bund 10 yr – in comparison to gold’s volatility, the securities present quite analogous inferences. As illustration, it is presented below the graphic regarding German bund 10 yr – Figure 8.
Securities’ volatility level is much smaller comparing to gold’s volatility performance (see example of German bund 10 yr on Figure 8, in that gold is
Figure 7: Conditional volatility of Gold and CDS U.S. Treasury
50
represented by the red line and the German bund by the blue line). This means that gold, compared to government bond market, seems to have higher volatility and therefore can be apparently perceived with higher risk. But, as seen before, gold is a safe haven against this market even though it has higher volatility and apparently higher risk. In fact, gold's returns are rising because people turn to gold as refuge from other markets, even if these present lower volatility levels. This result is somehow in agreement with Coudert and Raymond-Feingold (2011), when they conclude that, in spite of gold’s volatility being characteristically high, gold is a safe haven against the assets studied in their analysis.
3.2.3.2. Testing risk aversion on gold market
For testing risk aversion on gold market a GARCH-M (-in-mean) is used. In this model, gold returns’ mean depends on gold’s own volatility. This way, one can test, if gold returns rise due to demand for a risk premium, in response to a gold risk increase – results presented on Table 7.
Coeff. est. 0.0008 -0.8670 0.0000 0.0448 0.9552 3.7975 Std. err. 0.0002 0.0000 0.0000 0.0093 0.0093 0.0000
t -stat. 3.47*** -75800.00*** 2.40** 5.02*** 107.00*** 87640.00***
***, **, * indicate statistical significance at the 0.01, 0.05 and 0.10 level, respectively. Results of GARCH-M (1,1) model within mean equation of gold returns depends on its on volatility.
Gold Mean Conditional volatility
Student-t df
𝜇 𝜃(𝑉𝑎𝑟𝑟 ) 𝑎 𝑎1 𝛽
The coefficient 𝜃, which measures risk aversion, is negative and significant at 1% level. This result means that agents are even willing to bear lower gold returns in response to an increased volatility of this market. Actually, gold market participants do not seek a risk premium and therefore are not risk averse agents when it concerns gold assets.
The key conclusion is that the boosting on gold returns within safe haven scenarios truly results from the additional demand for gold as safe haven asset and not from the demand for risk premium. In fact, participants fly from other markets to gold and are even willing to bear its volatility without additional return compensation. Therefore, gold is seen as flight to quality, as the intention is to pursue a perceived lower risk market, regardless of its volatility and any associated compensation.
52
4. Conclusions
From a methodological point of view, this thesis is built from the innovations brought by Paulos (2015) that, we believe, are substantially important. In particular, Paulos (2015) clarifies hedge concept as negative correlation between asset returns on average, and therefore having effective impacts on reduction of portfolio risk; and a safe haven concept as an asset sought in response to the risk increase of another market, which means positive correlation between safe haven asset returns and other markets’ volatility.
Complementarily – and despite some limitations such as the assets’ spectrum and the defined 6-year period resulting from historical contingencies – the present thesis’ results are clear, well-grounded and valid within chosen methodological framework, and constitute a step forward in the fine-tuning and clarification of safe haven concept within gold market.
In truth, and from testing and analysing hedge, safe haven and flight to quality in relation to gold, three main conclusions were inferred:
(i) Gold can act as hedge against other financial assets, with varied frequency depending on the asset – although there seems to be tendency to medium frequency.
(ii) Gold tends to act as safe haven, with no reverse causality, against a diverse set of financial assets – from stocks and government bonds, to exchange rates and credit derivatives.
(iii) Gold seems to be believed as a flight to quality opportunity for being perceived as a lower risk market, regardless of its volatility and any associated compensation (risk premium).
In regards to gold as safe haven, it has been also demonstrated that this property of gold is verified, either in scenarios where gold is simultaneously a
hedge or not. In other words, there is evidence of gold as a safe haven, regardless of its hedge potential.
Furthermore, there seems to be evidence of gold as a stronger safe haven over flight to liquidity movements, at least when the liquid asset presents volatility.
Table 8 below, summarizes the different test results performed regarding hedge, safe haven and flight to quality in relation to gold.
These findings and evidences reinforce gold as a safe haven asset, whose returns have positive correlation with other markets’ return volatility.
Finally, the present study foresees further research, in particular facing the recent oil price variation, which unveils the question of investigating whether the commodity market – in particular the gold market – constitutes the required refuge to the generated exceeding liquidity.
Table 8: Gold tested against other assets
Assets Hedge Safe Haven Volatility
ATHEX Some YES* Similar
EURONEXT100 Some YES* Similar
FTSE100 Some YES* Similar
S&P500 Some YES* Similar
USD/EUR Scarce YES* Not tested
CDS U.S. T. Most YES* Higher
EMU Half YES* Lower
German Bund 10 yr Half YES* Lower