DOI: http://dx.doi.org/10.5007/1980-0037.2018v20n5p432
Assessment of critical velocity in track and
treadmill: physiological profiles and relationship
with 3000-meter performance
Avaliação da velocidade crítica de corrida em pista e
esteira: perfis fisiológicos e relações com o desempenho
em 3000 metros
Danilo Alexandre Massini1
Renato Aparecido Caritá1
Leandro Oliveira da Cruz Siqueira1
Astor Reis Simionato1
Benedito Sérgio Denadai1,2
Dalton Muller Pessôa Filho1,3
Abstract – The present study aiming to verify the interference of different conditions (treadmill vs. track) on critical velocity (CV) values, as well as on the correlation to the 3000-meter performance (v3000m), and thus infer about the specificity of each values as training parameter for this distance. Seven runners (15.3±1.4 years) were submitted to a maximal progressive test (1.0 km×h-1 increments per minute until exhaustion) to assess
V̇O2max and maximal aerobic velocity (vV̇O2max). Subsequently, CV was estimated from three running performances at each test condition, with exercise intensities adjusted for different time limits (tLim) at 900, 2100 and 3300 meters in track or at 90, 95 and 115%
of vV̇O2max in treadmill. From linear adjustments, using stepwise method, CV was
assessed on treadmill (CVTREADMILL) and track (CVTRACK), and both compared by the Mann-Whitney test. The sample-adjusted dispersion coefficient (R2
adj) analyzed the
vari-ance of v3000m with CVTRACK, CVTREADMILL and vV̇O2max. In all analyses, significance was set at P≤0.05. In progressive test, V̇O2max reached 54.2±5.2 mLO2×kg-1×min-1 and
vV̇O2max reached 16.8±1.9 km×h-1. No differences were observed between CV
TREADMILL
and CVTRACK (14.0±1.8 vs. 12.3±3.2 km×h
-1, P=0.46). Correlations were observed for
v3000m with CVTREADMILL (R 2
adj ~0.94), CVTRACK (R 2
adj ~0.99) and vV̇O2max (R 2
adj ~0.90),
all showing P=0.001. It could be concluded that no influence was observe on the ability to achieve identical CV values from different assessment conditions. The correlation to the v3000 meters suggested better specificity of CVTRACK than CVTREADMILL for training prescription and performance control.
Key words: Athletic performance; Exercise test; Exercise tolerance; Oxygen uptake; Track and field.
Resumo – O presente estudo averiguou se as diferenças nas circunstâncias (esteira vs. pista) de avaliação da velocidade crítica (VC) interferem no valor e na relação com a desempenho em 3000 metros (v3000m) e, assim, indicar a especificidade de cada valor como parâmetro de treinamento para esta distância. Sete corredores (15,3±1,4 anos) submeteram-se a um teste progressivo máxi-mo (incrementos de 1,0 km×h-1×min-1, até a exaustão) para avaliação do V̇O
2max e velocidade aeróbia máxima (vV̇O2max). A seguir, a VC foi estimada a partir do desempenho de corrida em três diferentes intensidades do exercício, em cada ambiente de avaliação, registrando-se o tempo--limite (tLim) nas distâncias de 900, 2100 e 3300 metros na pista, e à 90, 95 e 115% vV̇O2max em esteira. Ajustes lineares, pelo método “stepwise”, forneceram os parâmetros VC em esteira (VCESTEIRA) e pista (VCPISTA), que foram comparados pelo teste de Mann-Whitney. O coeficiente de dispersão ajustado à amostra (R2
aj) averiguou a variância de v3000m com VCPISTA, VCESTEIRA e vV̇O2max. Em todas as análises adotou-se P≤0,05. No teste progressivo, o V̇O2max atingiu 54,2±5,2 mLO2∙kg-1∙min-1 e a vV̇O
2max foi 16,8±1,9 km×h
-1. Não se observaram diferenças entre VCESTEIRA e VCPISTA (14,0±1,8 vs. 12,3±3,2 km∙h-1, P=0,46). Houveram correlações entre v3000m com VCESTEIRA (R2
aj~0,94), VCPISTA (R 2
aj~0,99) e vV̇O2max (R 2
aj~0,90), todas com P=0,001. Conclui-se que o contexto de avaliação não interfere na consistência do valor de VC. Porém, quanto à relação com v3000 metros, a VCPISTA apresenta melhor especificidade, tornando--a mais autêntica que VCESTEIRA para a prescrição do treino e monitoramento do desempenho.
1 São Paulo State University (UNESP). Post Graduate Program in Human Development and Technolo-gies. Rio Claro, SP. Brazil
2 São Paulo State University (UNESP). Institute of Biosciences. Rio Claro, SP. Brazil.
3 São Paulo State University (UNESP). College of Sciences. Bauru, SP. Brazil.
Received: November 11, 2017
INTRODUCTION
During efforts at distances with time limit (tLim) between 10 and 15 min-utes, such as 3000 meters, the performance-determining physiological scenario is characterized by higher metabolic rate, which can be sustained without the early disturbance of muscular and blood homeostasis in rela-tion to the high blood lactate levels ([La-]) and the continuous increase in
the V̇O2 response1,2,3. This metabolic profile typifies the border between
the heavy and severe exercise domain, which has been parameterized in running by critical velocity (CV)3; above which the exercise is (in) tolerable
for a period of time dependent on the demand intensification on non-O2 -dependent metabolic pathways (e.g., on D’)1,3.
However, CV and D’ evaluation involves a mathematical description by linear or hyperbolic adjustments between exercise intensity and time limit3,4; and dependent on variability associated with the protocol (e.g., at
least 3 efforts, with time limit of 2-15 minutes, and 5 viable adjustment equations)2,4. Another relevant aspect is the specificity of the test
condi-tion, which, despite representing the everyday life of athletes (e.g., track in which training is developed), implies the adequacy of the time limit model standardized treadmill, mainly regarding the adjustment and control of exercise intensity. Thus, if on the one hand, CV evaluation in controlled environments (laboratory) allows questioning about the transfer of this training parameter to (“in loco”) daily practice conditions5-8; on the other
hand, the possibility of interferences in the reproduction of the CV protocol in track, such as speed oscillation and running economy9, compromise t
Lim
and, thus, the CV evaluation authenticity.
In spite of these particularities, metabolic similarities has been observed between track and treadmill running for the running intensity between 10.5 and 18.0 km∙h-1, as described by Jones and Doust6. This similarities
allowed the reproduction of the speed-time model (v-1/tLim, which is analogous to the time limit model) in track, whose estimated CV value (292.9 ± 20.8 m∙min-1) (299.5 ± 19.8 m∙min-1) allowed authors such as
Kranemburg and Smith8 to conclude that, among trained runners, track
and treadmill performance conditions provide reciprocal exhaustion times and, therefore, the CV diagnosis in track maintains the authenticity of the original treadmill estimation. Additionally, Simões et al.10 analyzed the
capacity indexes, as the maximum oxygen uptake (V̇O2max, r = 0.51 – 0.70) and its occurrence rate (vV̇O2max, r = 0.64 – 0.86), as well as with long-term performance indexes, such as velocity corresponding to the lactate threshold by fixed concentration of 4.0 mmol∙L-1 (OBLA, r = 0.66
– 0.73)11,12,13. These correlations reveal an ambiguity in the representation
and application of CV, but also reveal that CV evaluation is not affected by the difference running conditions (treadmill vs. track) and has validity when representing physiological indexes of medium- and long-duration exercises, as those described above.
However, the theoretical information is still inconclusive about the influence of the running condition (treadmill vs. track) on the potential of correlation between CV and medium-distance performance (as v3000m) and the applicability of each value obtained as training parameter. This is because studies carried out on treadmill and track have sometimes been concerned with the physiological significance of CV evaluations, present-ing their correlations with aerobic fitness parameters8, sometimes describe
the relationships between CV and running performance at medium10 or
long distances11, using CV evaluations obtained in single contexts, such
as track10 and treadmill11. Therefore, the question whether CV evaluation
context is influenced by the specificity of the environment (track) or the evaluation accuracy (treadmill), regarding the propensity of this parameter in indexing the running performance, it stills remains without a definitive answer. In addressing this issue, there is a need to gather methodological (compatibility between assessment procedures), conceptual (to contextual-ize its physiological meaning by similarity with other demand parameters and metabolic nature in exercise) and application information (relation-ships with running performance in a specific domain of exercise intensity). Thus, the aim was to analyze the adequacy of the CV evaluation protocol in track against the gold standard of treadmill determination, considering the possibility of clarifying if there are differences in the exhaustion time and blood lactate response, when comparing the CV pre-dictive running performances, as well as, if differences, once verified, alter the mathematical adjustment of the CV evaluation model to the point of interfering in the specificity of its theoretical application: to index perfor-mance of middle and long distances. The thematic focus on the 3000-meter performance is related, in the present study, to the population analyzed, since this distance is the maximum allowed in national competitions for the age group investigated.
METHODOLOGICAL PROCEDURES
year with daily routine), sex and age group. All participants performed (1) progressive test (ramp type) for V̇O2max and vV̇O2max14 evaluation; (2)
performance tests on track delimited by medium distances for CV track evaluation (CVTRACK)12; and (3) constant tests up to the limit of
toler-ance at running intensity around vV̇O2max for CV treadmill evaluation (CVTREADMILL)4. A minimum interval of 24h and a maximum of 48h were
established between progressive test and CV determination tests, as well as between each predictive effort on track and treadmill. Track tests were carried out on a 300-meter open track (pressed charcoal floor), always at the same time of day and prior to the training session. Subjects were in-structed to avoid exhaustive workouts, alcoholic and caffeinated beverages the day before the evaluation, as well as attending fed and hydrated. The present study was approved by the Local Ethics Committee (FC - UNESP / Bauru) and registered under CAAE protocol 02589012.3.0000.5398.
Maximum Progressive Test
During the progressive test, the slope was maintained at 1.0%6 and the
speed progressed 1.0 km∙h-1∙min-1 from 7.0 km∙h-1 until exhaustion on
tread-mill model HP/Cosmos Pulsar (Nussdorf-Traunstein, Germany). V̇O2 was measured breath-to-breath throughout the test by an automated unit (QuarkPFTergo, Cosmed, Rome, Italy). System calibration was performed prior to each test as instructed by the manufacturer. V̇O2 values were smoothed by three-second filter and averaged at each six-second interval. [La-] was analyzed at rest and in the first minute after the end of the test.
Lactate concentration analysis was performed using the enzymatic method (YSL 2500STAT, Yellow Spring, Colorado) using arterial blood samplings.
V̇O2max was considered the highest 30s average value. The vV̇O2max was considered the slowest velocity that projected V̇O2 to the maximum. The gas exchange threshold (GET) was determined according to recom-mendations of Whipp14, by the V̇
E∙V̇CO2-1, V̇E∙V̇O2-1, PETCO2 and PETO2
responses, observing the increase in V̇E∙V̇O2-1 and P
ETO2 curves without
alteration in V̇E∙V̇CO2-1 and P
ETCO2 response. GET and V̇O2max
evaluations were performed by two or three experienced researchers, in-dependently. In determining the velocity corresponding to GET (vGET) and V̇O2max (vV̇O2max), mean response time (MRT) of 40 seconds was considered15. The calculation of v50%Δ was performed based on the
differ-ence between vGET and vV̇O2max9,15. This parameter is also considered
a reference of the threshold exercise intensity between the heavy/severe domains1,15.
Critical velocity (CV) assessment on track and treadmill
Predictive CV efforts in track (900, 2100, 3300 meters) and treadmill (90%, 95% and 115% vV̇O2max) were performed in a random manner, with minimum intervals of 24h, whose track distances and treadmill run-ning intensity were adopted according to recommendations of Kranenburg; Smith8 and Bull et al.4, respectively. The time limit (t
seconds and the velocity and tLim values were adjusted by v-tLim-1 and d-t Lim
models, according to Equations 1 and 2, using standard error of estimate (SEE) as a criterion for choosing the CV value for each participant4,13.
[1]
[2]
where: “v” = running speed; “D” = amount of work with anaerobic resources; “t” = is the tLim of predictive efforts and “CV” = is the critical velocity in track (CVTRACK) or treadmill (CVTREADMILL). [La-] was also
analyzed at rest and at the first minute after the end of each track and treadmill running performance.
3000-meter test
The 3000-meter performance was carried out on a 300-meter track where athletes routinely trained. The time to complete the 3000 meters was deter-mined by the sum of the 300-meter partials and used to calculate the average speed (v3000m).
Exercise intensity
Relative oxidative demand (%V̇O2max) and relative effort intensity (%vV̇O2max) were determined for CVTRACK, CVTREADMILL, v300m and v50%Δ. The proportional relationship between velocities of these parameters and the maximum aerobic velocity (% vV̇O2max) were determined by the percentage variation. Oxidative demand (V̇O2) at each velocity was determined by linear trend analysis of the individual velocity and V̇O2 responses during the incre-mental test and by the percentage variation of values obtained with V̇O2max16.
Statistical analysis
Data were expressed as mean ± SD. Differences between CV and D’ on tread-mill and track were verified by the Mann-Whitney Test (U) and time-limit differences (tLim) between track and treadmill predictive efforts were analyzed by the Wilcoxon Test. Analysis of variance and concordance between track and treadmill CV were performed by the dispersion coefficient (R2), standard
error of estimation (SEE) and by Bland-Altman17. The sample power regarding
the linear correlation coefficient was determined by Equation 3.
[3]
where Z1-βprovides the coefficient for the determination of the sample power by the normal two-tailed
distribution of its value and “r” is the Pearson linear coefficient among variables18. The correlations of
v3000m with CV (treadmill and track), vV̇O2max and V̇O2max were determined by the adjusted dispersion coefficient (R2
adj) for participant sampling (N) and dependent variables (k). The “least squares” method
was used in all simple linear adjustment procedures. In all analyses, P≤0.05 was used. Statistical
procedures were performed in SPSS 24Ò software (IBM, Chigado, IL, USA).
RESULTS
The maximum values obtained in the progressive test were: 54.2 ± 5.2 mLO2∙kg -1∙min-1 and 16.8 ± 1.9 km∙h-1, corresponding to V̇O
respectively. CV evaluation presented SEE <5%, regardless of evaluation environment (treadmill vs. track) and adjustment model (Figure 1). The mean SEE associated with CVTREADMILL assessment was 0.30 ± 0.14 m-1
(2.1 ± 1.0%), while CVTRACK reached 0.58 ± 0.33 m-1 (4.9 ± 2.9%). For the
D’ parameter, SEE on treadmill was 14.8 ± 5.9 m (11.9 ± 5.1%) and in track, value was equivalent to 66.6 ± 58.3 m (30.4 ± 23.6%). No differences were observed when comparing CVTREADMILL and CVTRACK: 14.0 ± 1.8 vs. 12.3 ± 3.2 km∙h-1 (P = 0.46). No differences were observed when comparing the
anaerobic reserve parameter (D’) in treadmill and track: 137.1 ± 22.5 m vs. 267.9 ±115.4 m (P = 0.07). When analyzing the distance-limit model (dLim) on the track and comparing it to the time-limit model (tLim) applied on tread-mill, Table 1 highlights differences only in terms of the tLim of the highest intensity predictor (115% vV̇O2max vs. 900 m), but in the other predictors, tLim did not present differences between protocol application environments.
Figure 1. CV determination by the d-tLim and v-1/tLim models, presenting SEE of the adjustment
on treadmill (Panels A and B) and track (Panels C and D) as a criterion for selecting values for a runner (subject 7: V̇O2max = 60.25 mL∙kg-1∙min-1).
Table 1. Mean tLim values of and physiological response during CV prediction efforts in treadmill and track.
tLim (s)
Final HR (bpm)
Final [La] (mmol∙L-1)
Treadmill (%vV̇O2max)
90% 95% 115%
817.9 ± 170.3 469.0 ± 45.0 119.7 ± 36.8*
192.3 ± 7.8 201.6 ± 8.7 204.3 ± 10.6
9.5 ± 2.5 12.8 ± 4.6 10.9 ± 3.7 Track
(meters) 3300
2100 900
943.6 ± 218.1 555.0 ± 123.5 189.0 ± 19.7*
206.6 ± 10.4 206.9 ± 13.8 197.7 ± 10.9
13.4 ± 5.6 11.7 ± 4.1 12.7 ± 1.5
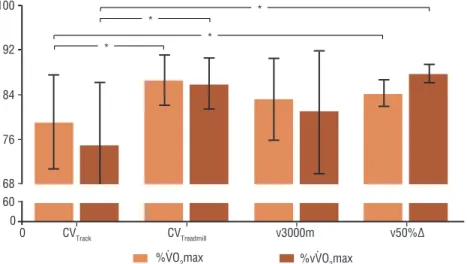
The exercise intensity contextualized by the oxidative demand in %V̇O2max and effort in %vV̇O2max differs between CVTREADMILL and CVTRACK (P = 0.03 and P = 0.02) and between CVTRACK and v50%Δ (13.7 ± 1.6 km∙h-1) (P = 0.04 and P = 0.01) when comparing them respectively by
both parameters (Figure 2). It was also verified by Figure 2 that v3000m does not characterize exercise different from CVTREADMILL and CVTRACK and v50%Δ, either when comparing them respectively by %V̇O2max (P = 0.23, P = 0.29, P = 0.15), or by %vV̇O2max (P = 0.18, P = 0.27, P = 0.47).
Figure 2. Comparison between oxidative demands (%V̇O2max) and running intensity (%vV̇O2max) corresponding to CV (track and treadmill), to v3000m (performance velocity at middle distances) and v50%Δ (corresponding to 14.2 ± 1.6 km×h-1). * Significant difference at P ≤ 0.05.
There was concordance between CVTREADMILL and CVTRACK values (Figure 3A and 3B), with 87% of variance in the treadmill evaluation associated to values determined in track and constant error of ~1.6 km∙h-1.
The sampling power (n = 7) for the association between CVTREADMILL and CVTRACK values was calculated in 94.3%, for safety level of 80% (Z1-α/2 =1.282) and Pearson’s coefficient r = 0.943.
High association between v3000m with CVTREADMILL, CVTRACK and vV̇O2max was observed, but the association between v3000m and V̇O2max was not significant (Figure 4). The sample power (n = 7) for statistically significant associations was calculated as 99.9% (Z1-b=4.03), 99.3% (Z
1-b=2.48) and 96.7% (Z1-b=1.84), respectively to ensure confidentiality of
relationships between v3000m vs. CVTRACK, v3000m vs. CVTREADMILL and v3000m vs. vV̇O2max. In these calculations, safety level of 80% (Z1-α/2 = 1.282) was adopted, with Pearson coefficients r = 0.99, r = 0.98 and r = 0.96, respectively.
Figure 4. Dispersion analysis between v3000m and CVTRACK values (Panel A), CVTREADMILL (Panel B),
vV̇O2max (Panel C) and V̇O2max (Panel D)
DISCUSSION
When estimating CV in different environments, no differences were found between absolute velocity values on track and treadmill, but the exercise conditions differed when characterized by aerobic demand (%V̇O2max) or running intensity (%vV̇O2max). Thus, it was not possible to accept the hypothesis that the evaluation environment would provide indiscriminately reciprocal CV values. In addition, CV values are mutually consistent, cor-roborating the results observed by Kranemburg and Smith8, who did not
find differences between CV values among young runners. The results also corroborated those obtained by Galbraith et al.19, whose laboratory CV
value (4.05 ± 0.22 m∙s-1) did not differ from that obtained in track (4.07
± 0.28 m∙s-1) with fixed d
Lim predictions (3600, 2400 and 1200 meters).
fixed distances.
In cycling, a sporting modality in which contextual interferences were verified during the application of the time-limit model, there are indi-cations that the laboratory performance does not ecologically reproduce some elements present in track, such as familiarity with the competition environment and equipment, providing critical power evaluations (CP, analogous to CV), with low transfer to the training and competition con-text. In fact, when comparing the oxidative demand (V̇O2) in the cycle ergometer (laboratory) and track cycling in similar power (78% V̇O2max), efficiency and economy were higher on track (~ 12% and 11%, respectively), regardless of terrain slope or pedal cadence20. This difference supported
the conclusion that tolerance is lower during exercise in the severe field in cycle ergometer (laboratory), influencing changes in the result of the mathematical model and, therefore, in the CP values (adjustment slope) and W ‘(adjustment intercept). However, Karsten et al.21 and Triska et al.22
could not confirm the existence of differences between CP values assessed in different contexts. For Karsten et al.21, even differences observed for t
Lim,
final [La-] and pedal power during velodrome (3, 7 and 12 min) and labo-ratory (80, 100 and 105% iV̇O2max) were determinant to change the CP value, even analyzing it by different linear adjustments (W-tLim and W-1/ tLim) in velodrome (234.0±24.4 vs. 235.0±24.1 W) and laboratory (234.0 ± 25.5 vs. 236.0 ± 29.1 W). In the study by Triska et al.22, the evaluation
of CP in laboratory and field conditions provided similar values (280W vs. 281W, respectively); however, the authors warned against reciprocal use due to the high variability of ~7% (95% CI: -55 to 50W) in the CP evaluation between contexts. In the present study, it was observed that many of the information described for cycling apply to track and treadmill running conditions.
Regarding the reproduction of the CV evaluation protocol on track, young runners presented exhaustion times of approximately 3, 9 and 15 minutes for the 900, 2100 and 3300 meter distances, similar to exhaus-tion times of 3, 7 and 12 minutes observed by Triska et al.13, as well as by
Galbraith et al.19 for distances of 1200, 2400 and 3600 meters. Although a
clear difference in running velocity (by associating distance and time among studies), which may have occurred due to differences in age, experience and training status in the population analyzed by Galbraith et al.19, the quality of
reproduction of the CV protocol on track is verified, regardless of age, and also, as already noted by Nimmerichter et al.23, regardless of training status.
Regarding the comparison between CV evaluation protocols performed in track and treadmill, highly correlated exhaustion time values have been reported (r = 0.89 to 0.94, P <0.01)19. However, as in the cycling evaluation,
be explained by the difficulty in elaborating paired protocols regarding the distance and exhaustion time between track and treadmill contexts19. Another
possible explanation would be the running cost (C) which, since it is inversely related to running speed, provides higher demand on the V̇O2 fraction used with the increase in velocity achieved24,25. However, since “C” is relatively
constant (= 3.8 to 3.9 J×m-1×kg-1) for distances between 800 and 5000
me-ters, the aerobic contribution would also be constant (27.1 W×kg-1 or ~2.87
mLO2×kg-1×min-1)25, which could explain differences between track and
treadmill protocols in case of time and duration discrepancies, such as higher speed performance. In addition, for being aerobic demand able to project V̇O2 to maximum and provide exhaustion as the anaerobic reserve is exhausted, which is the fundamental principle of the CV evaluation protocol1,9, it could
be assumed that the mechanical adjustments, which contextualize running on an accelerated carpet as a task distinct from that of accelerating the body itself on the track26, interfere with the efficiency of converting metabolic
energy into kinetic energy and thus change “C”25, precipitating treadmill
exhaustion by increasing anaerobic resources depletion rate.
However, it is emphasized that this difference in treadmill exhaustion time is not able to change the mathematical adjustment between distance vs. time or velocity vs. distance to the point where the CV value differs from that evaluated on the track, but justifies the prediction of relative V̇O2 demand greater for CV performance on treadmill. Therefore, it is possible to question the environmental ecology of the CV evaluation on treadmill, but in doing so, its application as a reference of running intensity transferable to the control of high-intensity aerobic training on track is also questioned. On the other hand, it could be assumed that the CV evaluation on track underestimates the maximum intensity reference, above which tolerance during exercise is compromised by metabolic acidosis, since the reference standard is designed for treadmill1,4,9. In the present study, the
relation-ship with 3000-meter performance was elevated for CV in both protocols (treadmill and track), as well as with vV̇O2max. However, CVTRACK was strongly associated (~99%) to the v3000m variation, and also CVTREADMILL and vV̇O2max, but with lower explanatory potentials (~94% and ~89%, respectively). This result can be explained by the environmental specificity, which tends to provide aerobic evaluation parameters with greater associa-tive potential with time, or performance velocity, as the highest vV̇O2max associations in track (78% and 66%, respectively), compared to vV̇O2max associations in treadmill (62% and 35%, respectively) with performance at 1500 m (tLim: 4.8 ± 0.2 min) and 5000 m (tLim: 18.2 ± 0.8 min)27. However,
for Busso and Chatagnon28, an aerobic capacity indicator becomes relevant
to estimate the performance in medium distances as the performance time is close to 10 minutes.
Thus, the association between CV and 3000-meter performance seems to be dependent on both the specificity of the assessment context and the running time for this distance. In the study by Grant et al.29, adult runners
s presented velocities corresponding to lactate thresholds (above rest and set at 4 mmol×L-1), more associated with v3000m in greater magnitude (r
= 0.93 for both) than to vV̇O2max (r = 0.86). Another study addressing 5000- meter performance determinants found that time (~19 min and 36 s) and velocity (4.29 m×s-1 or ~15.4 km×h-1) were more strongly associated
to CV (v-1×tLim-1: r = -0.77 and 0.78, respectively), than to vV̇O
2max (r =
-0.71 and 0.74, respectively) among adult runners with moderately high fitness level (V̇O2max = 63.6 mLO2∙kg-1∙min-1)30. In the present study,
involving young runners still in the formation process (V̇O2max = 54.2 ± 5.2 mLO2∙kg-1∙min-1 and with t
Lim in 3000 meters of ~14 min and 31s), it
is evident the potential of an aerobic capacity parameter (in this case CV) to index the medium-duration performance.
The limitation of the present study refers to the reduced number of efforts to predict CV that generated high SEE for the D’ on track. Above all, the implications of the present study are restricted to the age group and training status of participating runners. However, future studies should verify the similarity between laboratory vs. field environments in runners of different age groups and training status.
CONCLUSION
The results indicated that CV determined on track is a reliable parameter of exercise in the heavy domain (e.g., exercise reference with high oxidative activation rate, without requiring continuous loss of metabolic homeo-stasis), easy to apply and reduced cost, which can be used by coaches and athletes for evaluation, prescription and monitoring of training, as well as for the prediction of middle-distance performance in young runners, thus demonstrating the ecological validity of this evaluation.
COMPLIANCE WITH ETHICAL STANDARDS
Funding
This research did not receive any specific grant from funding agencies in the public, commercial, or not-for-profit sectors. This study was funded by the authors.
Ethical approval
Ethical approval was obtained from the local Human Research Ethics Committee –FC – UNESP/Bauru, and the protocol was written in ac-cordance with standards set by the Declaration of Helsinki.
Conflict of interest statement
The authors have no conflict of interests to declare.
Author Contributions
RAC, LOCS and ARS performed the experiments. DAM RAC, LOCS, ARS and DMPF analyzed data. BSD and DMPF contributed with reagents/ materials/analysis tools. DAM, RAC, BSD and DMPF wrote the paper.
REFERENCES
1. Burnley M, Jones AM. Power-duration relationship: Physiology, fatigue, and the limits of human performance. Eur J Sport Sci 2018;18(1):1-12.
2. Jones AM, Vanhatalo A. The ‘Critical Power’Concept: Applications to Sports Performance with a Focus on Intermittent High-Intensity Exercise. Sports Med 2017;47(1):65-78.
3. Broxterman RM, Ade CJ, Craig JC, Wilcox SL, Schlup SJ, Barstow TJ. The rela-tionship between critical speed and the respiratory compensation point: coincidence or equivalence. Eur J Sport Sci 2014;15(7):631-9.
4. Bull AJ, Housh TJ, Johnson GO, Rana SR. Physiological responses at five estimates of critical velocity. Eur J Appl Physiol 2008;102(6):711-20.
5. Tyler CJ, Reeve T, Hodges GJ, Cheung SS. The Effects of Heat Adaptation on Physiology, Perception and Exercise Performance in the Heat: A Meta-Analysis. Sports Med 2016;46(11):1699-1724.
6. Jones AM, Doust JH. A 1% treadmill grade most accurately reflects the energetic cost of outdoor running. J Sports Sci 1996;14(4):321-7.
7. Wendt D, van Loon LJ, Lichtenbelt WD. Thermoregulation during exercise in the heat: strategies for maintaining health and performance. Sports Med 2007;37(8):669-82.
8. Kranenburg KJ, Smith DJ. Comparison of critical speed determined from track run-ning and treadmill tests in elite runners. Med Sci Sports Exerc 1996;28(5):614-8.
9. Jones AM, Vanhatalo A, Burnley M, Morton RH, Poole DC. Critical power: implications for determination of VO2max and exercise tolerance. Med Sci Sports Exerc 2010;42(10):1876-90.
10. Simões HG, Denadai BS, Baldissera V, Campbell CS, Hill DW. Relationships and significance of lactate minimum, critical velocity, heart rate deflection and 3000 m track-tests for running. J Sports Med Phys Fitness 2005;45(4):441-51.
11. Florence S, Weir JP. Relationship of critical velocity to marathon running perfor-mance. Eur J Appl Physiol 1997;75(3):274–8.
12. Lacour JR, Padilla-Magunacelaya S, Barthelemy JC, Dormois D. The energetics of middle-distance running. Eur J Appl Physiol Occup Physiol 1990;60(1):38-43.
13. Triska C, Karsten B, Beedie C, Koller-Zeisler B, Nimmerichter A, Tschan H. Different durations within the method of best practice affect the parameters of the speed–duration relationship. Eur J Sport Sci 2018;18(3):332-40.
14. Whipp BJ. Physiological mechanisms dissociating pulmonary CO2 and O2 exchange dynamics during exercise in humans. Exp Physiol 2007;92(2):347-55.
15. Burnley M, Davison G, Baker JR. Effects of priming exercise on VO2 kinetics and the power-duration relationship. Med Sci Sports Exerc 2011;43(11):2171-9.
16. Souza KM, de Lucas RD, Salvador PCN, Helal LCAS, Guglielmo LGA, Greco CC, et al. Agreement analysis between critical power and intensity correspond-ing to 50% Δ in cyclcorrespond-ing exercise. Rev Bras Cineantropom Desempenho Hum 2016;18(2):197-206.
17. Bland JM, Altman DG. Statistical methods for assessing agreement between two methods of clinical measurement. Int J Nurs Stud 2010;47(8):931-6.
18. Díaz SP, Fernández SP. Determinación del tamaño muestral para calcular la signifi-cación del coeficiente de correlación lineal. Cad Aten Primaria 2002;9(4):209-11.
19. Galbraith A, Hopker J, Lelliott S, Diddams L, Passfield L. A single-visit field test of critical speed. Int J Sports Physiol Perform 2014;9(6):931-5.
CORRESPONDING AUTHOR
Dalton Muller Pessôa Filho São Paulo State University (UNESP) at Bauru, São Paulo, Brazil Luiz Edmundo Carrijo Coube, Avenue – 14-01 – ZIP: 17033-360
E-mail: [email protected]
are higher in the field as compared with on an Axiom stationary ergometer. J Appl Biomech 2012;28(6):636-64.
21. Karsten B, Jobson SA, Hopker J, Jimenez A, Beedie C. High agreement between laboratory and field estimates of critical power in cycling. Int J Sports Med 2014;35(4):298-303.
22. Triska C, Tschan H, Tazreiter G, Nimmerichter A. Critical Power in Laboratory and Field Conditions Using Single-visit Maximal Effort Trials. Int J Sports Med 2015;36(13):1063-8.
23. Nimmerichter A, Steindl M, Williams CA. Reliability of the Single-Visit Field Test of Critical Speed in Trained and Untrained Adolescents. Sports 2015;3(4):358-68.
24. Pugh LG. Oxygen intake in track and treadmill running with observations on the effect of air resistance. J Physiol 1970;207(3):823-35.
25. Di Prampero PE, Capelli C, Pagliaro P, Antonutto G, Girardis M, Zamparo P, et al. Energetics of best performances in middle-distance running. J Appl Physiol 1993;74(5):2318-24.
26. Van Caekenberghe I, Segers V, Willems P, Gosseye T, Aerts P, De Clercq D. Me-chanics of overground accelerated running vs. running on an accelerated treadmill. Gait Posture 2013;38(1):125-31.
27. Souza KM, de Lucas RD, Grossi T, Costa VP, Guglielmo LGA, Denadai BS. Predição da performance de corredores de endurance por meio de testes de labo-ratório e pista. Rev Bras Cineantropom Desempenho Hum 2014;16(4):466-74.
28. Busso T, Chatagnon M. Modelling of aerobic and anaerobic energy production in middle-distance running. Eur J Appl Physiol 2006;97(6):745-54.
29. Grant S, Craig I, Wilson J, Aitchison T. The relationship between 3 km running performance and selected physiological variables. J Sports Sci 1997;15(4):403-10.