Submitted to: Phys. Rev. D
CERN-PH-EP-2015-071
April 17, 2015
Search for long-lived, weakly interacting particles that
decay to displaced hadronic jets in proton–proton collisions
at
√
s = 8 TeV with the ATLAS detector
The ATLAS Collaboration
Abstract
A search for the decay of neutral, weakly interacting, long-lived particles using data collected
by the ATLAS detector at the LHC is presented. This analysis uses the full dataset recorded in
2012: 20.3 fb
−1of proton–proton collision data at
√
s = 8 TeV. The search employs techniques for
reconstructing decay vertices of long-lived particles decaying to jets in the inner tracking detector
and muon spectrometer. Signal events require at least two reconstructed vertices. No significant
excess of events over the expected background is found, and limits as a function of proper lifetime
are reported for the decay of the Higgs boson and other scalar bosons to long-lived particles and
for Hidden Valley Z
0and Stealth SUSY benchmark models. The first search results for displaced
decays in Z
0and Stealth SUSY models are presented. The upper bounds of the excluded proper
lifetimes are the most stringent to date.
c
2015 CERN for the benefit of the ATLAS Collaboration.
Reproduction of this article or parts of it is allowed as specified in the CC-BY-3.0 license.
jets in proton–proton collisions at
s = 8 TeV with the ATLAS detector
The ATLAS CollaborationA search for the decay of neutral, weakly interacting, long-lived particles using data collected by the ATLAS detector at the LHC is presented. This analysis uses the full dataset recorded in 2012: 20.3 fb−1 of proton–proton collision data at√s = 8 TeV. The search employs techniques for reconstructing decay vertices of long-lived particles decaying to jets in the inner tracking detector and muon spectrometer. Signal events require at least two reconstructed vertices. No significant excess of events over the expected background is found, and limits as a function of proper lifetime are reported for the decay of the Higgs boson and other scalar bosons to long-lived particles and for Hidden ValleyZ0and Stealth SUSY benchmark models. The first search results for displaced decays inZ0and Stealth SUSY models are presented. The upper bounds of the excluded proper lifetimes are the most stringent to date.
I. INTRODUCTION
This paper describes a search for long-lived neutral particles (LLPs), produced by proton–proton interac-tions at √s = 8 TeV, that decay to hadronic jets far from the interaction point (IP). The search is performed using data collected with the ATLAS detector at the Large Hadron Collider (LHC). These decays can result in secondary decay vertices (displaced vertices) that can be highly displaced from the IP. This analysis focuses on displaced vertices occurring in the inner tracking detector (ID) and muon spectrometer (MS). The event selection criteria and vertex reconstruction algorithms employed by this analysis result in a generic, model-independent selection of candidate events with two displaced vertices. Many extensions of the Standard Model (SM) include particles that are neutral, weakly coupled, and long-lived that can decay to final states containing several hadronic jets. Such extensions include gauge-mediated supersym-metry breaking (GMSB) models [1], the minimal super-symmetric standard model (MSSM) with R-parity viola-tion [2], inelastic dark matter models [3], Hidden Valley scenarios [4–6], stealth supersymmetry (Stealth SUSY) models [7, 8], two-Higgs-doublet models (2HDM) [9], and a recent baryogenesis model [10]. Independent of a specific model, Higgs fields (scalar fields) can couple to hidden-sector fields that are singlets under the SM gauge group. Such couplings can result in the SM sector mixing with a hidden sector [11] and depending on the value of these couplings, the lifetime of the hidden-sector parti-cles can be sufficiently long to result in highly displaced decays.
The results of this search are interpreted in the con-text of three benchmark models. Two models are Hidden Valley scenarios. The first involves the decay of a scalar boson to a pair of long-lived neutral particles (scalars or pseudoscalars) that each decay to a pair of hadronic jets. The second model has a heavy Z0boson that de-cays to long-lived, as well as prompt, neutral particles that decay to hadronic jets. The third is a variant of Stealth SUSY in which a pair of gluinos decay to long-lived singlinos, which in turn each decay to a low-mass
gravitino and a pair of hadronic jets. While all measure-ments of branching ratios and couplings for the recently discovered Higgs boson are consistent with SM expecta-tions [12–15], the current measurement uncertainties do not exclude non-SM decay modes with a branching ratio of up to 30% [15–17]. Therefore, the decay of the Higgs boson to a pair of long-lived scalars or pseudoscalars is also explored. Such long-lived scalars or pseudoscalars that couple to the SM by mixing with a scalar boson or the Higgs boson do so via a Yukawa coupling, and thus the couplings to fermions and antifermions are propor-tional to the fermion mass.
To date, no search has observed evidence of long-lived neutral particles decaying to hadronic jets. Searches were carried out at the Tevatron (√s = 1.96 TeV) by both the CDF [18] and D0 [19] collaborations, at the LHC by the LHCb collaboration in proton–proton collisions at √s = 7 TeV [20], and more recently by the ATLAS and CMS collaborations [21, 22] at √s = 8 TeV. These searches were mainly restricted to decays within the in-ner tracking volume of the detectors and thus explored primarily a mean proper lifetime (cτ ) of less than 1 m.
This work significantly extends the cτ range of the AT-LAS search for a light scalar boson decaying to long-lived neutral particles at √s = 7 TeV in 1.94 fb−1 of 2011 proton–proton collision data at the LHC [23] that cov-ered the cτ region 1 to 20 m. Additionally, it extends the range of proper lifetimes excluded by a recent ATLAS analysis [24], which uses the same scalar boson model and mass points but focuses on displaced decays in the hadronic calorimeter.
This analysis also reports the results of the first search for displaced hadronic jets from heavy Z0boson and Stealth SUSY decays.
II. ATLAS DETECTOR
The ATLAS detector [25], which has nearly 4π stera-dian coverage in solid angle, is a multipurpose detector consisting of an inner tracking detector embedded in a superconducting solenoid, electromagnetic and hadronic
calorimeters (ECal and HCal), and a muon spectrometer incorporating magnetic fields produced by three super-conducting, air-core toroidal magnets each comprised of eight coils. The ID covers the range 0.05 m < r <1.1 m and |z| < 3.5 m.1 It consists of a silicon pixel
detec-tor, a silicon microstrip detector (semiconductor tracker, SCT), and a straw tube tracker (transition radiation tracker, TRT). Together, the three systems provide preci-sion tracking of charged particles for |η| < 2.5. Three ra-dial layers of high-granularity silicon pixel detectors cover the region around the IP followed by the SCT, which provides up to four two-dimensional measurement points per track. The TRT provides additional information for track reconstruction in the region |η| < 2.0.
The calorimeter system covers the pseudorapidity range |η| < 4.9. Within the region |η| < 3.2, electromag-netic calorimetry is provided by high-granularity, liquid-argon (LAr) barrel and endcap electromagnetic calorime-ters with lead absorbers. An additional thin LAr presam-pler covering |η| < 1.8 is used to correct for energy loss in material upstream of the calorimeters. The ECal extends from 1.5 m to 2.0 m in r in the barrel and from 3.6 m to 4.25 m in |z| in the endcaps.
Hadronic calorimetry is provided by a
steel/scintillating-tile calorimeter, segmented into three barrel structures within |η| < 1.7, and two cop-per/LAr hadronic endcap calorimeters. The solid angle coverage is completed with forward copper/LAr and tungsten/LAr calorimeter modules optimized for elec-tromagnetic and hadronic measurements, respectively. The HCal covers the region from 2.25 m to 4.25 m in r in the barrel and from 4.3 m to 6.05 m in |z| in the endcaps. Together the ECal and HCal have a thickness of 9.7 interaction lengths at η = 0.
The MS comprises separate trigger and tracking cham-bers that measure the deflection of muons in a magnetic field generated by superconducting air-core toroids. The chamber system covers the region |η| < 2.7 with three layers of monitored drift tubes, complemented by cath-ode strip chambers in the forward region.
Three stations of resistive plate chambers (RPC) and thin gap chambers (TGC) are used for triggering in the MS barrel and endcaps, respectively. The barrel chamber system is subdivided into sixteen sectors: eight large sec-tors (between the magnet coils) and eight small secsec-tors (inside the magnet coils). As a result, the first two RPC stations, which are radially separated by 0.5 m, start at a radius of either 7 m (large sectors) or 8 m (small
sec-1 ATLAS uses a right-handed coordinate system with its origin
at the nominal interaction point (IP) in the center of the de-tector and the z-axis along the beam pipe. The x-axis points from the IP to the center of the LHC ring, and the y-axis points upwards. Cylindrical coordinates (r, φ) are used in the trans-verse plane, where φ is the azimuthal angle around the z-axis. The pseudorapidity is defined in terms of the polar angle θ as η = − ln tan(θ/2). Angular distance is measured in units of ∆R ≡p(∆η)2+ (∆φ)2.
tors). The third station is located at a radius of either 9 m (large sectors) or 10 m (small sectors). In the end-caps the first TGC station is located at |z| = 13 m. The other two stations start at |z| = 14 m and are separated by 0.5 m in z. The muon trigger system covers the range |η| < 2.4.
The ATLAS trigger system has three levels [26]. The first level (L1), which is a hardware-based system, uses coarse data collected from the calorimeters and muon detectors. The second (L2) and third (Event Filter, EF) levels are software-based systems that use information from all of the ATLAS subdetectors. Together, L2 and EF are called the High Level Trigger (HLT). L1 thresh-olds are applied to transverse energy (ET) for calorimeter triggers and transverse momentum (pT) for muon trig-gers. The L1 trigger identifies (η,φ) Regions of Interest (RoIs) associated with a specific physics signature. The HLT makes use of the RoIs to access the full information for the most important parts of the event.
The implementation of the L1 muon trigger logic is similar for both the RPC and TGC systems. Each of the three planes of the RPC system and the two outermost planes of the TGC system consist of a doublet of inde-pendent detector layers. The first TGC plane contains three detector layers. A low-pT muon RoI is generated by requiring a coincidence of hits in at least three of the four layers of the two inner RPC planes for the barrel and of the two outer TGC planes for the endcaps. A high-pT muon RoI requires, in addition to a low-pTmuon, hits in at least one of the two layers of the outer RPC plane for the barrel or in two of the three layers of the innermost TGC plane for the endcaps. The muon RoIs have a spa-tial extent of 0.2 × 0.2 in ∆η × ∆φ in the MS barrel and 0.1 × 0.1 in ∆η × ∆φ in the MS endcaps. Only the two highest-pTRoIs per MS sector are used by the HLT.
The L1 calorimeter trigger is based on information from the calorimeter elements within projective regions, called trigger towers. The trigger towers have a size of approximately 0.1 in ∆η and ∆φ in the central part of the calorimeter, |η| < 2.5, and are larger and less uniform in the more forward region.
III. ANALYSIS STRATEGY
Hadronic decays that are displaced from the IP leave a unique detector signature that can be reconstructed as a displaced vertex. This analysis searches for events with two displaced vertices in either the ID or MS, or one in each.
This analysis studies two separate channels, defined by the triggers used to select events. The ATLAS Muon RoI Cluster trigger [27] is used to preselect events that satisfy displaced-decay criteria in the MS. The search for both the scalar boson and Stealth SUSY models makes use of events selected by the Muon RoI Cluster trigger. The sample of events selected by this trigger belongs to the Muon Cluster channel.
The large multiplicity of long-lived particles in the Z0benchmark samples causes many events to fail to sat-isfy the isolation criteria of the Muon RoI Cluster trigger, but also provides other objects on which to trigger. The large number of long-lived particles per event results in a higher probability for at least one of the particles to decay sufficiently promptly to generate a jet and another to decay with a sufficiently large radius to contribute to missing transverse momentum. The negative vector sum of the momenta in the plane transverse to the beam line of all particles detected in a pp collision is called miss-ing transverse momentum, EmissT , and its magnitude is denoted by Emiss
T [28,29].
A jet plus Emiss
T trigger is thus used for selecting events from the Z0model. It allows for the inclusion of events with displaced decays in the ID but none in the MS. These events belong to the Jet+Emiss
T channel.
In scalar boson and Stealth SUSY events the two dis-placed decays are in an approximately back-to-back con-figuration and thus events do not have high Emiss
T . Addi-tionally, unless one of the LLPs decays in the ID, scalar boson benchmark sample events would not contain a suf-ficiently high energy jet to satisfy the jet pTrequirement of the Jet+Emiss
T trigger.
To reconstruct the vertex of a displaced decay, the analysis uses two separate reconstruction algorithms: one for inner detector vertices (described in Sec.VII) and one for muon spectrometer vertices [30]. In order to reduce backgrounds, an event is considered as a signal candidate only if two displaced decays are reconstructed. This se-lection results in the following event topologies: two ID vertices (2IDVx), two MS vertices (2MSVx) and one ver-tex in the MS and one in the ID (IDVx+MSVx). The analysis is structured in a way that makes it sensitive to many models with displaced decays. Although events are required to have two reconstructed vertices, other recon-structed objects may be present. The topologies appli-cable and models analysed for each analysis channel are summarized in TableI.
TABLE I. The topologies considered in the analysis and the corresponding triggers and benchmark models.
Trigger Applicable topologies Benchmarks
Muon RoI
IDVx+MSVx, 2MSVx Scalar boson,
Cluster Stealth SUSY
Jet+Emiss
T 2IDVx, IDVx+MSVx, 2MSVx Z0
IV. DESCRIPTION OF BENCHMARK MODELS
A. Hidden Valley
Hidden Valley (HV) scenarios [4–6] are a general class of models in which a hidden sector (v-sector) is added to the SM. All of the SM particles are neutral under
the v-sector gauge group, and the v-sector particles (v-particles) are neutral under the SM gauge group. Be-cause the v-particles do not couple directly to the SM, decays of v-particles to SM particles must occur via com-municator particles. Depending on the masses of the communicators and their couplings, this can result in long lifetimes for the lightest v-particles. Two communi-cators are considered, giving rise to different signatures in the detector.
The first scenario, shown in Fig.1(a), predicts a scalar boson Φ mixing with a hidden-sector scalar boson Φhs. The hidden sector contains the communicator, Φhs, and a v-isospin triplet of πv particles. The Φhs decays to a pair of these πv particles, which then decay back to SM particles, again via Φhs–Φ mixing. Because of the Yukawa coupling, each πvdecays predominantly to heavy fermions, bb, cc, and τ+τ− in the ratio 85:5:8, provided mπv < 2mtop. The branching ratio for Φ decaying into a pair of hidden sector particles is not constrained in these models. It is therefore interesting to focus both on Higgs boson decays to long-lived particles, where Φ is the SM Higgs boson, and on other Φ mass regions previously unexplored for decays to long-lived particles.
The second scenario involves a massive communica-tor (Z0) produced by quark–antiquark annihilation and decaying into the hidden sector via Z0 → q
vq¯v. The v-quarks hadronize into showers of πv particles. For the particular mass benchmarks used in this analysis, the π0
v decays promptly, while the πv± lifetime is a free pa-rameter. The ± and 0 superscripts for the πv indicate a charge under the v-sector gauge group, v-isospin, and not electric charge. This process is shown in Fig.1(b).
B. Stealth SUSY
Stealth SUSY models [7, 8] are a class of R-parity-conserving SUSY models that do not have large Emiss
T signatures. While this can be accomplished in many different ways, this search explores a model that involves adding a hidden-sector (stealth) singlet superfield S at the electroweak scale, which has a superpartner singlino
˜
S. By weakly coupling the hidden sector to the MSSM, the mass splitting between S and ˜S (δM ) is small, assum-ing low-scale SUSY breakassum-ing. High-scale SUSY break-ing also can be consistent with small mass splittbreak-ing and Stealth SUSY, although this requires a more complex model and is not considered in this search [8].
The SUSY decay chain ends with the singlino decaying to a singlet plus a low-mass gravitino ˜G, where the grav-itino carries off very little energy and the singlet promptly decays to two gluons. The effective decay processes are ˜
g → ˜Sg (prompt), ˜S → S ˜G (not prompt), and S → gg (prompt). This scenario results in one prompt gluon and two displaced gluon jets per gluino decay. Since R-parity is conserved, each event necessarily produces two gluinos, resulting in two displaced vertices. A Feynman diagram of this process is shown in Fig.1(c).
Φ Φhs πv πv p p f ¯ f ¯ f f (a) Z0 π± v π± v π±v π0v π0 v p p f f¯ ¯ f f f f¯ ¯ f f ¯ f f (b) ˜ g ˜ g ˜ S S ˜ S S p p g g g ˜ G g g g ˜ G (c)
FIG. 1. Diagrams of the benchmark models studied in this analysis: (a) the Higgs boson or scalar boson model, (b) the Hidden ValleyZ0model, and (c) the Stealth SUSY model. The long-lived particles in these processes are represented by double lines and labeled (a)πv, (b)πv±, and (c) ˜S. The gravitino, ˜G, has very low mass and does not carry away a substantial amount of energy.
The decay width (and, consequently, the life-time) of the singlino is determined by both the mass splitting δM and the SUSY-breaking scale √F :
ΓS˜→ S ˜G ≈ mS˜(δM )4/πF2 [7]. The SUSY-breaking
scale√F is not a fixed parameter, and thus the singlino has the possibility of traveling an appreciable distance through the detector, leading to a significantly displaced vertex.
V. DATA AND SIMULATION SAMPLES
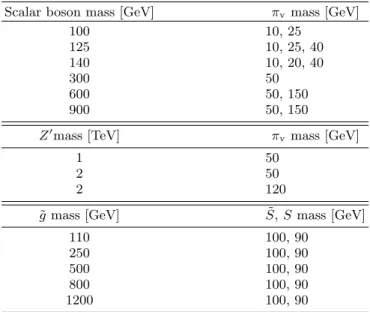
The dataset used in this analysis was recorded by the ATLAS detector in the 2012 run during periods in which all subdetectors relevant to the analysis were operating efficiently. The integrated luminosity is 20.3 fb−1. The Muon Cluster channel uses only 19.5 fb−1of data because the trigger was not active at the beginning of the run. The uncertainty on the integrated luminosity, estimated following the methodology described in Ref. [31], is 2.8%. Monte Carlo (MC) simulation samples are produced for scalar boson, Z0, and Stealth SUSY models. The masses are chosen to span the accessible parameter space, and the proper lifetime values are chosen to maximize the distribution of decays throughout the ATLAS detector volume. The masses for each sample are listed in Ta-ble II. Approximately 400,000 events are generated for each sample.
For the scalar boson model, the MC simulation events are generated with Pythia8 [32]. The Z0events are sim-ulated in a two-step process. An external generator, HVMC, is used to simulate Z0production and decay to hidden-sector particles [33]. The decay of πv to SM par-ticles and their subsequent decays, as well as the shower-ing and hadronization of SM partons, are simulated us-ing Pythia8. Stealth SUSY events are generated with MadGraph5 [34], and Pythia8 is used for hadroniza-tion. The parameterization used for the proton parton distribution function (PDF) for the scalar boson and Z0simulations is MSTW2008 [35], while CTEQ 6L1 [36]
is used for Stealth SUSY.
TABLE II. Mass parameters for the simulated scalar boson, Z0and Stealth SUSY models.
Scalar boson mass [GeV] πvmass [GeV]
100 10, 25 125 10, 25, 40 140 10, 20, 40 300 50 600 50, 150 900 50, 150
Z0mass [TeV] πvmass [GeV]
1 50
2 50
2 120
˜
g mass [GeV] S, S mass [GeV]˜
110 100, 90
250 100, 90
500 100, 90
800 100, 90
1200 100, 90
For all simulated samples, the propagation of particles through the ATLAS detector is modeled with Geant4 [37] using the full ATLAS detector simulation [38] for all the simulated samples. In addition, each MC sample is overlaid with zero-bias data events that are selected from bunch crossings corresponding to one full revolu-tion around the LHC after a high-pTinteraction. This overlaid data sample correctly represents all sources of detector background such as cavern background (a gas of thermal neutrons and photons filling the ATLAS cav-ern during ATLAS operation), beam halo, cosmic rays and electronic noise. It also correctly reproduces pileup interactions (multiple interactions per bunch crossing).
The analysis employs data-driven techniques to esti-mate the backgrounds. Two separate samples from data are used: multijet and minimum-bias [39] events. The ATLAS minimum bias trigger selects events with
activ-ity in the range 2.1 < |η| < 3.8 and 360◦ in φ. Multijet events are selected using a set of single-jet triggers with various transverse energy thresholds. Simulated multijet samples are employed for characterizing displaced ver-tices when the multijet data sample is statistically lim-ited. These are generated with Pythia8 and the CT10 PDF set [40].
VI. TRIGGER
A. Muon RoI Cluster trigger
The Muon RoI Cluster trigger is a signature-driven trigger that selects decays of neutral particles in the MS. It is used to select candidate events for the scalar boson and Stealth SUSY searches, and is efficient for hadronic decays occurring in the region from the outer radius of the HCal to the middle of the MS. The trigger se-lects events with a cluster of muon RoIs contained in a ∆R = 0.4 cone that are preceded by little or no activ-ity in the ID or calorimeters. This isolation requirement reduces backgrounds from muon bremsstrahlung and punch-through jets. A punch-through jet is a hadronic or electromagnetic shower not contained in the calorimeter volume, which results in tracks in the MS. The details of the performance and implementation of this trigger on both a set of MC simulated benchmark samples and data can be found in Ref. [27].
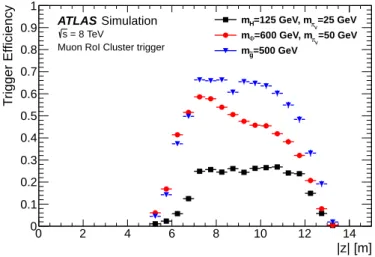
The trigger efficiency, defined as the fraction of long-lived particles selected by the trigger as a function of the long-lived particle decay position, is shown in Figs. 2 and 3 for three MC simulated benchmark sam-ples. The uncertainties shown are statistical only. The relative differences in efficiencies are a result of the dif-ferent kinematics between benchmark samples.
r [m] 0 1 2 3 4 5 6 7 8 9 10 T ri g g e r E ff ic ie n c y 0 0.1 0.2 0.3 0.4 0.5 0.6 0.7 0.8 0.9 1 ATLAS Simulation = 8 TeV s
Muon RoI Cluster trigger
=25 GeV V π =125 GeV, m H m =50 GeV V π =600 GeV, m Φ m =500 GeV g ~ m
FIG. 2. Efficiency for the Muon RoI Cluster trigger in the barrel as a function of the decay position of the long-lived particle for three simulated benchmark samples.
|z| [m] 0 2 4 6 8 10 12 14 T ri g g e r E ff ic ie n c y 0 0.1 0.2 0.3 0.4 0.5 0.6 0.7 0.8 0.9 1 ATLAS Simulation = 8 TeV s
Muon RoI Cluster trigger
=25 GeV V π =125 GeV, m H m =50 GeV V π =600 GeV, m Φ m =500 GeV g ~ m
FIG. 3. Efficiency for the Muon RoI Cluster trigger in the endcaps as a function of the the decay position of the long-lived particle for three simulated benchmark samples.
B. Jet+Emiss
T trigger
A single-jet plus Emiss
T trigger is employed for the Z0search. The trigger uses a leading jet E
Tthreshold of 110 GeV and an Emiss
T threshold of 75 GeV. Offline re-quirements are a leading jet pT≥ 120 GeVand ETmiss ≥ 200 GeV, which result in a constant trigger efficiency as a function of both pTand ETmiss. For events passing the offline requirements, the trigger efficiency is 87–100%, de-pending on the MC simulated Z0benchmark sample.
VII. PHYSICS OBJECTS AND DISPLACED
VERTEX RECONSTRUCTION Hadronic jets, Emiss
T , and displaced vertices are used in this search.
The anti-kt jet algorithm [41] with a radius param-eter of 0.4 is used to reconstruct jets from topological clusters, which are three-dimensional clusters of neigh-boring energy deposits in the calorimeter cells. A cali-bration procedure is used in which the raw energy mea-surements from these clusters are corrected to the jet energy scale [42]. Identifying displaced long-lived parti-cle decays in the ATLAS detector critically depends on the ability to reliably reconstruct displaced vertices. In the ATLAS MS, the standalone MS vertex reconstruction algorithm [30] is used to reconstruct displaced vertices. Displaced vertices in the ID are reconstructed using a modified version of the algorithm used for reconstructing primary vertices [43].
A. Track and vertex reconstruction in the inner tracking detector
The default ID track reconstruction algorithm [43] uses hits in the silicon detectors to form tracks, and then adds TRT hits to extend the tracks. Next, the algorithm con-structs segments from TRT hits and extrapolates to add in leftover silicon hits (pixel and SCT hits). After the default track reconstruction is complete, there remains a collection of hits that are not associated with any track. The signatures studied in this analysis produce many such unassociated hits because the impact parameters of tracks from a displaced decay are often larger than the maximum impact parameter allowed by the default track reconstruction algorithm. During track reconstruction, the impact parameters are calculated as the distance of a track from the nominal detector center.
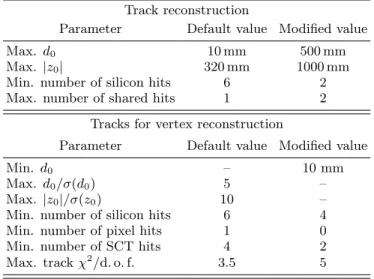
Displaced tracks are reconstructed by using the unas-sociated hits in a second iteration of track finding. This second iteration is performed with modified requirements on the track impact parameters, the minimum number of silicon hits per track that are not shared with another track, and the maximum number of hits shared with an-other track. Displaced vertices from decays that occur in the outermost region of the pixel detector or just before silicon layers are more likely to have a high fraction of hits shared with another track, since the decay products may not be well separated. The default and modified require-ments are listed in the upper part of Table III, where the transverse and longitudinal impact parameters are denoted by d0 and z0, respectively.
An algorithm to identify secondary vertices in the ID was developed for this analysis. The algorithm, based on the ATLAS primary vertex reconstruction algorithm, searches for a group of tracks and then performs a fit to find candidate vertices. The constraint that the recon-structed vertex must be compatible with the beam spot position is removed, and the parameters of the tracks usable for vertex finding are modified. Here, impact pa-rameters are recalculated to be with respect to the cen-ter of the beam spot. The lower part of TableIII sum-marizes the changes from the default selection made to the track impact parameter significances and the number of silicon hits required per track. In addition, a mini-mum d0requirement of 10 mm is applied, which removes any remaining tracks originating from the IP. If a recon-structed vertex has associated tracks that have hits at radii smaller than the radial distance of the vertex from the beamline, those tracks are removed and the vertex is refitted.
In MC simulated benchmark samples, reconstructed vertices are considered matched to simulated long-lived particle decay vertices if the reconstructed vertex is within 5 mm of the simulated decay position. In addi-tion, at least two tracks from the reconstructed vertex are required to be matched to particles from the simu-lated decay vertices.
A significant fraction of background vertices originate
TABLE III. Default and modified parameters used for track reconstruction and for the selection of tracks used for dis-placed vertex reconstruction.
Track reconstruction
Parameter Default value Modified value
Max.d0 10 mm 500 mm
Max. |z0| 320 mm 1000 mm
Min. number of silicon hits 6 2
Max. number of shared hits 1 2
Tracks for vertex reconstruction
Parameter Default value Modified value
Min. d0 – 10 mm
Max.d0/σ(d0) 5 –
Max. |z0|/σ(z0) 10 –
Min. number of silicon hits 6 4
Min. number of pixel hits 1 0
Min. number of SCT hits 4 2
Max. trackχ2/d. o. f. 3.5 5
from hadronic interactions in material layers of the silicon detectors. To remove this background, a material veto is implemented by using an algorithm that calculates the distance between a vertex and the closest material layer. The methodology is similar to that used in Ref. [44].
To remove vertices that are consistent with originating from within a material layer, the variable d/σ is defined, where d/σ is the distance to the closest material layer divided by the vertex position uncertainty. Vertices with d/σ < 6 are assumed to be due to material interactions and are therefore rejected. For vertices in the pixel layers, the vertex position is transformed into the local coordi-nates of the closest pixel module, and vertices that are reconstructed in the module volume are vetoed. Vertices reconstructed in the pixel support structures in both the barrel and the endcaps are also vetoed.
To reject poorly reconstructed vertices resulting from random track crossings or a prompt track passing close to a displaced low track-multiplicity secondary vertex, the χ2 probability of the vertex fit is required to be greater than 0.001.
A third selection criterion is based on the per-vertex track multiplicity. Background vertices, both from mate-rial interactions and from random intersections of tracks, have on average a lower track multiplicity than signal vertices (Fig.4). The metric S/√B is used to select ap-propriate requirements on the track multiplicity, where S and B are the fraction of vertices retained after applying a given requirement in signal and background, respec-tively. A single minimum track multiplicity cut is chosen for each analysis channel. Vertices reconstructed in the Jet+Emiss
T channel are required to contain at least seven tracks. For the Muon Cluster channel, vertices must con-tain at least five tracks. This lower minimum vertex track multiplicity is chosen based on the scalar boson bench-mark samples with mπv = 10 and 25 GeV, which have a
lower track multiplicity than the other benchmark sam-ples.
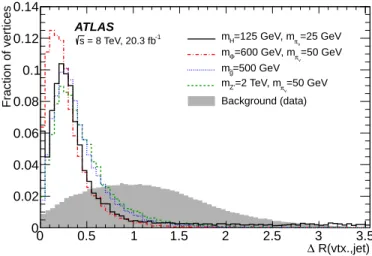
Figure 5 shows that a significant fraction of recon-structed vertices in the signal simulations are followed by a jet. The jets used in this study are required to satisfy the ATLAS medium jet criteria [45] and have pT > 20 GeV. The metric S/√B is again used to select appropri-ate requirements, and vertices in the Jet+Emiss
T channel must lie within a ∆R = 0.6 cone around a jet axis. For the Muon Cluster channel, vertices are required to be within a ∆R = 0.4 cone around a jet axis.
Vertex track multiplicity
2 4 6 8 10 12 14 16 18 Fraction of vertices 0 0.1 0.2 0.3 0.4 0.5 0.6 0.7 0.8 0.9 ATLAS -1 = 8 TeV, 20.3 fb s mH=125 GeV, mπv=25 GeV =50 GeV v π =600 GeV, m Φ m =500 GeV g ~ m =50 GeV v π =2 TeV, m Z' m Background (data)
FIG. 4. Track multiplicity for vertices obtained from four signal benchmark samples and background multijet events.
R(vtx.,jet) ∆ 0 0.5 1 1.5 2 2.5 3 3.5 Fraction of vertices 0 0.02 0.04 0.06 0.08 0.1 0.12 0.14 =25 GeV v π =125 GeV, m H m =50 GeV v π =600 GeV, m Φ m =500 GeV g ~ m =50 GeV v π =2 TeV, m Z' m Background (data) ATLAS -1 = 8 TeV, 20.3 fb s
FIG. 5. ∆R between the ID vertex and the central axis of the nearest jet for vertices from four signal benchmark samples and background multijet events.
The final selection criteria are given in TableIV. The effect on the efficiency of applying the criteria to signal MC events ranges from 15–30%, depending on the bench-mark model.
Figure6 shows the ID vertex reconstruction efficiency for a selection of benchmark samples. The efficiency is
defined as the fraction of simulated decays in the ID that are matched to a reconstructed vertex satisfying the se-lection criteria. The fluctuations of the efficiency plot is caused by the removal of vertices that are near material. TABLE IV. Good-vertex criteria for vertices reconstructed in the ID.
Requirement Muon Cluster channel Jet+ETmisschannel
d/σ from material ≥ 6 ≥ 6 Vertexχ2 prob. > 0.001 > 0.001 ∆R(vtx,jet) < 0.4 < 0.6 Number of tracks ≥ 5 ≥ 7 r [m] 0 0.05 0.1 0.15 0.2 0.25 0.3 ID V e rt e x R e c o n s tr u c ti o n E ff ic ie n c y 0 0.1 0.2 0.3 0.4 0.5 0.6 0.7 ATLAS Simulation = 8 TeV s =25 GeV V π =125 GeV, m H m =50 GeV V π =600 GeV, m Φ m =500 GeV g ~ m =50 GeV V π =2 TeV, m Z' m
FIG. 6. ID vertex reconstruction efficiency as a function of the radial decay position of the long-lived particle for scalar boson, Stealth SUSY, andZ0benchmark samples.
B. Vertex reconstruction in the muon spectrometer Vertices in the MS are reconstructed by forming track segments from hits in the two multilayers of an MDT chamber and pairing the segments to form tracklets. These tracklets are then fit to vertices using the algo-rithm detailed in Ref. [30].
Detectable decay vertices are located in the region be-tween the outer edge of the HCal and before the middle station of the muon chambers. The primary source of background to long-lived particles decaying to hadronic jets in the MS is jets that punch through the calorime-ter. A series of criteria are applied to the reconstructed vertices in order to reject vertices due to background pro-cesses. These criteria were determined by comparing sig-nal MC events to simulated multijet events generated across a broad range of jet pTvalues.
The criteria are established by optimizing S/√B, where S and B are respectively the fraction of signal and background events that survive after imposing a partic-ular selection criterion. Multijet events that contain
ver-TABLE V. Summary of criteria for good MS vertices in the barrel and endcap regions.
Requirement Barrel Endcap
MDT hits 300 ≤nMDT< 3000 300 ≤ nMDT< 3000
RPC/TGC hits nRPC≥ 250 nTGC≥ 250
Track isolation ∆R < 0.3 ∆R < 0.6
Track ΣpT ΣpT< 10 GeV ΣpT< 10 GeV
Jet isolation ∆R < 0.3 ∆R < 0.6
tices should have ID tracks and jets that both connect the vertex to the IP. To reduce the acceptance of fake vertices from multijet events, good vertices are required to be isolated with respect to ID tracks and calorimeter jets. The jets considered for isolation must satisfy both ET > 30 GeV and log10(EHAD/EEM) < 0.5. The value log10(EHAD/EEM) gives a measure of the fraction of en-ergy in the jet that is deposited in the HCal (EHAD) and the fraction deposited in the ECal (EEM). This require-ment ensures that vertices origimating from long-lived particles that decay near the outer edge of the hadronic calorimeter and also have significant MS activity are not rejected.
An MS vertex due to a displaced decay typically has many more hits than an MS vertex from a jet that punches through the calorimeter, so a minimum num-ber of MDT and RPC/TGC hits is required. A max-imum number of MDT hits is also applied to remove background events caused by coherent noise bursts in the MDT chambers. The minimum required number of RPC/TGC hits also helps to further reject these noisy events, since a noise burst in the MDT system is not expected to be coherent with one in the muon trigger system.
Table V summarizes the optimized criteria for select-ing good MS vertices. These criteria select about 60–70% (40–60%) of MS vertices for the scalar boson and Stealth SUSY (Z0) samples, with a moderate difference between the various samples, while reducing the multijet back-ground to a negligible value.
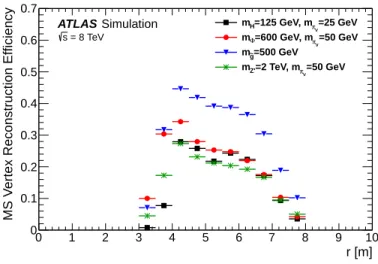
The efficiency for vertex reconstruction is defined as the fraction of simulated long-lived particle decays in the MS fiducial volume that match a reconstructed vertex satisfying all of the good-vertex criteria. A vertex is considered matched to a displaced decay if the vertex is within ∆R = 0.4 of the simulated decay position. Fig-ure7 shows the efficiency for reconstructing a vertex in the MS barrel for a selection of benchmark samples. Fig-ure8 shows the efficiency for reconstructing a vertex in the MS endcaps.
The MS barrel vertex reconstruction efficiency is 30– 40% near the outer edge of the hadronic calorimeter (r ≈ 4 m) and it substantially decreases as the decay oc-curs closer to the middle station (r ≈ 7 m). The decrease occurs because the charged hadrons and photons are not spatially separated and overlap when they traverse the middle station. This results in a reduction of the
efficien-r [m] 0 1 2 3 4 5 6 7 8 9 10 M S V e rt e x R e c o n s tr u c ti o n E ff ic ie n c y 0 0.1 0.2 0.3 0.4 0.5 0.6 0.7 ATLAS Simulation = 8 TeV s =25 GeV V π =125 GeV, m H m =50 GeV V π =600 GeV, m Φ m =500 GeV g ~ m =50 GeV V π =2 TeV, m Z' m
FIG. 7. Barrel MS vertex reconstruction efficiency as a function of the radial decay position of the long-lived particle for scalar boson, Stealth SUSY, andZ0benchmark samples.
|z| [m] 0 2 4 6 8 10 12 14 M S V e rt e x R e c o n s tr u c ti o n E ff ic ie n c y 0 0.1 0.2 0.3 0.4 0.5 0.6 0.7 0.8 0.9 1 = 8 TeV s ATLAS Simulation =25 GeV V π =125 GeV, m H m =50 GeV V π =600 GeV, m Φ m =500 GeV g ~ m =50 GeV V π =2 TeV, m Z' m
FIG. 8. Endcap MS vertex reconstruction efficiency as a function of the |z| decay position of the long-lived particle for scalar boson, Stealth SUSY, andZ0benchmark samples.
cies for track reconstruction and, consequently, vertex reconstruction. The efficiency for reconstructing vertices in the MS endcaps reaches 70% for higher-mass bench-mark models. Because there is no magnetic field in the region in which endcap tracklets are reconstructed, the vertex reconstruction algorithm does not have the same constraints that are present in the barrel. Consequently, the vertex reconstruction in the endcaps is more efficient for signal, but also less robust in rejecting background events. Details are provided in Ref. [30].
VIII. SYSTEMATIC UNCERTAINTIES A. ID vertex reconstruction
A multijet control sample is used to understand possi-ble differences in track and vertex reconstruction efficien-cies between data and simulated samples. The ID vertex reconstruction uncertainty is determined in two steps.
The first step is to determine the difference in recon-struction efficiency for barrel and endcap tracks with impact parameters larger than those allowed by default track reconstruction. The distribution of reconstructed vertex positions from K0
S decays is determined for both the data and simulated multijet samples, and the dis-tributions are normalized such that the same number of K0
S vertices are reconstructed inside the beam pipe. The weighted averages of the data-to-MC ratios of the nor-malized decay position distributions are 0.99 ± 0.03 in the barrel and 1.01 ± 0.05 in the endcaps.
The statistical uncertainties are taken as the system-atic uncertainties on the K0
S reconstruction efficiency. Since two tracks are necessary for reconstructing a K0 S decay, the K0
S reconstruction efficiency is proportional to the square of the track efficiency, from which per-track systematic uncertainties of 2% and 3% in the barrel and endcaps, respectively, are derived.
The second step randomly removes 2% of barrel tracks and 3% of endcap tracks and reruns the ID vertex recon-struction algorithm. The results provide a measure of the systematic uncertainty on ID vertex reconstruction.
The simulated samples contain pileup interactions as recorded with zero-bias triggers for a portion of the data. A reweighting to match the hµi distribution2 in the full
2012 dataset is applied to take into account differences in the instantaneous luminosity between the full 2012 dataset and the sample used for zero-bias overlay. A systematic uncertainty due to pileup is determined by shifting the hµi distribution from MC simulation up and down by the statistical uncertainty.
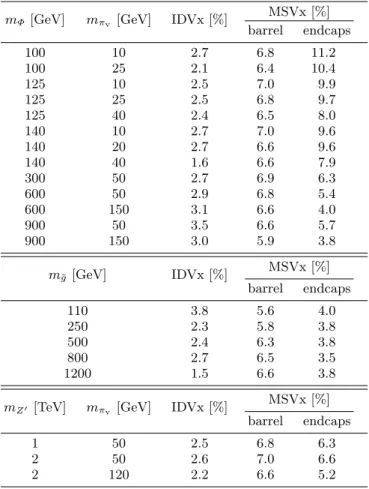
Uncertainties on the jet energy scale (JES) [42] and PDFs are also considered and provide a small contribu-tion to the total systematic uncertainty. Other possible sources of systematic uncertainty, such as initial- or final-state radiation, are found to be negligible. A summary of the total ID vertex reconstruction systematic uncer-tainties for signal MC events is presented in TableVI.
B. MS trigger and vertex reconstruction Jets that punch through the calorimeter and shower in the MS are used to evaluate MS-related systematic
un-2 The quantity µ is a measure of the average number of inelastic
interactions per bunch crossing and hµi, the average value over all proton bunches, gives the average number of expected proton-proton collisions per event.
TABLE VI. Summary of the systematic uncertainties on dis-placed vertex reconstruction efficiencies in the ID and MS.
mΦ [GeV] mπv [GeV] IDVx [%]
MSVx [%] barrel endcaps 100 10 2.7 6.8 11.2 100 25 2.1 6.4 10.4 125 10 2.5 7.0 9.9 125 25 2.5 6.8 9.7 125 40 2.4 6.5 8.0 140 10 2.7 7.0 9.6 140 20 2.7 6.6 9.6 140 40 1.6 6.6 7.9 300 50 2.7 6.9 6.3 600 50 2.9 6.8 5.4 600 150 3.1 6.6 4.0 900 50 3.5 6.6 5.7 900 150 3.0 5.9 3.8 m˜g [GeV] IDVx [%] MSVx [%] barrel endcaps 110 3.8 5.6 4.0 250 2.3 5.8 3.8 500 2.4 6.3 3.8 800 2.7 6.5 3.5 1200 1.5 6.6 3.8
mZ0 [TeV] mπv [GeV] IDVx [%] MSVx [%]
barrel endcaps
1 50 2.5 6.8 6.3
2 50 2.6 7.0 6.6
2 120 2.2 6.6 5.2
certainties due to imperfect modeling in the simulation. Punch-through jets are similar to signal events as they contain low-energy photons as well as charged hadrons in a localized region of the MS. A punch-through jet is selected by requiring the jet to be located in the regions with reduced total interaction length, 0.7 < |η| < 1.0 or 1.5 < |η| < 1.7; have |∆φ(Emiss
T , jet)| < 0.6 in addition to EmissT > 30 GeV; and have at least 250 MDT hits within a cone of ∆R < 0.6 around the jet axis.
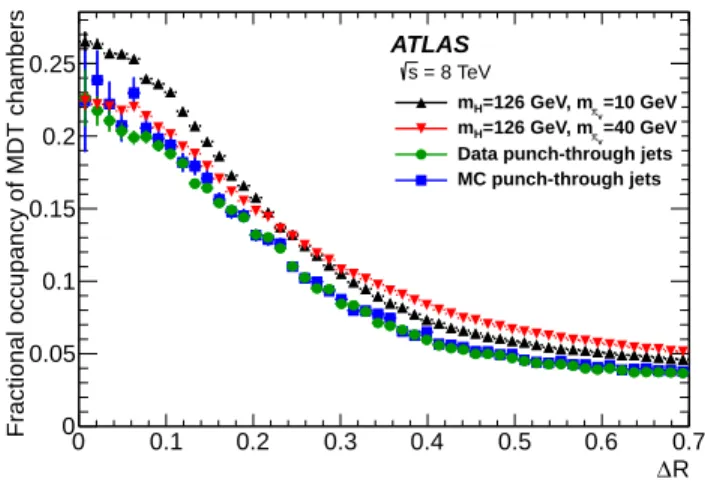
The fractional occupancy of a given chamber is defined as the number of observed MDT hits divided by the to-tal number of MDT tubes. Figure 9 gives the average fractional occupancy of chambers as a function of ∆R between the center of the MDT chamber and either the for the multijet samples or the πv decay position for two scalar boson benchmark models.
The peak occupancy for both MC signal samples and the punch-through jet data and MC samples is about 20 − 25%. The punch-through jet distribution has a sim-ilar shape to that from signal events, and thus punch-through jets are a reasonable sample for studying system-atic uncertainties due to incorrect simulation modeling.
R ∆ 0 0.1 0.2 0.3 0.4 0.5 0.6 0.7 F ra c ti o n a l o c c u p a n c y o f M D T c h a m b e rs 0 0.05 0.1 0.15 0.2 0.25 ATLAS =10 GeV v π =126 GeV, m H m =40 GeV v π =126 GeV, m H m
Data punch-through jets MC punch-through jets
= 8 TeV s
FIG. 9. Average fractional occupancy of chambers as a func-tion of ∆R between the center of the MDT chamber and either the axis of the punch-through jet for the multijet samples or the πv decay position for signal MC samples. Only punch-through jets with at least 250 MDT hits are included.
1. Muon RoI Cluster trigger
In order to determine any differences in muon RoI reconstruction between data and simulation, the num-ber of muon RoIs within the punch-through jet cone (∆R < 0.6) is determined for both the data and sim-ulated samples. The weighted average of the ratio of these plots is found to be 0.91 ± 0.06 in the barrel and 0.99 ± 0.06 in the endcaps. The barrel value differs from unity by more than one standard deviation, so the 9% deviation is taken as the systematic uncertainty. The value in the endcaps is consistent with unity within one standard deviation, so the 6% statistical uncertainty is taken as the systematic uncertainty.
To understand the effects of the JES uncertainty on the isolation requirement, the energy of each jet is increased by its JES uncertainty. The resulting change in trigger efficiency is less than 0.1% for signal MC samples. The systematic uncertainty due to pileup uncertainties is less than 0.3% for every signal MC sample. Uncertainties in the initial-state radiation (ISR) spectrum [46] have a negligible effect on trigger acceptance.
The total systematic uncertainties of the Muon RoI Cluster trigger are 9% in the barrel and 6% in the end-caps, and are dominated by the data–MC simulation comparison of punch-through jets.
2. MS vertex reconstruction
The systematic uncertainty on the MS vertex recon-struction efficiency due to discrepancies between data and simulation is determined using a similar method to the one for determining the systematic uncertainty on ID vertex reconstruction. First, a comparison between
data and MC simulation is made using the distributions of the number of tracklets found within a ∆R < 0.6 cone of a punch-through jet. The weighted averages of the ra-tios are 0.96 ± 0.05 in the barrel and 0.89 ± 0.05 in the endcaps, from which systematic uncertainties for tracklet finding of 5% and 11% are assigned to the barrel and end-caps, respectively. The systematic uncertainty of tracklet reconstruction is propagated to MS vertex reconstruction by randomly removing tracklets with a probability equal to the systematic uncertainty on the tracklet reconstruc-tion efficiency. The change in the efficiency to reconstruct MS vertices gives the systematic uncertainty for each MC signal sample.
To understand the effects of the JES, pileup, PDF, and ISR uncertainties on MS vertex reconstruction, the same procedure used for the Muon RoI Cluster trigger and ID vertex reconstruction is applied. All of the resulting systematic uncertainties associated with these effects are less than 1%. The total systematic uncertainty of re-constructing a vertex is found by adding in quadrature the contributions from all of the above systematic uncer-tainties, and the results are summarized in TableVI. As with the Muon RoI Cluster trigger, the dominant con-tribution to the uncertainty is from the MC accuracy, evaluated using a comparison of punch-through jets in data and MC.
IX. EXPECTED NUMBER OF BACKGROUND
EVENTS A. ID vertex fake rate
Jets with high track multiplicity are a major source of fake ID vertices. The ID vertex fake rate is calculated from jets in events passing single-jet triggers using three control regions.
For the Muon Cluster channel, the control region con-tains events with leading jet pT > 230 GeV. A per-jet fake rate as a function of pTis derived by calculating the probability of finding a good ID vertex in the cone formed by the nonleading jets from the control region. The large pTrequirement on the leading jet ensures minimal signal contamination, and selecting only nonleading jets pro-vides a jet-pTspectrum comparable to the signal region. The per-jet fake rate ranges from 2 × 10⁻⁵ to 3 × 10⁻⁴, with uncertainties of about 20%.
A slightly different procedure is employed for the Jet+Emiss
T channel. Here, two control regions are de-fined, both with Emiss
T < 75 GeV in order to mini-mize signal contamination. The first contains events with a leading jet with 120 GeV < pT < 300 GeV and the second with a leading jet pT > 300 GeV. A fake rate as a function of pTis obtained separately for leading and nonleading jets. Since no nonlead-ing jets associated with background vertices are present in the low-pTcontrol region, a scale factor defined as (nonleading-jet fake rate)/(leading-jet fake rate) is
com-puted in the high-pTcontrol region. This scale fac-tor is multiplied by the leading-jet fake rate in the low-pTcontrol region, which gives an estimate of the nonleading-jet fake rate for the low-pTcontrol region. The per-jet fake rate from nonleading jets ranges from 6 × 10⁻⁶ to 3 × 10⁻⁵, while for leading jets the range is from 4 × 10⁻⁶ to 2 × 10⁻⁵, again with uncertainties of about 20%.
B. MS vertex fake rate
Events with a single MS vertex that pass either the Muon RoI Cluster trigger or a set of minimum-bias trig-gers are used to determine the MS vertex fake rate. These events are dominated by fake vertices that do not origi-nate from displaced decays. Signal events could contam-inate this control region, which would result in overes-timation of the probabilities and resulting background rates.
The probability of finding a fake vertex in events not selected by the Muon RoI Cluster trigger, Pvx
noMStr, is
de-termined from data selected by minimum-bias triggers. This sample is used to determine the probability that, in a random event, an MS vertex not associated with a clus-ter of muon RoIs is reconstructed. Such a vertex could be caused by a jet that passes the isolation criteria and showers in the MS, detector noise, cavern background, or cosmic rays. The fake rate is calculated as the num-ber of good MS vertices divided by the total numnum-ber of events. No good MS vertices are observed. Therefore zero is taken as the central value, and an upper system-atic uncertainty of three events is computed as the 95% confidence level (CL) upper bound corresponding to zero observed events (0+3−0). Dividing this by the number of events in the sample gives PnoMStrvx equal to (0+5−0) × 10−7. The probability of finding a vertex given a muon RoI cluster is needed to find the expected background from events with two muon RoI clusters. Two probabilities are calculated: one for finding an MS vertex given a muon RoI cluster in the barrel, Pvx
Bcl, and another for finding an MS vertex given a muon RoI cluster in the endcaps, Pvx
Ecl. These are calculated by counting the number of events with one MS vertex and one muon RoI cluster and divid-ing by the number of events with one muon RoI cluster. The resulting probabilities are shown in TableVII.
C. Predicted number of background events
The number of background events is estimated for each of the topologies and triggers listed in TableI.
For the Muon Cluster channel, the number of events with a combination of an MS and ID vertex is estimated by multiplying the number of events that pass the Muon RoI Cluster trigger and have an MS vertex by the prob-ability of finding a fake ID vertex in the event. For each event, the probability of a fake ID vertex being found is
TABLE VII. The probabilities needed to compute the back-ground from events containing fake MS vertices. Pvx
Bcl and PEclvx are the probabilities of finding one MS vertex in events passing the Muon RoI Cluster trigger that have one muon RoI cluster in the barrel or endcaps, respectively. The probability of finding an MS vertex not matched to a cluster of muon RoIs is given byPvx noMStr. Quantity Value Pvx noMStr (0+ 5− 0) × 10−7 PBclvx (1.289 ± 0.006) × 10−2 Pvx Ecl (8.00 ± 0.03) × 10−2
computed by multiplying the number of jets at a given pTby the ID vertex per-jet fake rate for jets of that pT. The resulting expected number of events is 2.0 ± 0.4.
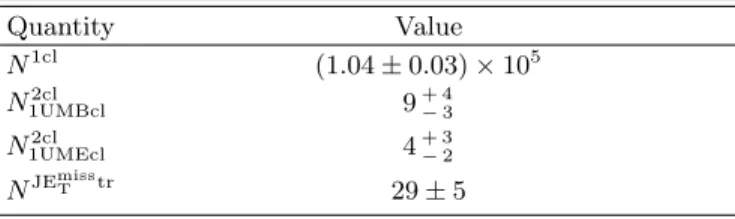
The expected number of background events with two MS vertices is calculated by considering two contribu-tions. The events selected by the Muon RoI Cluster trigger and containing only one MS vertex are separated into those containing two muon RoI clusters, where only one cluster is matched to the reconstructed MS vertex and the other is unmatched in the barrel or endcaps
(N1UMBcl2cl , N1UMEcl2cl ), and those containing only one
clus-ter of muon RoIs (N1cl). These numbers of events are listed in TableVIII. The probabilities of finding an MS vertex whether or not the vertex is matched to a muon RoI cluster (Pvx
Bcl, PEclvx, or PnoMStrvx ) are then used to cal-culate the expected number of fake vertices for each case, respectively. These values yield an expected number of background 2MSVx events of 0.4+0.3−0.2.
TABLE VIII. The numbers of events necessary to calculate the background prediction. N1cl, N1UMBcl2cl , and N1UMEcl2cl are the numbers of events with only one MS vertex con-taining either one muon RoI cluster (1cl) or two muon RoI custers (2cl) with one matched to the MS vertex and a sec-ond unmatched and located in the barrel/endcaps (1UM-Bcl/1UMEcl). NJEmissT tr is the number of events that pass the Jet+ETmisstrigger and contain one MS vertex.
Quantity Value N1cl (1.04 ± 0.03) × 105 N2cl 1UMBcl 9+ 4− 3 N1UMEcl2cl 4+ 3− 2 NJEmissT tr 29 ± 5
For the Jet+Emiss
T channel, the expected backgrounds are calculated using slightly different inputs. To esti-mate the number of background 2IDVx events, the per-jet ID vertex fake rate is applied to events that pass the Jet+Emiss
T trigger and contain at least two jets. The expected number of background events for this topol-ogy is (1.8 ± 0.4) × 10−4. The number of background IDVx+MSVx events is estimated by selecting events with an MS vertex, and then calculating the expected number
of events with a fake ID vertex given the jets present in each event. The expected number of events obtained is (5.5 ± 1.4) × 10−4.
To estimate the number of background 2MSVx events, the number of events passing event selection with an MS vertex, NJEmiss
T tr, is multiplied by the probability of find-ing a fake MS vertex in a random event, Pvx
noMStr. The
prediction for this topology is (0.0+1.4−0.0) × 10−5 events. Table IX summarizes the number of expected events from background sources. The uncertainties quoted in the table are statistical uncertainties; systematic uncer-tainties are negligible.
TABLE IX. Number of events predicted for different final-state topologies.
Trigger Topology Predicted
Jet+Emiss T 2IDVx (1.8 ± 0.4) × 10−4 Jet+Emiss T IDVx+MSVx (5.5 ± 1.4) × 10−4 Jet+Emiss T 2MSVx (0.0+ 1.4− 0.0) × 10−5
Muon RoI Cluster IDVx+MSVx 2.0 ± 0.4
Muon RoI Cluster 2MSVx 0.4+ 0.3− 0.2
X. RESULTS
A. Expected number of signal events
The number of expected signal events is extrapolated from the generated lifetime to the range of proper life-times (cτ ) between 0 and 100 m using 2 million MC sim-ulated events per benchmark sample. The overall prob-ability of each event satisfying the selection criteria is evaluated from the efficiencies of reconstructing an event that passes the Muon RoI Cluster or Jet+Emiss
T trigger and the efficiencies of reconstructing an ID or MS vertex from an LLP decay. Other important criteria, such as the timing acceptance window for the barrel trigger, are also taken into account. Table X shows the expected num-ber of signal events for Higgs boson decays, at a proper lifetime of 2 m.
The Z0extrapolation procedure has an additional com-plication due to the presence of many πvdecays per event. This leads to a maximum discrepancy of 15% between the reconstructed and predicted trigger efficiencies calculated from the simulated MC samples. This 15% discrepancy is applied in the extrapolation process as a systematic uncertainty on the trigger efficiency.
B. Limits
After applying all selection criteria, two events are found in the Muon Cluster channel 2MSVx topology. No events are observed in the Muon Cluster channel IDVx+MSVx topology. In the Jet+Emiss
T channel, zero events are observed in each of the three topologies: 2IDVx, IDVx+MSV, and 2MSVx. The numbers of
TABLE X. Expected number of signal events at 19.5−1fb for the scalar boson benchmark model withmH = 125 GeV and BR(H → πvπv) = 100%, at aπvproper lifetime ofcτ = 2 m. The SM Higgs boson cross-section for gluon-fusion produc-tion, σSM = 18.97 pb [47], is used to compute numbers of signal events. Also shown are the numbers of expected back-ground and observed events. Uncertainties on expected signal events are statistical only.
Topology mπv
[GeV]
Expected events Observed
events Signal Background IDVx+MSVx 10 1.9 ± 1.4 2.0 ±0.4 0 25 62 ± 8 40 41 ± 6 2 MSVx 10 234 ± 15 0.4+ 0.3− 0.2 2 25 690 ± 26 40 313 ± 18
events found are compatible with the predicted numbers of background events. The CLs method [48] is used to derive upper limits on the production cross-section times branching ratio (σ × BR). For the scalar boson bench-mark samples, BR represents the branching ratio for Φ → πvπv, while for the Z0benchmark samples BR rep-resents the branching ratio for Z0 → qvq¯v. The branch-ing ratio for πv decay to fermion pairs is assumed to be 100%. For the Stealth SUSY benchmarks, BR represents the branching ratio for ˜g → ˜Sg. The branching ratios for ˜S → S ˜G and S → gg are both assumed to be 100% in the Stealth SUSY model considered in this analysis. For the Higgs boson benchmarks, upper limits are set on σ × BR/σSM, where σSMis the SM Higgs production
cross-section, 18.97 pb [47].
A profile likelihood function [49] is used as the test statistic and a frequentist calculator is used to generate toy data. The likelihood includes a Poisson probabil-ity term describing the total number of observed events. Systematic uncertainties are incorporated as nuisance pa-rameters through their effect on the mean of the Poisson functions and through convolution with their assumed Gaussian distributions. The number of expected events in signal MC samples, together with the expected back-ground, the observed collision events and all the system-atic uncertainties are provided as input for computing the CLs value, which represents the probability for the given observation to be compatible with the signal-plus-background hypothesis.
Observed 95% CL upper limits are shown in Fig. 10. Because the SM production cross-section is known for the mH = 125 GeV benchmark samples, excluded life-time ranges are presented. TableXIshows the excluded regions for branching ratios of 30%, 15%, 5%, and 1% for the Higgs boson decaying to long-lived particles.
) [m] τ c proper lifetime ( v π 1 − 10 1 10 102 SM σ BR / × σ 9 5 % C L U p p e r L im it o n 2 − 10 1 − 10 1 ATLAS -1 = 8 TeV, 19.5 fb s = 125 GeV H m =10 GeV V π m =25 GeV V π m =40 GeV V π m BR 15% BR 5% BR 1% ) [m] τ proper lifetime (c v π 1 − 10 1 10 102 BR [pb] × σ 9 5 % C L U p p e r L im it o n 2 − 10 1 − 10 1 10 2 10 ATLAS -1 = 8 TeV, 19.5 fb s = 100 GeV Φ m =10 GeV V π m =25 GeV V π m (a) (b) ) [m] τ c proper lifetime ( v π 1 − 10 1 10 102 BR [pb] × σ 9 5 % C L U p p e r L im it o n 2 − 10 1 − 10 1 10 2 10 ATLAS -1 = 8 TeV, 19.5 fb s = 140 GeV Φ m =10 GeV V π m =20 GeV V π m =40 GeV V π m ) [m] τ c proper lifetime ( v π 1 − 10 1 10 102 BR [pb] × σ 9 5 % C L U p p e r L im it o n 2 − 10 1 − 10 1 10 2 10 ATLAS -1 = 8 TeV, 19.5 fb s =50 GeV V π =300 GeV, m Φ m =50 GeV V π =600 GeV, m Φ m =150 GeV V π =600 GeV, m Φ m =50 GeV V π =900 GeV, m Φ m =150 GeV V π =900 GeV, m Φ m (c) (d) ) [m] τ proper lifetime (c v π -1 10 1 10 102 BR [pb] × σ 95% CL Upper Limit on 10-2 -1 10 1 10 2 10 ATLAS -1 = 8 TeV, 20.3 fb s =50 GeV V π =1 TeV, m Z' m =50 GeV V π =2 TeV, m Z' m =120 GeV V π =2 TeV, m Z' m ) [m] τ c
Singlino proper lifetime (
1 − 10 1 10 102 BR [pb] × σ 9 5 % C L U p p e r L im it o n 2 − 10 1 − 10 1 10 2 10 ATLAS -1 = 8 TeV, 19.5 fb s =110 GeV g ~ m =250 GeV g ~ m =500 GeV g ~ m =800 GeV g ~ m =1200 GeV g ~ m (e) (f)
FIG. 10. (a) Observed 95% CL limits on σ × BR/σSM for the scalar boson samples withmH = 125 GeV. Three horizontal lines mark branching fractions for the Higgs boson decaying to πv pairs at 15%, 5%, and 1%. Observed 95% CL limits on σ × BR for the scalar boson samples with (b) mΦ = 100 GeV, (c) mΦ = 140 GeV, and (d)mΦ = 300 GeV, 600 GeV, and 900 GeV. Observed 95% CL limits onσ × BR for the (e) Z0samples and (f) Stealth SUSY samples.
In the Muon Cluster channel, the 2MSVx topology pro-vides the dominant contribution to the limits. In the Jet+Emiss
T channel, the 2IDVx topology becomes impor-tant for probing proper lifetimes below 1 m, as can be clearly seen in Fig.10(e) where the limit extends to much lower proper lifetimes than in the models considered in the Muon Cluster channel.
TABLE XI. Ranges ofπv proper decay lengths excluded at 95% CL assuming a 30%, 15%, 5%, or 1% BR for mH = 125 GeV. mπv Excludedcτ range [m] [GeV] 1% BR 5% BR 15% BR 30 % BR 10 no limit 0.24−4.2 0.16−8.1 0.12−11.8 25 1.10−5.35 0.43−18.1 0.28−32.8 0.22−46.7 40 2.82−7.45 1.04−30.4 0.68−55.5 0.52−79.2 XI. SUMMARY
Results of a search for the decay of long-lived neutral particles to hadronic jets using proton–proton collisions at √s = 8 TeV recorded at the LHC with the ATLAS detector are presented. Event selection uses two trig-gers: the Muon RoI Cluster trigger (19.5 fb−1) and a Jet+Emiss
T trigger (20.3 fb−1). A total of five different fi-nal states with two displaced vertices are investigated, employing techniques for reconstructing highly displaced decays in the inner tracking detector and muon spectrom-eter.
No significant excess of events above the background expectations is observed and exclusion limits as a func-tion of the proper lifetime of long-lived particles from Higgs boson and scalar boson decays are reported. This paper also presents the first upper limits as a function of proper lifetime for Hidden Valley Z0and Stealth SUSY scenarios. For the SM Higgs boson decaying to long-lived particles, a significant range of πv proper lifetimes is
ex-cluded for branching ratios of 5% or less.
XII. ACKNOWLEDGMENTS
We thank CERN for the very successful operation of the LHC, as well as the support staff from our institutions without whom ATLAS could not be operated efficiently. We acknowledge the support of ANPCyT, Argentina; YerPhI, Armenia; ARC, Australia; BMWFW and FWF, Austria; ANAS, Azerbaijan; SSTC, Belarus; CNPq and FAPESP, Brazil; NSERC, NRC and CFI, Canada; CERN; CONICYT, Chile; CAS, MOST and NSFC, China; COLCIENCIAS, Colombia; MSMT CR, MPO CR and VSC CR, Czech Republic; DNRF, DNSRC and Lundbeck Foundation, Denmark; EPLANET, ERC and NSRF, European Union; IN2P3-CNRS, CEA-DSM/IRFU, France; GNSF, Georgia; BMBF, DFG, HGF, MPG and AvH Foundation, Germany; GSRT and NSRF, Greece; RGC, Hong Kong SAR, China; ISF, MINERVA, GIF, I-CORE and Benoziyo Center, Israel; INFN, Italy; MEXT and JSPS, Japan; CNRST, Mo-rocco; FOM and NWO, Netherlands; BRF and RCN, Norway; MNiSW and NCN, Poland; GRICES and FCT, Portugal; MNE/IFA, Romania; MES of Russia and NRC KI, Russian Federation; JINR; MSTD, Serbia; MSSR, Slovakia; ARRS and MIZˇS, Slovenia; DST/NRF, South Africa; MINECO, Spain; SRC and Wallenberg Foun-dation, Sweden; SER, SNSF and Cantons of Bern and Geneva, Switzerland; NSC, Taiwan; TAEK, Turkey; STFC, the Royal Society and Leverhulme Trust, United Kingdom; DOE and NSF, United States of America.
The crucial computing support from all WLCG part-ners is acknowledged gratefully, in particular from CERN and the ATLAS Tier-1 facilities at TRIUMF (Canada), NDGF (Denmark, Norway, Sweden), CC-IN2P3 (France), KIT/GridKA (Germany), INFN-CNAF (Italy), NL-T1 (Netherlands), PIC (Spain), ASGC (Tai-wan), RAL (UK) and BNL (USA) and in the Tier-2 fa-cilities worldwide.
[1] S. Dimopoulos, M. Dine, S. Raby, and S. D. Thomas, Phys. Rev. Lett. 76, 3494 (1996),
arXiv:hep-ph/9601367.
[2] R. Barbier et al.,Phys. Rept. 420, 1 (2005), arXiv:hep-ph/0406039.
[3] D. Tucker-Smith and N. Weiner,Phys. Rev. D 64, 043502 (2001),arXiv:hep-ph/0101138.
[4] M. J. Strassler and K. M. Zurek,Phys. Lett. B 651, 374 (2007),arXiv:hep-ph/0604261.
[5] M. J. Strassler and K. M. Zurek,Phys. Lett. B 661, 263 (2008),arXiv:hep-ph/0605193.
[6] M. J. Strassler,arXiv:hep-ph/0607160.
[7] J. Fan, M. Reece, and J. T. Ruderman,J. High Energy Phys. 11 (2011) 012,arXiv:1105.5135.
[8] J. Fan, M. Reece, and J. T. Ruderman,J. High Energy
Phys. 07 (2012) 196,arXiv:1201.4875. [9] G. Branco et al.,Phys. Rept. 516, 1 (2012),
arXiv:1106.0034.
[10] Y. Cui and B. Shuve,J. High Energy Phys. 02 (2015) 049,arXiv:1409.6729.
[11] B. Patt and F. Wilczek,arXiv:hep-ph/0605188. [12] ATLAS Collaboration, ATLAS-CONF-2014-009, 2014,
http://cdsweb.cern.ch/record/1670012.
[13] ATLAS Collaboration,Phys. Lett. B 740, 222 (2015), arXiv:1409.3122.
[14] ATLAS Collaboration,Phys. Rev. D 91, 012006 (2015), arXiv:1408.5191.
[15] CMS Collaboration, submitted to Eur. Phys. J. C (2014),arXiv:1412.8662.
http://cdsweb.cern.ch/record/1670531. [17] D. Curtin et al.,Phys. Rev. D 90, 075004 (2014),
arXiv:1312.4992.
[18] CDF Collaboration, T. Aaltonen et al.,Phys. Rev. D 85, 012007 (2012),arXiv:1109.3136.
[19] D0 Collaboration, V. Abazov et al.,Phys. Rev. Lett. 103, 071801 (2009),arXiv:0906.1787.
[20] LHCb Collaboration, R. Aaij et al., submitted to Eur. Phys. J. C (2014),arXiv:1412.3021.
[21] ATLAS Collaboration, In preparation (2015). [22] CMS Collaboration,Phys. Rev. D 91, 012007 (2015),
arXiv:1411.6530.
[23] ATLAS Collaboration,Phys. Rev. Lett. 108, 251801 (2012),arXiv:1203.1303.
[24] ATLAS Collaboration,Phys. Lett. B 743, 15 (2015), arXiv:1501.04020.
[25] ATLAS Collaboration,JINST 3, S08003 (2008). [26] ATLAS Collaboration,Eur. Phys. J. C 72, 1849 (2012),
arXiv:1110.1530.
[27] ATLAS Collaboration,JINST 8, P07015 (2013), arXiv:1305.2284.
[28] ATLAS Collaboration,Eur. Phys. J. C 72, 1844 (2012), arXiv:1108.5602.
[29] ATLAS Collaboration, ATLAS-CONF-2013-082, 2013, http://cdsweb.cern.ch/record/1570993.
[30] ATLAS Collaboration,JINST 9, P02001 (2014), arXiv:1311.7070.
[31] ATLAS Collaboration,Eur. Phys. J. C 73, 2518 (2013), arXiv:1302.4393.
[32] T. Sjostrand, S. Mrenna, and P. Z. Skands,Comput. Phys. Commun. 178, 852 (2008),arXiv:0710.3820. [33] M. J. Strassler,arXiv:0806.2385.
[34] J. Alwall, M. Herquet, F. Maltoni, O. Mattelaer, and T. Stelzer,J. High Energy Phys. 06 (2011) 128, arXiv:1106.0522.
[35] A. Martin, W. Stirling, R. Thorne, and G. Watt,Eur. Phys. J. C 63, 189 (2009),arXiv:0901.0002.
[36] J. Pumplin et al.,J. High Energy Phys. 07 (2002) 012, arXiv:hep-ph/0201195.
[37] S. Agostinelli et al.,Nucl. Instrum. Meth. A 506, 250 (2003).
[38] ATLAS Collaboration,Eur. Phys. J. C 70, 823 (2010), arXiv:1005.4568.
[39] ATLAS Collaboration, PoS ICHEP2010, 037 (2010). [40] H.-L. Lai et al.,Phys. Rev. D 82, 074024 (2010),
arXiv:1007.2241.
[41] M. Cacciari, G. P. Salam, and G. Soyez,J. High Energy Phys. 04 (2008) 063,arXiv:0802.1189.
[42] ATLAS Collaboration,Eur. Phys. J. C 75, 17 (2015), arXiv:1406.0076.
[43] ATLAS Collaboration, ATLAS-CONF-2010-069, 2010, http://cdsweb.cern.ch/record/1281344/.
[44] ATLAS Collaboration,JINST 7, P01013 (2012), arXiv:1110.6191.
[45] ATLAS Collaboration,JINST 8, P07004 (2013), arXiv:1303.0223.
[46] D. de Florian, G. Ferrera, M. Grazzini, and
D. Tommasini,J. High Energy Phys. 11 (2011) 064, arXiv:1109.2109.
[47] LHC Higgs Cross Section Working Group, S. Heinemeyer et al.,arXiv:1307.1347. [48] A. L. Read,J. Phys. G 28, 2693 (2002).
[49] G. Cowan, K. Cranmer, E. Gross, and O. Vitells,Eur. Phys. J. C 71, 1554 (2011),arXiv:1007.1727.