Available online at www.sciencedirect.com
Talanta 74 (2008) 1281–1286
Impact of malolactic fermentation on low molecular
weight phenolic compounds
M.J. Cabrita, M. Torres, V. Palma, E. Alves, R. Pat˜ao, A.M. Costa Freitas
∗Laborat´orio de Enologia, Instituto de Ciˆencias Agr´arias Mediterrˆanicas, Universidade de ´Evora, Ap 94 7002-554 ´Evora, Portugal
Received 19 April 2007; received in revised form 23 August 2007; accepted 30 August 2007 Available online 8 September 2007
Abstract
A reversed phase liquid chromatography-DAD method is proposed for analysis of major non-flavonoid phenolic compounds in wines. The method employed a mixture of acetic acid, water and methanol as eluents and was used to evaluate the impact of malolactic fermentation in low molecular phenolic compounds.
The wines analyzed underwent different treatments, like the addition of a pectolytic enzyme or lysozyme, and the way malolactic fermentation was carried out—spontaneously or with the inoculation of two different commercial lactic bacteria.
The main result observed was the disappearance of hydroxycinnamoyltartaric acids and the increase of resultant free forms, regardless the way malolactic fermentation was carried out.
© 2007 Elsevier B.V. All rights reserved.
Keywords: HPLC-DAD; Malolactic fermentation; Non-flavonoid compounds
1. Introduction
The importance of phenolic compounds in wine is very well established due to their influence in colour, flavour and astringency[1,2]. Non-flavonoid compounds include benzoic, cinnamic acids and aldehydes, usually named low molecular weight phenols. Although being present in small amounts in wines they play an important role in sensory quality and may contribute, through an additive effect, to bitterness and harsh-ness, specially cinnamic acids[3].
There are two main groups of phenolic acids: hydroxyben-zoic acids and hydroxycinnamic acids. Hydroxybenhydroxyben-zoic acids (C6–C1) have a general structure derived from benzoic acid and they differ according to hydroxylation and methoxylation of the aromatic ring.
Hydroxycinnamic acids (C6–C3) derive from cinnamic acid. Both groups are commonly present in grapes and wines, some-times in the form of tartaric acid esters[4].
Hydroxycinnamic acids such as p-coumaric, ferulic or caf-feic acid are also important, as they can be decarboxylated by
∗Corresponding author. Tel.: +351 266 760 934/800; fax: +351 266 760 828. E-mail address:[email protected](A.M. Costa Freitas).
a number of microbiological species, into ethyl-phenols con-sidered as off-flavours [5]. Cinnamic acids are also involved in co-pigmentation process with anthocyanins, which affect the colour of red wines[6].
They are usually esterified with tartaric acid as hydrox-ycinamic tartaric esther known as caftaric acid, fertaric acid and coutaric acid. The yeast Dekkera bruxellensis is mainly responsible for p-coumaric and ferulic acid decarboxylation and reduction to 4-ethylphenol and 4-ethylguaiacol, although other microorganisms, like lactic acid bacteria, also appear to be able to undertake this pathway. The capacity of lactic acid bacteria to produce volatile phenols from ferulic acid was observed to be much lower than its capacity to produce volatile phenols from p-coumaric acid[7]. Recently 4-ethylcathecol was found in wine, this compound is expected to result from the decarboxylation and reduction of caffeic acid (data not published) Sinapic acid, that exists in small amounts in wines, can lead to 4-ethyl syringol but this compound is not considered to be sensorially relevant
[8].
Malolactic fermentation (MLF), the enzymatic decarboxy-lation of l-malic to l-lactic acid and CO2, is an important secondary fermentation carried out by lactic acid bacteria (LAB) during the vinification of red wines. In addition to the deacid-ification, the MLf is considered to contribute to complexity of 0039-9140/$ – see front matter © 2007 Elsevier B.V. All rights reserved.
Table 1
Parameters for the calibration of low molecular weight phenolic compounds
Compound RT± S.D. (min) λ (nm) Equation r2 Linear range (mg/L)
Gallic acid 5.95± 0.13 280 y = 57.573x + 4.55 0.9998 5.5–93.5 Protocatechuic acid 11.53± 0.23 254 y = 60.156x + 1.20 0.9976 0.5–10 Protocatechuic aldehyde 16.64± 0.29 280 y = 109.97x + 19.76 0.9886 0.5–10 Vanillic acid 26.69± 0.38 254 y = 55.629x + 6.69 0.9968 0.5–10 Caffeic acid 28.09± 0.50 320 y = 124.69x− 67.94 0.9977 5–105 Syringic acid 32.33± 0.34 280 y = 64.62x− 23.64 0.9908 4.9–24.9 p-Coumaric acid 39.23± 0.59 320 y = 144.67x− 42.31 0.9975 5–105 Ferulic acid 45.65± 0.64 320 y = 97.925 + 29.98 0.9979 0.5–10
RT± S.D.: retention time ± estimated standard deviation (n = 3); λ (nm): quantification wavelength; r2: determination coefficient. the flavour and to confer a degree of microbiological
stabil-ity to the wine. Aiming to improve also organoleptic properties such as colour stability and smoothness, winemakers have intro-duced different ways to perform this fermentation including the addition of commercial lactic bacteria or the use of oak barrels. Spontaneous MLF commonly occurs after alcoholic fermenta-tion when wine condifermenta-tions are favourable for the growth of lactic acid bacteria, however spontaneous MLF is unpredictable, hence the importance of using commercial starters.
Regarding low molecular weight phenolic compounds it is known that some phenolic acids can inhibit the growth of lactic acid bacteria [9] while others can stimulate malolactic fermentation carried out by Oenococus oeni [10–12]. During this process hydroxycinnamic acids and their derivatives are the main compounds modified. The decrease in the concentration of trans-caftaric and trans-p-coutaric acids until disappearance, along with an increase in the corresponding free forms, trans-caffeic and trans-p-coumaric acids could be linked to lactic acid bacteria metabolism[13].
Various different chromatographic methods have been employed for the separation of low molecular weight phe-nolic compounds in wines. Wine sample analysis can be performed by direct injection[14]or include a sample prepara-tion step like liquid–liquid[13,15–17]or solid phase extraction
[18–21]. A new solid supported liquid–liquid extraction using diatomaceous earth has been recently proposed, being an environmentally friendly low-cost sample preparation method which proved to be reproducible and yielding high recoveries
[22].
For separation almost every methods use a reversed phase C18 column with a binary solvent system, a combination of acetic[23,24]or formic acid[15,17]with a dilute polar organic solvent as acetonitrile[23,24]or methanol [15,17,21]. Detec-tion is usually achieved using UV–vis or DAD detectors, and occasionally using mass detection methods[25]that lead to a more reliable compound identification. Very rarely fluorescence detection is used[26].
Analysis times are usually long, reaching 100 min or more, thus limiting the number of analyses that can be carried out in a given period. We propose a chromatographic method that in 46 min provides good separartion of the 11 compounds being studiedensuring high resolution (R > 1, 5 for almost compounds studied). When applied to red wine samples obtained before and after malolactic fermentation it has allowed the understanding
of the effect of malolactic fermentation on low molecular weight phenolic compounds.
2. Experimental
2.1. Samples
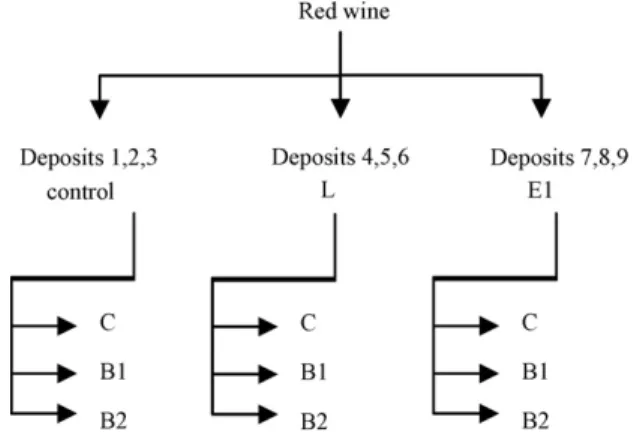
Red grapes of Vitis vinifera L.,c.v. Trincadeira were picked up during 2004 harvest at commercial maturity. Three sets of microvinifications, with three replications, were done according to the scheme presented inFig. 1. After crushing and destem-ming, grapes and musts were placed in stainless steel containers of 80 L capacity occupying only 50 L, treated with sulfur diox-ide (150 mg/L SO2), inoculated with active dry yeast (Fermol A3B, AEB, Brescia, Italy) and nutrients Fermoplus Ecorcell (AEB, Brescia, Italy) according to manufacturer’s instructions. The first set (D1, D2 and D3) suffered no other treatment, to the second set (D4, D5 and D6) lysozyme (lysocid) was added and to the third set (D6, D7 and D8) a pectolitic enzyme (Endozym Rouge) was added. The fermenting musts were punched down twice a day, and were pressed after 7 days of pomace contact, when specific gravity fell under 1000. Both press and free run wines were assembled, and at this point, each vinification tank was split in three to allow malolactic fermentation to undergo spontaneously (control, no inoculation of lactic bacteria) or car-ried out by two different commercial preparations of lactic acid bacteria, Biolact Acclimat´ee (BL1) and Biolact Acclimat´ee 4R (BL2). All enological products were from AEB (Brescia, Italy)
Fig. 1. Vinification scheme—C: control; L: lysocid; E: E. Rouge; B1: biolact acclimat´ee; B2: biolact acclimat´ee 4R.
and were added as recommended by suppliers. We obtained a total of 27 wines.
2.2. Reagents and standards
The water employed was previously purified in a Mili-Q sys-tem (Millipore, Bedford,MA). HPLC grade methanol was from MercK (Darmstadt, Germany). Phenolic compounds: gallic acid, gentisic acid, protocatechuic acid, protocatechuic alde-hyde, (+)-catechin, syringic acid, vanillic acid and ferulic acid were supplied by extrasynthese (Genay, France). Caffeic acid and p-coumaric acid were from Sigma–Aldrich (St. Louis, MO). 2.3. Phenolic compound’s extraction
A liquid–liquid extraction was performed: 5 mL of wine with pH adjusted to 2 were extracted twice with 5 mL of diethyl ether for ten minutes. The organic phase was dried over Na2SO4, the solvent was evaporated under nitrogen, the dry residue obtained was dissolved in methanol–water (1:1, v/v) and fil-tered through a 0.45m Nylaflo membrane filter (Gelman) before being injected into the chromatograph. All samples were extracted in duplicate and results are expressed as the mean value.
A recovery study on the liquid–liquid extraction was per-formed using a spiked wine sample. In order to provide information that allows us a better discussion on the results obtained. Recovery percentages found were—gallic acid: 60%; protocatechuic acid: 45%; protocatechuic aldehyde: 37%; vanil-lic acid: 33%; caffeic acid: 36%; syringic acid: 54%; p-coumaric acid: 37%; ferulic acid: 33%.
Malovan´a et al. [16] evaluate SPE and LLE for the anal-ysis of several wine phenolic compounds, and the list of the compounds studied now is very similar to that studied before. Ethyl acetate and diethyl ether were reportedly used to extract the wine samples and, although the results obtained with both solvents were very similar, diethyl ether yields were slightly better.
2.4. Instrumentation and conditions
Twenty microlitres of each extract were separated on a Superpher® 100, C18 (5m packing, 250 mm × 4.6 mm i.d.) (Merck, Germany) column using a Hewllet Packard 1050 equip-ment with a Hewllet Packard Diode Array 1100 detector.
Flow rate was 1 mL/min. The mobile phase was—solvent A: water:acetic acid (98:2, v/v), solvent B: water:methanol:acetic acid (68:30:2, v/v), and solvent C: methanol for column wash at the end of each day. A gradient program was adopted as fol-lows for solvent A: from 95% to 70% (12 min); from 70% to 45% (15 min); from 45% to 23% (6 min); isocratic for 9 min; from 23% to 5% (5 min); from 5% to 0% (3 min); isocratic for 5 min, and a post-run of 5 min for re-equilibration of the initial gradient.
The detection wavelengths were 280, 254, and 320 nm and the UV–vis spectra (scanning from 190 to 400 nm) were recorded for all peaks.
Phenolic compounds were identified by comparison of elu-tion order, retenelu-tion times and the spectral UV–vis with those of standards and quantified by the external standard method (Table 1).
Caftaric, coutaric and fertaric acids were isolated from wine according to[27]to help identification by comparison with spec-tral UV–vis, and were quantified as their corresponding free forms.
2.5. Malic and lactic acid determination
Malolactic fermentation was followed through the determi-nation of malic and lactic acid in deposits 1, 2 and 3, according to the methodology previously reported [28] and using the same equipment with a LichroCART® 250-4 Superspher® RP 18 endcapped (5m packing, 250 mm × 4.6 mm i.d.) (Merck, Germany) column. The mobile phase was fosforic acid (5× 10⁻³M), flow 0.7 mL/min and detection was done at 210 nm. Sample preparation includes an extraction in a Sep-Pak® cartridge C18 300 g (Waters, Milford; MA, USA) of wine diluted 1:2 with fosforic acid 1N, and recovered with fosforic acid 5× 10⁻³M. Calibration curves were established for the two acids from 4 to 0.1 g/L, with correlation coefficients of 0.999 and 0.998 for malic and lactic acids.
2.6. Statistical analysis
Differences in phenolic compounds present in wine before and after FML realized under different conditions (C, B1 and B2) were assessed by one-way analysis of variance (ANOVA); mean comparisons were performed using Fischer’s multiple comparison test at the 95% confidence level. Analyses were accomplished using NCSS 6.0 software.
3. Results and discussion
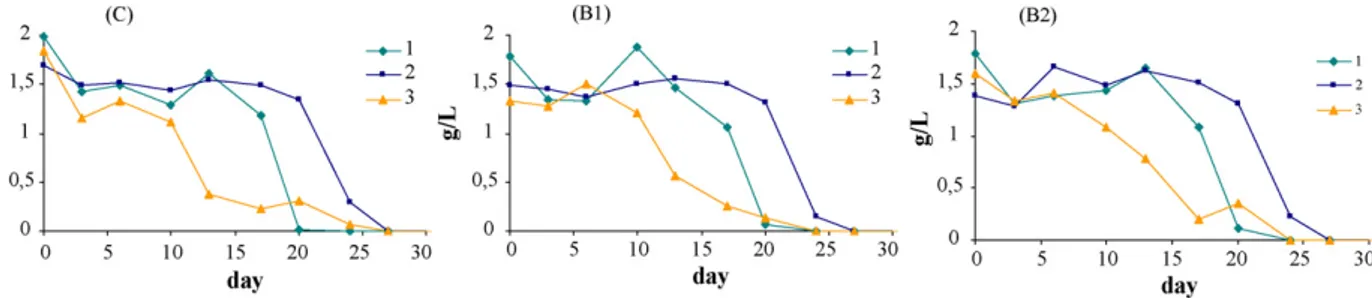
Malic acid consumption in deposits 1, 2 and 3 (control) is shown in Fig. 2. The graphics show that during the sampling period the malic acid content drops below the method’s detec-tion limit, regardless the inoculadetec-tion or not (control) of lactic bacteria (B1 and B2). The disappearance of malic acid seems to be more related to each wine characteristics (from deposits 1, 2 or 3) then with the addition or not of a lactic bacteria. Regardless the addition or not of lactic bacterias, the content of malic acid begins to disappear first in wine from deposit 3 than in wine from deposit 1 and last in wines from deposit 2.
Fig. 3 illustrates the chromatogram obtained from a red wine sample before malolactic fermentation andFig. 4presents the chromatogram of a sample after malolactic fermen-tation.
Tables 2–4show the content of phenolic compounds in wine samples collected before and after malolactic fermentation, from the control set, the set treated with lysozyme and the set treated with pectolytic enzyme. If results from deposit 2 are ignored, most marked changes observed in all other samples before and after malolactic fermentation involve the tartaric esters of
Fig. 2. Acid malic disappearance during malolactic fermentation in control wine from deposits 1, 2 and 3.
Fig. 3. Chromatogram obtained from a sample of red wine before malolactic fermentation—1: gallic acid, 2: protocatechuic acid, 3: protocatechuic aldehyde, 4: vanillic acid, 5: caffeic acid, 6: syringic acid, 7: p-coumaric acid, 8: ferulic acid. A: caftaric acid, B: coutaric acid, C: fertaric acid.
Fig. 4. Chromatogram obtained from a sample of red wine after malolactic fermentation—1: gallic acid, 2: protocatechuic acid, 3: protocatechuic aldehyde, 4: vanillic acid, 5: caffeic acid, 6: syringic acid, 7: p-coumaric acid, 8: ferulic acid. A: caftaric acid, B: coutaric acid, C: fertaric acid.
Table 2
Phenolic compounds (mg/L) in control wine samples (D1, D2 and D3) before and (D1 and D3) after malolactic fermentation (mean± S.D.) (D2)
Compound Before MLF After MLF
Initial wine Control (D2) Lactic bacteria 1 (D2) Lactic bacteria 2 (D2)
Gallic acid 7.19 a± 0.05 8.41 b± 0.59 (8.68) 8.75 b± 0.08 (8.62) 8.63 b± 0.53 (9.06) Protocatechuic acid 1.32± 0.30 1.30± 0.13 (1.20) 1.28± 0.04 (1.43) 1.24± 0.08 (1.04) Caftaric acid 4.10 b± 0.51 0.25 a± 0.01 (3.02) 0.24 a± 0.09 (3.19) 0.29 a± 0.05 (3.21) Protocatechuic aldehyde 1.13 b± 0.06 0.55 a± 0.10 (1.11) 0.55 a± 0.04 (1.12) 0.51 a± 0.05 (1.16) Coutaric acid 0.85 b± 0.08 0.12 a± 0.01 (0.60) 0.06 a± 0.01 (0.63) 0.06 a± 0.01 (0.61) Fertaric acid 0.40 a± 0.07 0.06 b± 0.01 (0.67) 0.07 b± 0.01 (0.68) 0.11 b± 0.01 (0.65) Vanillic acid 1.13± 0.18 1.16± 0.29 (1.35) 1.14± 0.13 (1.27) 0.87± 0.18 (1.31) Caffeic acid 0.47 a± 0.05 6.90 b± 0.25 (3.28) 7.05 b± 0.21 (2.88) 6.80 b± 0.79 (2.85) Syringic acid 1.75 a± 0.17 2.36 b± 0.41 (2.55) 2.36 b± 0.05 (2.50) 2.05 ab± 0.06 (2.52) p-Coumaric acid 0.24 a± 0.04 2.31 b± 0.24 (0.77) 2.46 b± 0.33 (0.73) 2.26 b± 0.20 (0.78) Ferulic acid nd a 0.95 b± 0.04 (0.21) 0.95 b± 0.03 (0.16) 0.86 b± 0.11 (0.40)
Note: As D2 deposit behaved differently, their content of phenolic compounds are presented in parentisis and mean value and S.D. account for deposit D1 and D3 only. Different letters in a row denote a significant difference with 95% confidence level in the Fisher’s LSD multiple comparison test.
Table 3
Phenolic compounds (mg/L) in lysozyme wine samples (D4, D5 and D6) before and after malolactic fermentation (mean± S.D.)
Compound Before MLF After MLF
Initial wine Control Lactic bacteria 1 Lactic bacteria 2
Gallic acid 6.64 a± 0.42 7.00 ab± 0.58 7.36 ab± 0.26 7.95 b± 1.00 Protocatechuic acid 1.03 a± 0.11 1.14 ab± 0.19 1.21 ab± 0.08 1.31 b± 0.19 Caftaric acid 3.71 b± 0.56 0.27 a± 0.16 0.22 a± 0.38 0.30 a± 0.16 Protocatechuic aldehyde 1.20 b± 0.08 0.50 a± 0.05 0.51 a± 0.10 0.59 a± 0.09 Coutaric acid 0.72 b± 0.21 0.08 a± 0.07 0.09 a± 0.15 0.11 a± 0.08 Fertaric acid 0.71 b± 0.08 0.06 a± 0.08 0.05 a± 0.08 0.13 a± 0.07 Vanillic acid 1.27± 0.08 1.05± 0.09 1.19± 0.10 1.29± 0.23 Caffeic acid 0.59 a± 0.01 6.64 b± 0.58 7.18 b± 0.34 7.43 b± 0.76 Syringic acid 1.99± 0.15 2.07± 0.34 2.16± 0.09 2.35± 0.49 p-Coumaric acid 0.30 a± 0.07 2.15 b± 0.13 2.42 bc± 0.05 2.63 c± 0.35 Ferulic acid nd a 0.75 b± 0.15 0.84 b± 0.18 0.94 b± 0.29
Different letters in a row denote a significant difference with 95% confidence level in the Fisher’s LSD multiple comparison test.
hydroxycinnamic acids and their derivatives. The concentration of tartaric esters of hydroxycinnamic acids seems to drop until almost total disappearance. This results in a rise of the cor-responding free forms, caffeic, p-coumaric and ferulic acids. Similar results were already described[13].
In all wines under study, the content of non-coloured pheno-lic compounds in samples before malolactic fermentation ranges from 18.40 to 23.53 mg/L after malolactic fermentation. The dif-ference is mainly due to changes in content of tartaric esters of hydroxycinnamic and the corresponding free forms. In samples before malolactic fermentation mean value of caftaric, coutaric and fertaric acids is 5.33 mg/L and after malolactic fermentation this values drops to a mean value of 0.46 mg/L. Again consid-ering all samples the mean value for caffeic, p-coumaric and ferulic acids ranges from 0.98 to 10.24 mg/L before and after malolactic fermentation. These values also seems to indicate that there is additional sources of caffeic, p-coumaric and fer-ulic acids in wines, that probably came from the hydrolysis of cinnamoyl-glucoside anthocyanins as well as from other hidrox-ycinnamics derivates by lactic bacteria enzymatic activity[13]. It was not observed any impact on these compounds by the use of the enzyme or the lysosyme.
In all samples studied, caffeic acid is the most abundant free form of cinnamic acid. The importance of this free acid in red
wine is the possibility of its conversion into volatile phenols such as 4-ethylphenol and 4-ethylguaiacol, from p-coumaric acid and from ferulic acid, that have a huge negative impact on wine aroma.
Gallic acid content also increases with malolactic fermen-tation in all wines, while protocatechuic aldehyde content decreases. The contents of vanillic, syringic and protocatechuic acids remains almost the same after malolactic fermentation.
The differences observed in deposit 2 seem to be related with the slower disappearance of malic acid also observed in this deposit, regardless the inoculation or not wit lactic bacteria, as shown inFig. 2. Although it is not easy to explain the different behaviour of deposit 2, results obtained seem to indicate that the degradation of hydroxycinnamic acids is preceded by malic acid degradation. This is a very interesting result as it can indi-cate that measuring the malic acid conversion into lactic acid may be insufficient data to conclude about the end of malolactic fermentation.
Quantitatively there is no significant difference between wines regarding the use of different lactic bacteria. The use of lysozyme had no influence on malolactic fermentation or in the content of the compounds studied, probably from the fact that the enzyme was added at the beginning of alcoholic fermentation instead of at the end of it.
Table 4
Phenolic compounds (mg/L) in enzyme wine samples (D7, D8 and D9) before and after malolactic fermentation (mean± S.D.)
Compound Before MLF After MLF
Initial wine Control Lactic bacteria 1 Lactic bacteria 2
Gallic acid 7.50 a± 0.33 8.90 b± 0.70 7.60 a± 0.42 7.73 a± 0.28 Protocatechuic acid 0.92± 0.05 0.99± 0.12 0.86± 0.13 0.96± 0.04 Caftaric acid 4.04 b± 0.23 0.39 a± 0.23 0.33 a± 0.16 0.22 a± 0.00 Protocatechuic aldehyde 0.83 b± 0.04 0.51 a± 0.10 0.41 a± 0.08 0.44 a± 0.12 Coutaric acid 0.73 b± 0.06 0.15 a± 0.04 0.12 a± 0.03 0.09 a± 0.01 Fertaric acid 0.71 b± 0.07 0.16 a± 0.09 0.12 a± 0.07 0.07 a± 0.00 Vanillic acid 1.05 ab± 0.07 1.22 b± 0.22 0.96 b± 0.09 1.00 ab± 0.04 Caffeic acid 1.05 a± 0.07 7.09 b± 0.35 6.84 b± 0.83 7.23 b± 0.34 Syringic acid 1.34 a± 0.13 1.89 b± 0.21 1.52 ab± 0.17 1.65 ab± 0.28 p-Coumaric acid 0.30 a± 0.02 2.52 b± 0.25 2.43 b± 0.29 2.43 b± 0.08 Ferulic acid nd a 0.64 b± 0.12 0.73 b± 0.15 0.72 b± 0.12
Some authors have observed some changes in the content of phenolic aldehydes and acids[21]or total polyphenols[29]
by the use of commercial pectolitic enzymes. In this study any significant changes were observed in wines fermented in the presence of the commercial enzyme, except for caffeic acid that showed higher concentration values in these wines before malolactic fermentation. This could be related with the phe-nol esterase side activity present in this enzyme[30]. Syringic acid content did not increase in wines treated with the enzyme. Again it can be related to side activity of the commercial enzyme used, in this case, the lack of -glucosidase activ-ity, as it is known that syringic acid arises from B-ring of malvidin-3-glucoside upon its degradation [31]. Vanillic and siringic acids content are very similar in all wines because their presence in wines is not related to yeast metabolism but to the extraction from solid parts of grapes by alcohol and depends on the alcohol content[32]that in this wines were the same.
4. Conclusions
The obtained data show that hydroxycinnamic acids and their derivatives were the main compounds modified by malolactic fermentation, independently of the use or not of commercial lactic bacterias. In fact it seems clear that the decrease in con-centration of caftaric, coutaric and fertaric acids, and the increase in concentration of caffeic, p-coumaric and ferulic acids are linked to lactic acid bacteria metabolism, as previously stated by Hern´andez and co-workers[33]that have shown that trans-caftaric and trans-coutaric acids are substrates of lactic acid bacteria witch can exhibit cinnamoyl esterase activities during malolactic fermentation, increasing the concentration of hydrox-ycinnamic acids.
Results also seem to indicate that the use of lysozyme in grapes, prior to alcoholic fermentation have no effect on malo-lactic fermentation development. Also the enzyme used in this work had no significant impact on non-coloured phenolic com-position of these red wines.
Acknowledgments
Authors wish to thanks AEB Bioqu´ımica Portuguesa
for kindly providing the enological products, and
Fundac¸˜ao para a Ciˆencia e a Tecnologia, Minist´erio da Ciˆencia, Tecnologia e Ensino Superior and Programa Operacional Ciˆencia e Inovac¸˜ao 2010 (POCI 2010) for financial support (Projects POCI/AGR 56771 and POCI/ AGR 55432).
References
[1] V.L. Singleton, P. Esau, Academic Press New York, 1969. [2] J.L. Robichaud, A.C. Noble, J. Sci. Food Agric. 53 (1990) 343–353. [3] V.L Singleton, A.C. Noble, Phenolic, sulfur and nitrogen compounds in
food flavors, in: ACS Symposium Series 26, 1976, pp. 47–70.
[4] I. Biudic-Leto, T. Lovric, Food Technol. Biotechnol. 40 (2002) 221– 225.
[5] D.A.N. Edlin, A. Narbad, N.J. Gasson, J.R. Dickinson, D. Lloyd, Enzyme Microbial. Technol. 22 (1998) 232–239.
[6] R. Brouillard, O. Dangles, Food Chem. 51 (1994) 365–371.
[7] J.A. Couto, F.M. Campos, A.R. Figueiredo, T.A. Hogg, Am. J. Enol. Vitic 57 (2) (2006) 166–171.
[8] T. Heresztyn, Arch. Microbiol. 146 (1986) 96–98. [9] D. Stead, J. Appl. Bacteriol. 75 (1993) 135–141.
[10] N. Vivas, L. Bellem`ere, A. Lonvaud-Funel, Y. Glories, M. Augustin, Revue Franc¸aise D’enologie 149 (1994) 37–42.
[11] N. Vivas, L. Bellem`ere, A. Lonvaud-Funel, Y. Glories, M. Augustin, Revue Franc¸aise D’enologie 151 (1995) 39–45.
[12] N. Vivas, A. Lonvaud-Funel, Y Glories, Food Microbiol. 14 (1997) 291–300.
[13] T. Hern´andez, I. Estrella, D. Carlavilla, P.J. Mart´yn-Alvarez, M.V Moreno-Arribas, Anal. Chim. Acta 563 (2006) 116–125.
[14] A.F. Recamales, A. Sayago, M.L. Gonz´alez-Miret, D. Hernanz, Food Res. Int. 39 (2006) 220–229.
[15] R. Ramos, P.B. Andrade, R.M. Seabra, C. Pereira, M.A. Ferreira, M.A. Faia, Food Chem. 67 (1999) 39–44.
[16] S. Malovan´a, F.J.G. Montelongo, J.P. P´erez, M.A. Rodr´ıgues-Delgado, Anal. Chim. Acta 428 (2001) 245–253.
[17] L.R. Silva, P.B. Andrade, P. Valent˜ao, R.M. Seabra, M.E. Trujillo, E. Vel´azquez, Food Chem. 89 (2005) 185–189.
[18] R. Di Stefano, M.C. Cravero, Sci. des Aliments 12 (1992) 139–144. [19] D.A. Guill´en, F. Merello, C.G. Barroso, J.A. P´erez-Bustamante, J. Agric.
Food Chem. 45 (1997) 403–406.
[20] C.Y. Lee, A. Jaworski, Am. J. Enol. Vitic. 38 (1987) 277–281. [21] I. Revilla, M.L Gonz´ales-San Jos´e, Food Chem. 80 (2003) 205–214. [22] F. Nave, M.a.J. Cabrita, C.T Costa, J. Chromatogr. A (2007) 07–861. [23] M. Del Alamo, I.N. Dom´ınguez, L.M.C. C´arcel, L.N. Gracia, Anal. Chim.
Acta (2004).
[24] C. Proestos, A. Bakogiannis, C. Psarianos, A.A. Koutinas, M. Kanellaki, M. Komaitis, Food Control 16 (2005) 319–323.
[25] S. P´erez-Magarino, I. Revilla, M.L. Gonz´alez-SanJos´e, S. Beltr´an, J. Chro-matogr. A 847 (1999) 75–81.
[26] M.A. Rodr´ıgues-Delgado, G. Gonz´alez-Hern´andez, J.E. Conde-Gonz´alez, J.P. P´erez-Trujillo, Food Chem. 78 (2002) 523–532.
[27] V.L. Singleton, C.F. Timberlake, A.G.H. Lea, J. Sci. Food Agric. 29 (1978) 403–410.
[28] P. Cane, L’enotecnico 26 (1990) 69–72.
[29] F. Pardo, M.R. Salinas, G.L. Alonso, G. Navarro, M.D. Huerta, Food Chem. 67 (1999) 135–142.
[30] A. Parley, Ph D Thesis, University of Lincoln, New Zeland, 1997. [31] A.B. Bautista-Ort´ın, A. Martinez-Cutillas, J.M. Ros-Garcia, J.M.
L´opez-Roca, E. G´omez-Plaza, Int. J. Food Sci. Technol. 40 (2005) 867–878. [32] R. Di Stefano, M.C. Cravero, Riv. Vitic. Enol. 43 (1990) 47–53. [33] T. Hern´andez, I. Estrella, M. P´erez-Gordo, E.G. Alegr´ıa, C. Tenorio, F.
Ruiz-Larrrea, Moreno-Arribas, M.V. J. Agric. Food Chem. 55 (2007) 5260–5266.