www.atmos-chem-phys.net/17/981/2017/ doi:10.5194/acp-17-981-2017
© Author(s) 2017. CC Attribution 3.0 License.
Concentrations and stable carbon isotope compositions of
oxalic acid and related SOA in Beijing before, during,
and after the 2014 APEC
Jiayuan Wang1,3, Gehui Wang1,2,3,4, Jian Gao5,6, Han Wang5,6, Yanqin Ren1,3, Jianjun Li1, Bianhong Zhou1, Can Wu1,3, Lu Zhang1,3, Shulan Wang5,6, and Fahe Chai5,6
1State Key Laboratory of Loess and Quaternary Geology, Key Lab of Aerosol Chemistry and Physics,
Institute of Earth Environment, Chinese Academy of Sciences, Xi’an 710061, China
2School of Human Settlements and Civil Engineering, Xi’an Jiaotong University, Xi’an 710079, China 3University of Chinese Academy of Sciences, Beijing 100049, China
4Center for Excellence in Regional Atmospheric Environment, Institute of Urban Environment,
Chinese Academy of Sciences, Xiamen 361021, China
5State Key Laboratory of Environmental Criteria and Risk Assessment, Chinese Research Academy of
Environmental Sciences, Beijing 100084, China
6Collaborative Innovation Center of Atmospheric Environment and Equipment Technology, Nanjing 210000, China
Correspondence to:Gehui Wang (wanggh@ieecas.cn) and Jian Gao (gaojian@craes.org.cn)
Received: 22 July 2016 – Published in Atmos. Chem. Phys. Discuss.: 22 August 2016 Revised: 29 December 2016 – Accepted: 3 January 2017 – Published: 23 January 2017
Abstract. To ensure good air quality for the 2014 Asia-Pacific Economic Cooperation (APEC) summit, stringent emission controls were implemented in Beijing and its sur-rounding regions, leading to a significant reduction in PM2.5
loadings. To investigate the impact of the emission con-trols on aerosol chemistry, high-volume PM2.5samples were
collected in Beijing from 8 October to 24 November 2014 and determined for secondary inorganic aerosols (SIA, i.e., SO2−
4 , NO
−
3, and NH
+
4), dicarboxylic acids, keto-carboxylic
acid, and α-dicarbonyls, as well as stable carbon isotope composition of oxalic acid (C2). Our results showed that
SIA, C2, and related secondary organic aerosols in PM2.5
during APEC were 2–4 times lower than those before APEC, which is firstly ascribed to the strict emission control mea-sures and secondly attributed to the relatively colder and drier conditions during the event that are unfavorable for sec-ondary aerosol production.
C2in the polluted air masses, which mostly occurred
be-fore APEC, are abundant and enriched in13C. On the
con-trary, C2in the clean air masses, which mostly occurred
dur-ing APEC, is much less abundant but still enriched in13C.
In the mixed type of clean and polluted air masses, which mostly occurred after APEC, C2 is lower than that before
APEC but higher than that during APEC and enriched in lighter12C. A comparison on chemical composition of fine
particles andδ13C values of C2in two events that are
char-acterized by high loadings of PM2.5further showed that
af-ter APEC SIA and the total detected organic compounds (TDOC) are much less abundant and fine aerosols are en-riched with primary organics and relatively fresh, compared with those before APEC.
1 Introduction
Atmospheric aerosols profoundly impact the global climate directly by scattering and absorbing solar radiation and in-directly by affecting cloud formation and distribution via acting as cloud condensation nuclei (CCN) and ice nuclei (IN). Moreover, atmospheric aerosols exert negative effects on human health because of their toxicity. Due to fast urban-ization and industrialurban-ization, high levels of atmospheric fine particle (PM2.5)pollution have been a persistent problem in
haze pollution, especially in winter, affecting more than 21 million people by the end of 2014 (Beijing Municipal Bu-reau of Statistics, 2015) and causing billions in economic losses (Mu and Zhang, 2013). To improve the air quality, the Beijing government has made many efforts to reduce the pollutant emissions (i.e., SO2, NOx, dust, and volatile or-ganic compounds (VOCs)) from a variety of sources. The 2014 Asia-Pacific Economic Cooperation (APEC) summit was hosted in Beijing from 5 to 11 November. To ensure good air quality for the summit, a joint strict emission con-trol program was conducted from 3 November 2014 in Bei-jing and its neighboring provinces including Inner Mongolia, Shanxi, Hebei, and Shandong provinces. During this period thousands of factories and power plants with high emissions were shut down and/or halted, all the construction activities were stopped, and the numbers of on-road vehicles were re-duced. These strict emission controls resulted in the air qual-ity of Beijing during the APEC period being significantly improved, leading to a decrease in PM2.5concentration by
59.2 % and an increase in visibility by 70.2 % in Beijing dur-ing the summit compared with those before the APEC (Tang et al., 2015; Z. Wang et al., 2015) and a term of “APEC blue” being created to refer to the good air quality. Such strong artificial intervening not only reduced PM2.5and its
precur-sors’ loadings in Beijing and its surrounding areas but also affected the composition and formation mechanisms of the fine particles (Sun et al., 2016).
A number of field measurements have shown that particle compositions in Beijing during wintertime haze periods are dominated by secondary aerosols (Guo et al., 2014; Huang et al., 2014; Xu et al., 2015). Rapid accumulation of particle mass in Beijing during the haze formation process is often accompanied by continuous particle size growth (Guo et al., 2014; Zhang et al., 2015), which is in part due to the coating of secondary organic aerosols (SOA) on pre-existing parti-cles (Li et al., 2010). Several studies have found that SOA production during the 2014 Beijing APEC periods signifi-cantly reduced and ascribed this reduction to the efficient re-gional emission control (Sun et al., 2016; Xu et al., 2015). However, up to now information on the SOA decrease on a molecular level has not been reported.
Dicarboxylic acids are the major class of SOA species in the atmosphere and ubiquitously found from the ground surface to the free troposphere (Fu et al., 2008; Myrioke-falitakis et al., 2011; Sorooshian et al., 2007; Sullivan and Prather, 2007). Previous studies have suggested that organic acids including dicarboxylic acids could take part in atmo-spheric particle nucleation (Zhang et al., 2004; Zhao et al., 2009) and growth processes (Zhang et al., 2012). Further-more, organic acids may play a central role in the aging of black carbon particles (Xue et al., 2009; Ma et al., 2013), enhancing their roles in air pollution accumulation, and di-rect radiative forcing (Peng et al., 2016). In the current work we measured molecular distributions of dicarboxylic acids, keto-carboxylic acids and α-dicarbonyls and stable carbon
isotope composition of oxalic acid in PM2.5 aerosols
col-lected in Beijing before, during, and after the APEC event in order to explore the impact of the APEC emission control on SOA in Beijing. We first investigated the changes in con-centration and composition of dicarboxylic acids and related compounds during the three periods, then recognized the dif-ference in stable carbon isotope composition of oxalic acid in different air masses in Beijing during the APEC campaign. Finally we compared the differences in chemical composi-tions of PM2.5during two heaviest pollution episodes.
2 Experimental section 2.1 Sample collection
PM2.5samples were collected by using a high-volume
sam-pler (TISCH, USA) from 8 October to 24 November 2014 on the rooftop of a three-storey building located on the campus of the China Research Academy of Environmental Sciences, which is situated in the north part of Beijing and close to the fifth ring road. All the PM2.5 samples were collected onto
pre-baked (450◦C for 8 h) quartz fiber filters (Whatman 41,
USA). The duration of each sample collection is 23 h from 08:00 LT of the previous day to 07:00 LT of the next day. Field blanks were also collected before and after the cam-paign by mounting a pre-baked filter onto the sampler for 15 min without pumping air. After collection, all the filter samplers were individually sealed in aluminum foil bags and stored in a freezer (−18◦C) prior to analysis. Daily values of
SO2, NOx, and meteorological parameters were cited from the website of Beijing Environmental Protection Agency.
2.2 Sample analysis
2.2.1 Elemental carbon (EC), organic carbon (OC), water-soluble organic carbon (WSOC), inorganic ions, aerosol liquid water content (ALWC) and aerosol acidity
Detailed methods for the analysis of EC, OC, WSOC, and inorganic ions in aerosols were reported elsewhere (Wang et al., 2010). Briefly, EC and OC in the PM2.5
samples were determined by using DRI Model 2001 Carbon analyzer following the Interagency Monitoring of Pro-tected Visual Environments (IMPROVE) thermal/optical reflectance (TOR) protocol (Chow et al., 2007). WSOC and inorganic ions in the samples were extracted with Milli-Q pure water and measured by using a Shimadzu TOC-L CPH analyzer and Dionex-600 ion chromatog-raphy, respectively (Wang et al., 2010). In the current work, aerosol liquid water content (ALWC) and acidity (i.e., liquid H+ concentrations, [H+]) of the samples were
calculated by using ISORROPIA-II model, which treated the Na+−NH+
4−K+−Ca2+−Mg2+−Cl−−NO
−
3−SO2
−
4
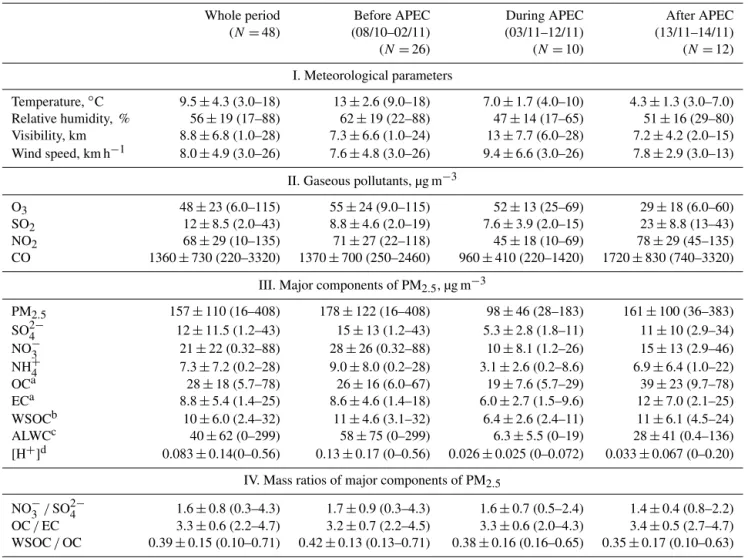
Table 1.Meteorological parameters and concentrations of gaseous pollutants and chemical components of PM2.5in Beijing during the 2014 APEC campaign.
Whole period Before APEC During APEC After APEC (N=48) (08/10–02/11) (03/11–12/11) (13/11–14/11) (N=26) (N=10) (N=12)
I. Meteorological parameters
Temperature,◦C 9.5±4.3 (3.0–18) 13±2.6 (9.0–18) 7.0±1.7 (4.0–10) 4.3±1.3 (3.0–7.0)
Relative humidity, % 56±19 (17–88) 62±19 (22–88) 47±14 (17–65) 51±16 (29–80) Visibility, km 8.8±6.8 (1.0–28) 7.3±6.6 (1.0–24) 13±7.7 (6.0–28) 7.2±4.2 (2.0–15) Wind speed, km h−1 8.0±4.9 (3.0–26) 7.6±4.8 (3.0–26) 9.4±6.6 (3.0–26) 7.8±2.9 (3.0–13)
II. Gaseous pollutants, µg m−3
O3 48±23 (6.0–115) 55±24 (9.0–115) 52±13 (25–69) 29±18 (6.0–60) SO2 12±8.5 (2.0–43) 8.8±4.6 (2.0–19) 7.6±3.9 (2.0–15) 23±8.8 (13–43) NO2 68±29 (10–135) 71±27 (22–118) 45±18 (10–69) 78±29 (45–135) CO 1360±730 (220–3320) 1370±700 (250–2460) 960±410 (220–1420) 1720±830 (740–3320)
III. Major components of PM2.5, µg m−3
PM2.5 157±110 (16–408) 178±122 (16–408) 98±46 (28–183) 161±100 (36–383) SO2−
4 12±11.5 (1.2–43) 15±13 (1.2–43) 5.3±2.8 (1.8–11) 11±10 (2.9–34)
NO−3 21±22 (0.32–88) 28±26 (0.32–88) 10±8.1 (1.2–26) 15±13 (2.9–46) NH+4 7.3±7.2 (0.2–28) 9.0±8.0 (0.2–28) 3.1±2.6 (0.2–8.6) 6.9±6.4 (1.0–22) OCa 28±18 (5.7–78) 26±16 (6.0–67) 19±7.6 (5.7–29) 39±23 (9.7–78) ECa 8.8±5.4 (1.4–25) 8.6±4.6 (1.4–18) 6.0±2.7 (1.5–9.6) 12±7.0 (2.1–25) WSOCb 10±6.0 (2.4–32) 11±4.6 (3.1–32) 6.4±2.6 (2.4–11) 11±6.1 (4.5–24) ALWCc 40±62 (0–299) 58±75 (0–299) 6.3±5.5 (0–19) 28±41 (0.4–136) [H+]d 0.083±0.14(0–0.56) 0.13±0.17 (0–0.56) 0.026±0.025 (0–0.072) 0.033±0.067 (0–0.20)
IV. Mass ratios of major components of PM2.5
NO−
3/SO24− 1.6±0.8 (0.3–4.3) 1.7±0.9 (0.3–4.3) 1.6±0.7 (0.5–2.4) 1.4±0.4 (0.8–2.2)
OC/EC 3.3±0.6 (2.2–4.7) 3.2±0.7 (2.2–4.5) 3.3±0.6 (2.0–4.3) 3.4±0.5 (2.7–4.7) WSOC/OC 0.39±0.15 (0.10–0.71) 0.42±0.13 (0.13–0.71) 0.38±0.16 (0.16–0.65) 0.35±0.17 (0.10–0.63)
aOrganic carbon (OC) and elemental carbon (EC).bWater-soluble organic carbon (WSOC).cAerosol liquid water content (ALWC).dHydrogen ion concentration ([H+]).
2.2.2 Dicarboxylic acids, keto-carboxylic acids and
α-dicarbonyls
The method of analyzing PM2.5 samples for dicarboxylic
acids, ketocarboxylic acids and α-dicarbonyl has been re-ported elsewhere (Wang et al., 2002, 2012; Meng et al., 2014; Cheng et al., 2015). Briefly, one eighth of the filter was ex-tracted with Milli-Q water, concentrated to near dryness, and reacted with 14 % BF3/butanol at 100◦C for 1 h to convert
the aldehyde group into dibutoxy acetal and the carboxyl group into butyl ester. Target compounds in the derivatized samples were identified by gas chromotography–mass spec-trometry (GC–MS) and quantified by a gas chromotography– flame ionization detector (GC–FID) (Agilent GC7890A).
2.3 Stable carbon isotope composition of oxalic acid (C2)
Stable carbon isotope composition (δ13C) of C2 was
mea-sured using the method developed by Kawamura and Watan-abe (2004). Briefly,δ13C values of the derivatized samples above were determined by gas chromatography–isotope ratio mass spectrometry (GC-IR-MS; Thermo Fisher, Delta V Ad-vantage). Theδ13C value of C2was then calculated from an
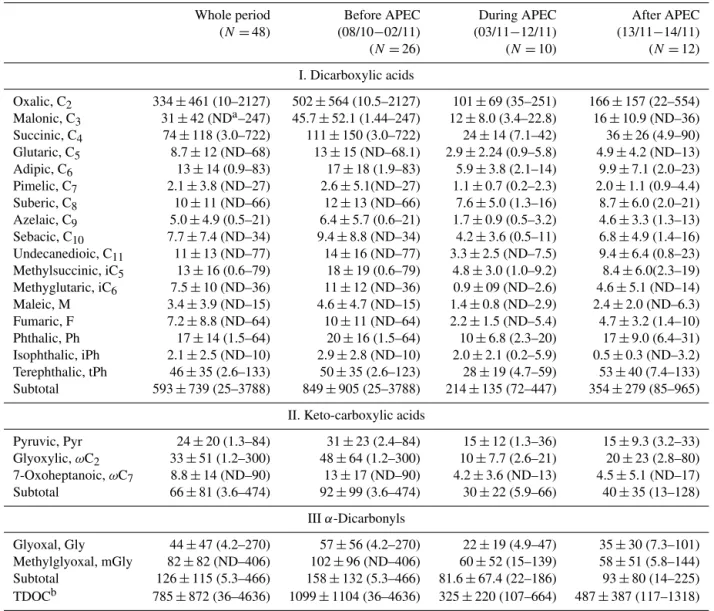
Table 2.Concentrations of dicarboxylic acids and related compounds in PM2.5in Beijing during the 2014 APEC campaign (ng m−3).
Whole period Before APEC During APEC After APEC (N=48) (08/10−02/11) (03/11−12/11) (13/11−14/11) (N=26) (N=10) (N=12)
I. Dicarboxylic acids
Oxalic, C2 334±461 (10–2127) 502±564 (10.5–2127) 101±69 (35–251) 166±157 (22–554) Malonic, C3 31±42 (NDa–247) 45.7±52.1 (1.44–247) 12±8.0 (3.4–22.8) 16±10.9 (ND–36) Succinic, C4 74±118 (3.0–722) 111±150 (3.0–722) 24±14 (7.1–42) 36±26 (4.9–90) Glutaric, C5 8.7±12 (ND–68) 13±15 (ND–68.1) 2.9±2.24 (0.9–5.8) 4.9±4.2 (ND–13) Adipic, C6 13±14 (0.9–83) 17±18 (1.9–83) 5.9±3.8 (2.1–14) 9.9±7.1 (2.0–23) Pimelic, C7 2.1±3.8 (ND–27) 2.6±5.1(ND–27) 1.1±0.7 (0.2–2.3) 2.0±1.1 (0.9–4.4) Suberic, C8 10±11 (ND–66) 12±13 (ND–66) 7.6±5.0 (1.3–16) 8.7±6.0 (2.0–21) Azelaic, C9 5.0±4.9 (0.5–21) 6.4±5.7 (0.6–21) 1.7±0.9 (0.5–3.2) 4.6±3.3 (1.3–13) Sebacic, C10 7.7±7.4 (ND–34) 9.4±8.8 (ND–34) 4.2±3.6 (0.5–11) 6.8±4.9 (1.4–16) Undecanedioic, C11 11±13 (ND–77) 14±16 (ND–77) 3.3±2.5 (ND–7.5) 9.4±6.4 (0.8–23) Methylsuccinic, iC5 13±16 (0.6–79) 18±19 (0.6–79) 4.8±3.0 (1.0–9.2) 8.4±6.0(2.3–19) Methyglutaric, iC6 7.5±10 (ND–36) 11±12 (ND–36) 0.9±09 (ND–2.6) 4.6±5.1 (ND–14) Maleic, M 3.4±3.9 (ND–15) 4.6±4.7 (ND–15) 1.4±0.8 (ND–2.9) 2.4±2.0 (ND–6.3) Fumaric, F 7.2±8.8 (ND–64) 10±11 (ND–64) 2.2±1.5 (ND–5.4) 4.7±3.2 (1.4–10) Phthalic, Ph 17±14 (1.5–64) 20±16 (1.5–64) 10±6.8 (2.3–20) 17±9.0 (6.4–31) Isophthalic, iPh 2.1±2.5 (ND–10) 2.9±2.8 (ND–10) 2.0±2.1 (0.2–5.9) 0.5±0.3 (ND–3.2) Terephthalic, tPh 46±35 (2.6–133) 50±35 (2.6–123) 28±19 (4.7–59) 53±40 (7.4–133) Subtotal 593±739 (25–3788) 849±905 (25–3788) 214±135 (72–447) 354±279 (85–965)
II. Keto-carboxylic acids
Pyruvic, Pyr 24±20 (1.3–84) 31±23 (2.4–84) 15±12 (1.3–36) 15±9.3 (3.2–33) Glyoxylic,ωC2 33±51 (1.2–300) 48±64 (1.2–300) 10±7.7 (2.6–21) 20±23 (2.8–80) 7-Oxoheptanoic,ωC7 8.8±14 (ND–90) 13±17 (ND–90) 4.2±3.6 (ND–13) 4.5±5.1 (ND–17) Subtotal 66±81 (3.6–474) 92±99 (3.6–474) 30±22 (5.9–66) 40±35 (13–128)
IIIα-Dicarbonyls
Glyoxal, Gly 44±47 (4.2–270) 57±56 (4.2–270) 22±19 (4.9–47) 35±30 (7.3–101) Methylglyoxal, mGly 82±82 (ND–406) 102±96 (ND–406) 60±52 (15–139) 58±51 (5.8–144) Subtotal 126±115 (5.3–466) 158±132 (5.3–466) 81.6±67.4 (22–186) 93±80 (14–225) TDOCb 785±872 (36–4636) 1099±1104 (36–4636) 325±220 (107–664) 487±387 (117–1318)
aND: not detectable.bTDOC: total detected organic compounds.
3 Results and discussion
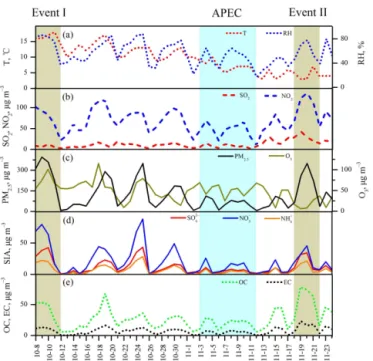
3.1 Variations in meteorological conditions, gaseous pollutants, and major components of PM2.5during
the Beijing 2014 APEC campaign
Based on the emission control implementation for the APEC, we divided the whole study period into three phases: before APEC (8 October to 2 November), during APEC (3 to 12 November) and after APEC (13 to 24 November). Temporal variations in meteorological parameters and concentrations of gaseous pollutants and major components of PM2.5
dur-ing the three phases are shown in Fig. 1 and summarized in Table 1.
Temperature during the sampling campaign showed a con-tinuous decreasing trend with averages of 13±2.6, 7.0±1.7,
and 4.3±1.3◦C before, during, and after APEC,
respec-tively, while relative humidity (RH) did not show a clear trend, with mean values of 62±19, 47±14, and 51±16 %
during the three periods (Fig. 1a and Table 1). SO2showed
a similar level before and during APEC (8.8±4.6 µg m−3
versus 7.6±3.9 µg m−3; Table 1 and Fig. 1b), but increased
dramatically to 23±8.8 µg m−3 after APEC due to
do-mestic coal burning for house heating. NO2 concentration
(45±18 µg m−3)during the APEC reduced by about 30 % compared to that in the before- and after-APEC phases (71±27 µg m−3versus 78±29 µg m−3; Table 1), mainly
be-cause of the reduction of the on-road vehicle numbers, as well as the reduced productivities of power plant and in-dustry. O3 displayed a decreasing trend similar to that of
temperature (Fig. 1c). PM2.5 pollution episodes in Beijing
Figure 1. Temporal variations of meteorological conditions, gaseous pollutants and major components of PM2.5 during the 2014 APEC campaign. (The green shadows represent two air pol-lution events characterized by highest PM2.5levels before and after
APEC, while the blue shadow represents the APEC event).
Figure 2.Chemical composition of PM2.5during the 2014 APEC
campaign.
i.e., SO2−
4 , NO
−
3, and NH
+
4)are major components of PM2.5
and present a temporal variation pattern similar to that of the fine particles (Fig. 1d). In the current work, the mass ra-tio of NO−
3 /SO24−in PM2.5during the whole study time is
1.8±1.9 (Table 1), which is in agreement with the ratio (1.6–
2.4) for PM1observed during the same time by using aerosol
mass spectrometry (AMS; Sun et al., 2016). OC and EC of PM2.5are linearly correlated each other (R2=0.91) and
varied periodically in a cycle similar to SIA (Fig. 1e). The OC/EC ratio during the whole sampling period is 3.3±0.6
(range: 2.2–4.7) with no significant differences among the three APEC phases (Table 1), although the source emissions could be largely different.
Figure 2 shows the differences in chemical composi-tion of PM2.5 before, during, and after APEC. PM2.5
is 98±46 µg m−3 during APEC, about 50 % lower than
Figure 3.Molecular distributions of dicarboxylic acids and related
compounds in PM2.5 of Beijing, China, during the 2014 APEC
campaign. The pie chart is the average composition of total detected organic compounds (TDOC) and the top number is the average mass concentration of TDOC of the whole study period.
that before and after APEC (178±122 µg m−3 versus
161±100 µg m−3, respectively). Organic matter (OM) is
the most abundant component of the fine particles. Rela-tive abundance of OM (1.6 times OC; Xing et al., 2013) to PM2.5 continuously increases from 24 % before APEC
to 30 and 39 % during and after APEC, respectively, al-though the mass concentration (19±7.6 µg m−3)of OC dur-ing APEC is the lowest compared to those before and after APEC (26±16 µg m−3versus 39±23 µg m−3). Sulfate, ni-trate, and ammonium before APEC are 15±13, 28±26, and
9.0±8.0 µg m−3(Table 1) and account for 8, 16, and 5 % of
PM2.5, respectively (Fig. 2). Their concentrations decrease
to 5.3±2.8, 10±8.1, and 3.1±2.6 µg m−3 (Table 1) with
the relative contributions to PM2.5 down to 5, 10, and 3 %
during APEC, respectively, while after APEC their concen-trations increased to 11±10, 15±13, and 6.9±6.4 µg m−3
and accounted for 7, 9, and 4 % of PM2.5. Such significant
decreases in concentrations of OM and SIA during APEC demonstrate the efficiency of the emission controls. The OC/EC ratio is almost constant during the whole period, but the WSOC/OC ratio decreased by 20 % from 0.42±0.13
before APEC, 0.38±0.16 during APEC to 0.35±0.17
af-ter APEC (Table 1). Since WSOC in fine aerosols consists mainly of SOAs (Laskin et al., 2015), the decreasing ratio of WSOC/OC probably indicates reduced SOA production during the campaign.
3.2 Oxalic acid and related SOA during the Beijing 2014 APEC campaign
A homogeneous series of dicarboxylic acids (C2−C11),
keto-carboxylic acid andα-dicarbonyls in the PM2.5samples were
detected. As shown in Table 2, total dicarboxylic acids during the whole study period is 593±739 ng m−3, which is lower
Re-Figure 4. Compositions of total detected organic compounds (TDOC) in PM2.5during the 2014 APEC campaign.
search in Beijing 2006 (CAREBeijing; average 760 ng m−3)
and 2007 (average 1010 ng m−3; Ho et al., 2010, 2015) and
the averaged wintertime concentration reported by a previ-ous study on 14 Chinese cities (904 ng m−3; Ho et al., 2007).
Total keto-carboxylic acid is 66±81 ng m−3, while total
di-carbonyl is 126±115 ng m−3 (Table 2). These values are
higher than those during CAREBeijing 2006 and 2007 (Ho et al., 2010, 2015), but close to the value observed for the 14 Chinese megacities (Ho et al., 2007). Being similar to those previous observations, oxalic acid (C2) is the most abundant diacid in the 2014 APEC samples, with an average of 334±461 ng m−3(range: 10–2127 ng m−3, Table 2)
dur-ing the whole campaign, followed by methylglyoxal (mGly), succinin acid (C4), terephthalic acid (tPh), and glyoxal (Gly).
These five species account for 43, 10, 9, 6 and 6 % of total detected organic compounds (TDOC), respectively (Fig. 3).
As seen in Fig. 4, TDOC in PM2.5 are 1099±1104,
325±220, and 487±387 ng m−3 before, during, and after
APEC, respectively. In comparison with those before APEC, TDOC during APEC decreased by 71 %. Oxalic acid (C2)is
the leading species among the detected organic compounds and accounted for 46, 31, and 34 % of TDOC during the three phases, respectively (Fig. 4). C2 is an end product of
pre-cursors that are photochemically oxidized in aerosol aque-ous phase via either oxidation of small compounds contain-ing two carbon atoms or decomposition of larger compounds containing three or more carbon atoms. Thus the mass ra-tio of C2 to TDOC is indicative of aerosol aging (Wang et
al., 2012; Ho et al., 2015). As shown in Fig. 4, the highest proportion of C2before APEC suggests that organic aerosols
during this period are more oxidized, compared to those dur-ing and after APEC. Gly and methylglyoxal (mGly) are the precursors of C2. Mass ratios of both compounds to TDOC
are lowest before APEC (Fig. 4), further indicating enhanced SOA production during this period.
3.3 Formation mechanism of oxalic acid
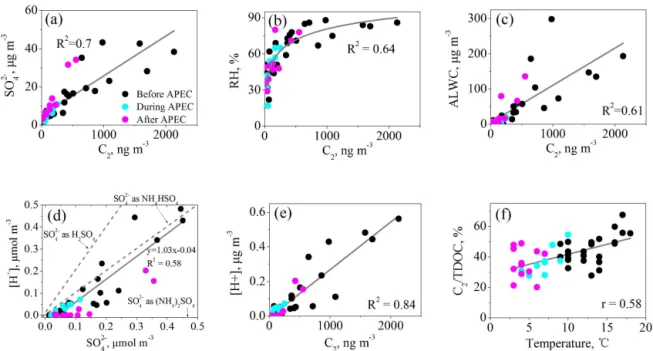
3.3.1 Correlation of oxalic acid with temperature, relative humidity (RH), aerosol liquid water content (ALWC) and acidity and sulfate
A few studies have pointed out that aerosol aqueous phase oxidation is a major formation pathway for oxalic acid (Yu et al., 2005; van Pinxteren et al., 2014; Bikkina et al., 2015; Tilgner and Herrmann, 2010). To explore the formation mechanism of oxalic acid, we calculated ALWC and acidity (i.e., proton concentration, [H+]) of PM
2.5 aerosols by
us-ing ISOROPPIA-II model (Weber et al., 2016). As shown in Fig. 5, during the entire period C2showed a strong linear
cor-relation with sulfate (R2=0.70 Fig. 5a), which is consistent
with the measurements observed in Xi’an (Wang et al., 2012) and other Chinese cities (Yu et al., 2005). Previous studies on particle morphology showed that sulfate particles inter-nally mix with SOA in Beijing, especially on humid haze days (Li et al., 2010, 2011), which probably indicates that they are formed via similar aqueous phase pathways (Wang et al., 2016b). In addition, a robust correlation was also found for C2with RH (R2=0.64, Fig. 5b) and ALWC (R2=0.61,
Fig. 5c), indicating that humid conditions are favorable for the aqueous phase formation of C2, which is most likely due
to an enhanced gas-to-aerosol aqueous phase partitioning of the precursors (e.g., Gly and mGly; Fu et al., 2008; G. Wang et al., 2015).
NH+
4, NO−3, and SO24−are the dominant cation and anions
of fine particles in Beijing (Guo et al., 2014; Zhang et al., 2015) and the molar ratio of [NH+
4] to [NO−3]+[SO24−] in
this study is 1.1. Thus it is plausible that SO2−
4 during the
APEC campaign largely existed as ammonium bisulfate, re-sulting in a strong linear correlation between [H+] and SO2−
4
with a molar slope of 1.03 (Fig. 5d; Zhang et al., 2007). In addition, [H+] shows a significant positive correlation with
C2(R2=0.84; Fig. 5e), possibly due to the fact that acidic
conditions are favorable for the formation of C2precursors.
For example, Surratt et al. (2007, 2010) found that aerosol acidity can promote the formation of biogenic SOA (BSOA) derived from isoprene oxidation, such as 2-methylglyceric acid, Gly and mGly. These BSOA precursors can be further oxidized into C2(Meng et al., 2014; Wang et al., 2009).
There is a significant positive correlation (R2=0.58, p< 0.001) between the mass ratios of C2/TDOC and am-bient temperatures (Fig. 5f), which is similar to the results found by previous researchers (Ho et al., 2007; Strader et al., 1999), indicating that organic aerosols are more aged under a higher temperature condition (Erven et al., 2011; Carlton et al., 2009). Thus, compared with those before APEC, the lower C2/TDOC ratios (31 and 34 % (Fig. 4) during and
Figure 5.Correlation analysis for oxalic acid (C2)and sulfate in PM2.5during the whole 2014 APEC campaign.(a–c)Concentrations of C2 with sulfate, relative humidity (RH), and aerosol liquid water content (ALWC);(d, e)sulfate and C2with aerosol acidity [H+] and
(f)temperature with mass ratio of C2to total detected organic compounds (C2/TDOC).
Table 3. Linear correlation coefficients of δ13C of C2 with
C2/ ωC2, C2/mGly, and TDOC/WSOC.
C2/ ωC2 C2/mGly TDOC/WSOC
δ13C 0.49∗∗ 0.35∗ 0.41∗
∗∗p< 0.01;∗p< 0.05.
7.0±1.7 and 4.3±1.3◦C in the before-, during- and
after-APEC periods, respectively; Table 1).
3.3.2 Temporal variation in stable carbon isotopic composition of oxalic acid
To further discuss the formation mechanism of C2, we
in-vestigated the temporal variations of concentration and sta-ble carbon isotopic composition of C2in the PM2.5samples
(Fig. 6). Previous studies have demonstrated that Gly, mGly, glyoxylic acid (ωC2), and pyruvic acid (Pyr) are the precur-sors of C2 (Carlton et al., 2006, 2007; Ervens et al., 2004;
Wang et al., 2012). Thus, higher mass ratios of C2 to its
precursors indicate that organic aerosols are more oxidized (Wang et al., 2010). As shown in Table 3,δ13C of C2in this
work positively correlated with the mass ratios of C2/ ωC2,
C2/mGly, and TDOC/WSOC, demonstrating an
enrich-ment of13C during the aerosol oxidation process. Because decomposition (or breakdown) of larger molecular weight precursors in aerosol aqueous phase is the dominant forma-tion pathway for C2in the aerosol ageing process (Kawamura
et al., 2016; Gensch et al., 2014; Kirillova et al., 2013), dur-ing which organic compounds release CO2/CO by reaction
with OH radical and other oxidants, resulting in the evolved species enriched with lighter isotope (12C) and the remaining substrate enriched in13C due to kinetic isotope effects (KIE; Hoefs, 1997; Rudolph et al., 2002).
A 72 h backward trajectory analysis showed that air masses that moved to Beijing during the whole sampling pe-riod can roughly be categorized into three types (Fig. 6a; all trajectories during the entire study period can be found in the Supplement). (1) Polluted type, by which air masses origi-nated inland and east coastal China and moved slowly into Beijing within 72 h from its southern regions, i.e., Henan, Shandong, and Jiangsu provinces. This type of air mass mostly occurred before APEC with high PM2.5
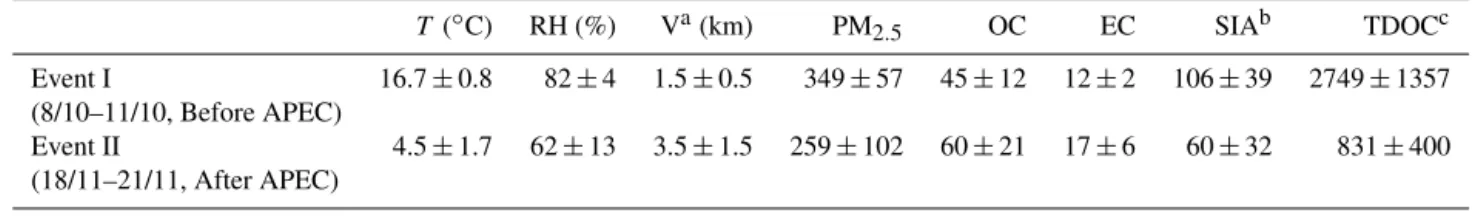
Table 4.Meteorological parameters and chemical compositions (µg m−3)of two maximum PM
2.5between two pollution episodes in Beijing.
T (◦C) RH (%) Va(km) PM2.5 OC EC SIAb TDOCc
Event I 16.7±0.8 82±4 1.5±0.5 349±57 45±12 12±2 106±39 2749±1357 (8/10–11/10, Before APEC)
Event II 4.5±1.7 62±13 3.5±1.5 259±102 60±21 17±6 60±32 831±400 (18/11–21/11, After APEC)
aV: visibility.bSIA: secondary inorganic aerosols (the sum of sulfate, nitrate, and ammonium).cTDOC: total detected organic compounds.
Figure 6. (a)72 h backward trajectories determined by the National
Oceanic and Atmospheric Administration Hybrid Single Particle Lagrangian Integrated Trajectory (HYSPLIT) model arriving at the sampling site to reveal the major air-mass flow types during the study period. Northwesterly wind (light blue) was most frequent (64 %), followed by northerly (21 %, pink) and southerly (15 %, black), and these are defined as clean, mixed, and polluted types, respectively (see the definitions in the text and the trajectories with a 6 h interval in the Supplement);(b)time series ofδ13C values and concentration of oxalic acid during the whole study period (colors in Fig. 6a are corresponding to those in Fig. 6b).
more aged, while those from the mixed type of air masses are fresh. Since severe air pollution is widespread in the southern regions, gas-to-aerosol phase partitioning of precursors and subsequent aerosol-phase oxidation to produce SOA includ-ing C2continuously proceed during the air-mass movement.
However, such a partition for producing SOA is not signif-icant when air masses move from Siberia, Mongolia, and
northern China because of the much less abundant VOCs. Instead, aerosols in the clean air masses are continuously ox-idized, during which C2 is produced by photochemical
de-composition of larger molecular weight precursors. There-fore, C2in PM2.5transported by the mixed type air masses is
not only fresh and abundant but also enriched in12C, whereas C2in PM2.5transported by the clean type air masses is aged,
less abundant, and enriched in13C due to KIE effects, as
il-lustrated by the pink and light blue columns in Fig. 6b, re-spectively. C2in PM2.5 transported by the polluted type of
air mass is most abundant compared with that in other two types of air mass, which is not only due to the severe air pollution in the Henan, Shandong, and Jiangsu provinces but also due to the enhanced photochemical oxidation under the humid, higher temperature and stagnant conditions that oc-curred mostly before APEC, as discussed previously. There-fore, C2in the polluted type of air masses is not only
abun-dant but also enriched in13C (see black columns in Fig. 6b).
3.4 Different chemical characteristics of PM2.5
between two severe haze events
From Fig. 1 and Table 4, it can be found that PM2.5showed
two equivalent maxima on 9 October and 20 November dur-ing the whole study period. However, the chemical compo-sitions of PM2.5 during these two pollution events are
sig-nificantly different. As shown in Fig. 7a, relative abundances of SIA (sum of SO2−
4 , NO
−
3, and NH
+
4)to PM2.5are 30 %
during event I and 23 % during event II. The relative abun-dance of OM (21 %, Fig. 7a) during event I is lower than that (37 %) during event II (Fig. 7b). In contrast, the ratios of WSOC/OC and TDOC/OC are higher in event I than in event II, which is consistent with lower levels of O3
af-ter APEC (Table 1), suggesting a weaker photochemical ox-idation capacity during event II. Organic biomarkers in the PM2.5samples have been measured for the source
apportion-ment (Wang et al., 2016a) and cited here to further identify the difference in chemical composition of PM2.5 between
the two events. Levoglucosan is a key tracer for biomass burning smoke. The mass ratio of levoglucosan to OC in PM2.5 (Lev/OC) is comparable between the two events,
suggesting a similar level of contributions of biomass burn-ing emission to PM2.5before and after APEC. However, the
Figure 7. Comparison of chemical composition of PM2.5 during two air pollution events. (a)Percentages of major species in PM2.5;
(b, c)mass ratios of major species and organic tracers in PM2.5;(d)stable carbon isotope composition of oxalic acid (C2)(data about
levoglucosan (Lev), PAHs, and hopanes are cited from Wang et al., 2016a).
hopanes to OC are lower in event I than those in event II (Fig. 7c), which again demonstrates the enhanced emissions from coal burning for house heating, because these com-pounds are key tracers of coal burning smokes (Wang et al., 2006). As seen in Fig. 7d, C2 in event I was enriched in 13C. Such relatively more abundant SIA, WSOC, and TDOC
and heavier C2in PM2.5clearly demonstrate that PM2.5
dur-ing event I is enriched with secondary products while the fine particles during event II are enriched with primary com-pounds. After-APEC house heating activities including res-idential coal burning were activated, which emitted huge amounts of SO2, NOx, and VOCs as well as primary par-ticles, resulting in both absolute concentrations and relative abundances of CO and EC 30–40 % higher after APEC than before APEC (see Table 1). Li et al. (2015) reported that VOCs in Beijing were 86 ppbv before APEC, 48 ppbv dur-ing APEC, and 73 ppbv after APEC. As shown in Table 4, temperature (16.7±0.8◦C for event I and 4.5±1.7◦C for
event II) and relative humidity (RH; 82±4 for event I and
62±13 % for event II) are lower during event II than
dur-ing event I. Moreover, air masses arrivdur-ing in Beijdur-ing durdur-ing event II are the mixed type, of which the resident time in Hebei province is short. Compared with those in event I, such colder and drier conditions and a short reaction time during event II are unfavorable for photochemical oxidation, result-ing in SOA not only less abundant but also enriched with
lighter12C during event II, although VOC levels are
compa-rable before and after APEC.
4 Summary and conclusion
Temporal variations in molecular distribution of SIA, dicar-boxylic acids, ketoacids,α-dicarbonyl, and stable carbon iso-topic composition (δ13C) of C2in PM2.5collected in Beijing
before, during and after the 2014 APEC were investigated. Absolute concentrations and relative abundances of SIA and C2in PM2.5are highest before APEC, followed by those
af-ter and during APEC, suggesting that the fine aerosols before APEC are enriched with secondary products, mainly due to an enhanced photochemical oxidation under the warm, hu-mid and stagnant conditions. Concentrations of SIA, oxalic acid and related SOA in PM2.5during APEC are 2–4 times
lower than those before APEC, which can be ascribed to the effective emission controls and the favorable meteorological conditions that brought clean air from Siberia and Mongolia into Beijing.
Positive correlations of C2with sulfate mass, RH, ALWC,
and aerosol acidity indicate that the C2formation pathway is
involved in acid-catalyzed aerosol aqueous phase oxidation. SIA, C2, and related SOA in the polluted types of air mass are
abundant with C2enriched in13C. On the contrary, those in
C2is also enriched in13C. By comparing the chemical
com-position of PM2.5andδ13C values of C2 in two events that
are characterized by the highest loadings of PM2.5before and
after APEC, we further found that compared with those be-fore APEC fine aerosols after APEC are enriched with pri-mary species and C2 is depleted in heavier 13C, although
SO2, NOx, and VOCs are abundant during the heating sea-son, again demonstrating the important role of meteorolog-ical conditions in the secondary aerosol formation process, which are warmer, humid, and stagnant before APEC and result in secondary species being much more abundant than those during and after APEC.
The Supplement related to this article is available online at doi:10.5194/acp-17-981-2017-supplement.
Acknowledgement. This work was financially supported by the Strategic Priority Research Program of the Chinese Academy of Sciences (grant no. XDB05020401), the China National Natural Science Founds for Distinguished Young Scholars (grant no. 41325014), and the program from the National Nature Science Foundation of China (no. 41405122, 91544226 and 41375132).
Edited by: R. Zhang
Reviewed by: three anonymous referees
References
Beijing Municipal Bureau of Statistics: available at: http://www.bjstats.gov.cn/tjsj/yjdsj/rk/2014/201511/t20151124_ 323864.html, 2015.
Bikkina, S., Kawamura, K., and Miyazaki, Y.: Latitudinal distri-butions of atmospheric dicarboxylic acids, oxocarboxylic acids, andα-dicarbonyls over the western North Pacific: Sources and formation pathways, J. Geophys. Res.-Atmos., 120, 5010–5035, doi:10.1002/2014jd022235, 2015.
Carlton, A. G., Turpin, B. J., Lim, H.-J., Altieri, K. E., and Seitzinger, S.: Link between isoprene and secondary organic aerosol (SOA): Pyruvic acid oxidation yields low volatility organic acids in clouds, Geophys. Res. Lett., 33, L06822, doi:10.1029/2005gl025374, 2006.
Carlton, A. G., Turpin, B. J., Altieri, K. E., Seitzinger, S., Reff, A., Lim, H.-J., and Ervens, B.: Atmospheric oxalic acid and SOA production from glyoxal: Results of aqueous photooxidation experiments, Atmos. Environ., 41, 7588–7602, doi:10.1016/j.atmosenv.2007.05.035, 2007.
Carlton, A. G., Wiedinmyer, C., and Kroll, J. H.: A review of Sec-ondary Organic Aerosol (SOA) formation from isoprene, At-mos. Chem. Phys., 9, 4987–5005, doi:10.5194/acp-9-4987-2009, 2009.
Cheng, C., Wang, G., Meng, J., Wang, Q., Cao, J., Li, J., and Wang, J.: Size-resolved airborne particulate oxalic and re-lated secondary organic aerosol species in the urban
atmo-sphere of Chengdu, China, Atmos. Res., 161–162, 134–142, doi:10.1016/j.atmosres.2015.04.010, 2015.
Chow, J. C., Watson, J. G., Chen, L.-W. A., Chang, M. O., Robin-son, N. F., Trimble, D., and Kohl, S.: The IMPROVE_A tem-perature protocol for thermal/optical carbon analysis: maintain-ing consistency with a long-term database, J. Air Waste Manage. Assoc., 57, 1014–1023, 2007.
Ervens, B., Feingold, G., Frost, G. J., and Kreidenweis, S. M.: A modeling study of aqueous production of dicar-boxylic acids: 1. Chemical pathways and speciated organic mass production, J. Geophys. Res.-Atmos., 109, D15206, doi:10.1029/2003JD004387, 2004.
Ervens, B., Turpin, B. J., and Weber, R. J.: Secondary or-ganic aerosol formation in cloud droplets and aqueous parti-cles (aqSOA): a review of laboratory, field and model stud-ies, Atmos. Chem. Phys., 11, 11069–11102, doi:10.5194/acp-11-11069-2011, 2011.
Fu, T.-M., Jacob, D. J., Wittrock, F., Burrows, J. P., Vrekous-sis, M., and Henze, D. K.: Global budgets of atmospheric glyoxal and methylglyoxal, and implications for formation of secondary organic aerosols, J. Geophys. Res., 113, D15303, doi:10.1029/2007jd009505, 2008.
Gensch, I., Kiendler-Scharr, A., and Rudolph, J.: Isotope ratio stud-ies of atmospheric organic compounds: Principles, methods, ap-plications and potential, Int. J. Mass Spectrom., 365–366, 206– 221, doi:10.1016/j.ijms.2014.02.004, 2014.
Guo, S., Hu, M., Zamora, M. L., Peng, J., Shang, D., Zheng, J., Du, Z., Wu, Z., Shao, M., Zeng, L., Molina, M. J., and Zhang, R.: Elu-cidating severe urban haze formation in China, P. Natl. Acad. Sci. USA, 111, 17373–17378, doi:10.1073/pnas.1419604111, 2014. Hennigan, C. J., Izumi, J., Sullivan, A. P., Weber, R. J., and Nenes,
A.: A critical evaluation of proxy methods used to estimate the acidity of atmospheric particles, Atmos. Chem. Phys., 15, 2775– 2790, doi:10.5194/acp-15-2775-2015, 2015.
Ho, K. F., Cao, J. J., Lee, S. C., Kawamura, K., Zhang, R. J., Chow, J. C., and Watson, J. G.: Dicarboxylic acids, ketocarboxylic acids, and dicarbonyls in the urban atmosphere of China, J. Geo-phys. Res., 112, D22S27, doi:10.1029/2006jd008011, 2007. Ho, K. F., Lee, S. C., Ho, S. S. H., Kawamura, K., Tachibana,
E., Cheng, Y., and Zhu, T.: Dicarboxylic acids, ketocarboxylic acids,α-dicarbonyls, fatty acids, and benzoic acid in urban aerosols collected during the 2006 Campaign of Air Quality Re-search in Beijing (CAREBeijing-2006), J. Geophys. Res., 115, D19312, doi:10.1029/2009jd013304, 2010.
Ho, K. F., Huang, R.-J., Kawamura, K., Tachibana, E., Lee, S. C., Ho, S. S. H., Zhu, T., and Tian, L.: Dicarboxylic acids, keto-carboxylic acids,α-dicarbonyls, fatty acids and benzoic acid in PM2.5aerosol collected during CAREBeijing-2007: an effect of
traffic restriction on air quality, Atmos. Chem. Phys., 15, 3111– 3123, doi:10.5194/acp-15-3111-2015, 2015.
Kawamura, K. and Watanabe, T.: Determination of stable car-bon isotopic compositions of low molecular weight dicarboxylic acids and ketocarboxylic acids in atmospheric aerosol and snow samples, Anal. Chem., 76, 5762–5768, 2004.
Kawamura, K. and Bikkina, S.: A review of dicarboxylic acids and related compounds in atmospheric aerosols: Molecular distribu-tions, sources and transformation, Atmos. Res., 170, 140–160, doi:10.1016/j.atmosres.2015.11.018, 2016.
Kirillova, E. N., Andersson, A., Sheesley, R. J., Kruså, M., Praveen, P. S., Budhavant, K., Safai, P. D., Rao, P. S. P., and Gustafsson, Ö.: 13C- and14C-based study of sources and atmo-spheric processing of water-soluble organic carbon (WSOC) in South Asian aerosols, J. Geophys. Res.-Atmos., 118, 614–626, doi:10.1002/jgrd.50130, 2013.
Laskin, A., Laskin, J., and Nizkorodov, S. A.: Chemistry of Atmospheric Brown Carbon, Chem. Rev., 115, 4335–4382, doi:10.1021/cr5006167, 2015.
Li, J., Xie, S. D., Zeng, L. M., Li, L. Y., Li, Y. Q., and Wu, R. R.: Characterization of ambient volatile organic compounds and their sources in Beijing, before, during, and after Asia-Pacific Economic Cooperation China 2014, Atmos. Chem. Phys., 15, 7945–7959, doi:10.5194/acp-15-7945-2015, 2015.
Li, W. and Shao, L.: Mixing and water-soluble characteristics of particulate organic compounds in individual urban aerosol parti-cles, J. Geophys. Res., 115, D02301, doi:10.1029/2009jd012575, 2010.
Li, W., Zhou, S., Wang, X., Xu, Z., Yuan, C., Yu, Y., Zhang, Q., and Wang, W.: Integrated evaluation of aerosols from re-gional brown hazes over northern China in winter: Concentra-tions, sources, transformation, and mixing states, J. Geophys. Res., 116, D09301, doi:10.1029/2010jd015099, 2011.
Ma, Y., Brooks, S. D., Vidaurre, G., Khalizov, A. F., Wang, L., and Zhang, R.: Rapid modification of cloud-nucleating ability of aerosols by biogenic emissions, Geophys. Res. Lett., 40, 6293– 6297, doi:10.1002/2013gl057895, 2013.
Meng, J., Wang, G., Li, J., Cheng, C., Ren, Y., Huang, Y., Cheng, Y., Cao, J., and Zhang, T.: Seasonal characteristics of oxalic acid and related SOA in the free troposphere of Mt. Hua, central China: implications for sources and formation mechanisms, Sci. Total Environ., 493, 1088–1097, doi:10.1016/j.scitotenv.2014.04.086, 2014.
Mu, Q. and Zhang, S.: An evaluation of the economic loss due to the heavy haze during January 2013 in China, China Environmental Science, 33, 2087–2094, 2013.
Myriokefalitakis, S., Tsigaridis, K., Mihalopoulos, N., Sciare, J., Nenes, A., Kawamura, K., Segers, A., and Kanakidou, M.: In-cloud oxalate formation in the global troposphere: a 3-D model-ing study, Atmos. Chem. Phys., 11, 5761–5782, doi:10.5194/acp-11-5761-2011, 2011.
Peng, J., Hu, M., Guo, S., Du, Z., Zheng, J., Shang, D., Zamora, M. L., Zeng, L., Shao, M., and Wu, Y.-S.: Markedly enhanced ab-sorption and direct radiative forcing of black carbon under pol-luted urban environments, P. Natl. Acad. Sci USA, 113, 4266– 4271, 2016.
Rudolph, J., Czuba, E., Norman, A., Huang, L., and Ernst, D.: Sta-ble carbon isotope composition of nonmethane hydrocarbons in emissions from transportation related sources and atmospheric observations in an urban atmosphere, Atmos. Environ., 36, 1173– 1181, 2002.
Sorooshian, A., Lu, M.-L., Brechtel, F. J., Jonsson, H., Feingold, G., Flagan, R. C., and Seinfeld, J. H.: On the Source of Organic Acid Aerosol Layers above Clouds, Environ. Sci. Technol., 41, 4647–4654, doi:10.1021/es0630442, 2007.
Strader, R., Lurmann, F., and Pandis, S. N.: Evaluation of secondary organic aerosol formation in winter, Atmos. Environ., 33, 4849– 4863, 1999.
Sullivan, R. C. and Prather, K. A.: Investigations of the Diurnal Cy-cle and Mixing State of Oxalic Acid in Individual PartiCy-cles in Asian Aerosol Outflow, Environ. Sci. Technol., 41, 8062–8069, doi:10.1021/es071134g, 2007.
Sun, Y., Wang, Z., Wild, O., Xu, W., Chen, C., Fu, P., Du, W., Zhou, L., Zhang, Q., Han, T., Wang, Q., Pan, X., Zheng, H., Li, J., Guo, X., Liu, J., and Worsnop, D. R.: “APEC Blue”: Sec-ondary Aerosol Reductions from Emission Controls in Beijing, Sci. Rep., 6, 20668, doi:10.1038/srep20668, 2016.
Surratt, J. D., Lewandowski, M., Offenberg, J. H., Jaoui, M., Klein-dienst, T. E., Edney, E. O., and Seinfeld, J. H.: Effect of acidity on secondary organic aerosol formation from isoprene, Environ. Sci. Technol., 41, 5363–5369, 2007.
Surratt, J. D., Chan, A. W., Eddingsaas, N. C., Chan, M., Loza, C. L., Kwan, A. J., Hersey, S. P., Flagan, R. C., Wennberg, P. O., and Seinfeld, J. H.: Reactive intermediates revealed in secondary organic aerosol formation from isoprene, P. Natl. Acad. Sci USA, 107, 6640–6645, 2010.
Tang, G., Zhu, X., Hu, B., Xin, J., Wang, L., Münkel, C., Mao, G., and Wang, Y.: Impact of emission controls on air qual-ity in Beijing during APEC 2014: lidar ceilometer observa-tions, Atmos. Chem. Phys., 15, 12667–12680, doi:10.5194/acp-15-12667-2015, 2015.
Tilgner, A. and Herrmann, H.: Radical-driven carbonyl-to-acid con-version and acid degradation in tropospheric aqueous systems studied by CAPRAM, Atmos. Environ., 44, 5415–5422, 2010. van Donkelaar, A., Martin, R. V., Brauer, M., Kahn, R., Levy, R.,
Verduzco, C., and Villeneuve, P. J.: Global Estimates of Ambi-ent Fine Particulate Matter ConcAmbi-entrations from Satellite-Based Aerosol Optical Depth: Development and Application, Environ. Health Persp., 118, 847–855, 10.1289/ehp.0901623, 2010. van Pinxteren, D., Neusüß, C., and Herrmann, H.: On the
abun-dance and source contributions of dicarboxylic acids in size-resolved aerosol particles at continental sites in central Europe, Atmos. Chem. Phys., 14, 3913–3928, doi:10.5194/acp-14-3913-2014, 2014.
Wang, G., Niu, S., Liu, C., and Wang, L.: Identification of dicar-boxylic acids and aldehydes of PM10 and PM2.5 aerosols in Nanjing, China, Atmos. Environ., 36, 1941–1950, 2002. Wang, G., Kawamura, K., Lee, S., Ho, K., and Cao, J.:
Molecu-lar, seasonal, and spatial distributions of organic aerosols from fourteen Chinese cities, Environ. Sci. Technol., 40, 4619–4625, 2006.
Wang, G., Kawamura, K., Umemoto, N., Xie, M., Hu, S., and Wang, Z.: Water-soluble organic compounds in PM2.5 and size-segregated aerosols over Mount Tai in North China Plain, J. Geo-phys. Res., 114, D19208, doi:10.1029/2008jd011390, 2009. Wang, G., Xie, M., Hu, S., Gao, S., Tachibana, E., and Kawamura,
forma-tion, Atmos. Chem. Phys., 10, 6087–6096, doi:10.5194/acp-10-6087-2010, 2010.
Wang, G., Kawamura, K., Cheng, C., Li, J., Cao, J., Zhang, R., Zhang, T., Liu, S., and Zhao, Z.: Molecular distribution and stable carbon isotopic composition of dicarboxylic acids, keto-carboxylic acids, and alpha-dicarbonyls in size-resolved atmo-spheric particles from Xi’an City, China, Environ. Sci. Technol., 46, 4783–4791, doi:10.1021/es204322c, 2012.
Wang, G., Cheng, C., Meng, J., Huang, Y., Li, J., and Ren, Y.: Field observation on secondary organic aerosols during Asian dust storm periods: Formation mechanism of oxalic acid and re-lated compounds on dust surface, Atmos. Environ., 113, 169– 176, doi:10.1016/j.atmosenv.2015.05.013, 2015.
Wang, G., Wang, J., Ren, Y., and Li, J.: Chemical characterization of organic aerosols from Beijing during the 2014 APEC, Atmos. Res., in preparation, 2016a.
Wang, G., Zhang, R., Gomez, M. E., Yang, L., Levy Zamora, M., Hu, M., Lin, Y., Peng, J., Guo, S., Meng, J., Li, J., Cheng, C., Hu, T., Ren, Y., Wang, Y., Gao, J., Cao, J., An, Z., Zhou, W., Li, G., Wang, J., Tian, P., Marrero-Ortiz, W., Secrest, J., Du, Z., Zheng, J., Shang, D., Zeng, L., Shao, M., Wang, W., Huang, Y., Wang, Y., Zhu, Y., Li, Y., Hu, J., Pan, B., Cai, L., Cheng, Y., Ji, Y., Zhang, F., Rosenfeld, D., Liss, P. S., Duce, R. A., Kolb, C. E., and Molina, M. J.: Persistent sulfate formation from London Fog to Chinese haze, P. Natl. Acad. Sci USA, 113, 13630–13635, doi:10.1073/pnas.1616540113, 2016b.
Wang, Z., Li, Y., Chen, T., Li, L., Liu, B., Zhang, D., Sun, F., Wei, Q., Jiang, L., and Pan, L.: Changes in atmospheric composition during the 2014 APEC conference in Beijing, J. Geophys. Res.-Atmos., 120, 12695–12707, doi:10.1002/2015JD023652, 2015. Weber, R. J., Guo, H., Russell, A. G., and Nenes, A.: High
aerosol acidity despite declining atmospheric sulfate concen-trations over the past 15 years, Nat. Geosci., 9, 282–285, doi:10.1038/ngeo2665, 2016.
Wei, X., Gu, X., Chen, H., Cheng, T., Wang, Y., Guo, H., Bao, F., and Xiang, K.: Multi-Scale Observations of Atmosphere Envi-ronment and Aerosol Properties over North China during APEC Meeting Periods, Atmosphere, 7, 4, doi:10.3390/atmos7010004, 2016.
Xing, L., Fu, T.-M., Cao, J. J., Lee, S. C., Wang, G. H., Ho, K. F., Cheng, M.-C., You, C.-F., and Wang, T. J.: Seasonal and spa-tial variability of the OM/OC mass ratios and high regional cor-relation between oxalic acid and zinc in Chinese urban organic aerosols, Atmos. Chem. Phys., 13, 4307–4318, doi:10.5194/acp-13-4307-2013, 2013.
Xu, W. Q., Sun, Y. L., Chen, C., Du, W., Han, T. T., Wang, Q. Q., Fu, P. Q., Wang, Z. F., Zhao, X. J., Zhou, L. B., Ji, D. S., Wang, P. C., and Worsnop, D. R.: Aerosol composition, oxidation prop-erties, and sources in Beijing: results from the 2014 Asia-Pacific Economic Cooperation summit study, Atmos. Chem. Phys., 15, 13681–13698, doi:10.5194/acp-15-13681-2015, 2015.
Xue, H., Khalizov, A. F., Wang, L., Zheng, J., and Zhang, R.: Ef-fects of coating of dicarboxylic acids on the mass- mobility rela-tionship of soot particles, Environ. Sci. Technol., 43, 2787–2792, 2009.
Yu, J. Z., Huang, X.-F., Xu, J., and Hu, M.: When Aerosol Sul-fate Goes Up, So Does Oxalate? Implication for the Formation Mechanisms of Oxalate, Environ. Sci. Technol., 39, 128–133, doi:10.1021/es049559f, 2005.
Zhang, R., Suh, I., Zhao, J., Zhang, D., Fortner, E. C., Tie, X., Molina, L. T., and Molina, M. J.: Atmospheric new particle for-mation enhanced by organic acids, Science, 304, 1487–1490, doi:10.1126/science.1095139, 2004.
Zhang, Q., Jimenez, J. L., Worsnop, D. R., and Canagaratna, M.: A case study of urban particle acidity and its influence on secondary organic aerosol, Environ. Sci. Technol., 41, 3213–3219, 2007. Zhang, R., Khalizov, A., Wang, L., Hu, M., and Xu, W.: Nucleation
and growth of nanoparticles in the atmosphere, Chem. Rev., 112, 1957–2011, doi:10.1021/cr2001756, 2012.
Zhang, R., Wang, G., Guo, S., Zamora, M. L., Ying, Q., Lin, Y., Wang, W., Hu, M., and Wang, Y.: Formation of ur-ban fine particulate matter, Chem. Rev., 115, 3803–3855, doi:10.1021/acs.chemrev.5b00067, 2015.