Effectiveness of CDS regulation:
An Insight Into the Cyprus and Greek Crisis
Trabalho Final na modalidade de Dissertação apresentado à Universidade Católica Portuguesa
para obtenção do grau de mestre em Finanças
por
Nuno João Sampaio de Carvalho
sob orientação de
Professor Doutor Carlos Santos
Faculdade de Economia e Gestão Setembro 2015
iii
Acknolegments
This Masters dissertation it was only possible due to importante incentives and support, whithou which it would not be possible to conclude, and to whom i will be always gratefull.
To Professor Carlos Santos for his orientation, total support, availability, for transmitting his knowledge and total cooperation in solving problems during all the relization of this dissertation and for all the incentives.
To Universidade Católica do Porto and to all his teachers for providing me facilities, material, knowledge and informatic instruments whithout which, this dissertation would not be possible.
To my girfriend for all the support during this phase, for the incentive and encouraging words and for all the strengh in difficult times.
To my friends for all the courage, for their friendship and support.
To my parens and my brother a special thanks, for all the unconditional support, for believing, for the total cooperation and for being a modelo of courage and perseverance.
To the resto of my family for all the support and encoraging words.
At last, i would like to thank to all that directly or undirecty contributed to the realization of this dissertation.
v
Resumo
Esta dissertação realiza-se no âmbito de tentar averiguar se as mais recents regulamentações relativas ao mercado de CDS surtiram algum efeito na regularização deste. Mais especificamente, são estudadas as medidas da inclusão do bail-in como medida de qualidade de crédito na ISDA 2014 e a proibição de transações de CDS sem qualquer cobertura ao risco. Devido ao elevado crescimento do mercado CDS, torna-se imperativo que as autoridades competentes tomem medidas de forma a controlar um mercado em ascensão e com um impacto cada vez maior. No entanto não existe ainda quaisquer provas conclusivas que nos levem a crer que as medidas recentmente tomadas tenham sido a melhor solução para o problema, existindo inclusive indícios que tais medidas poderão exercer precisamente o efeito contrário ao pretendido. Os resultados aqui analisados mostram precisamente que tais medidas não conseguiram controlar o comportamento explosivo dos spreads dos CDS, sendo assim necessário rever as medidas usadas e planear novas medidas, para que exista um controlo de mercado de maneira mais eficaz.
Palavras chave: CDS, SCDS, Bail-in, Cyprus Crisis, Greek Debt Crisis, ISDA 2014.
vii
Abstract
This dissertation is realized in the context of understanding if recent measures taken by European authorities relative to the CDS market were effective. More specifically this paper study the bail-in inclusion on ISDA 2014 as a credit quality event and the ban of uncovered CDS. Due to CDS market rapidly growth, it becomes imperative that competent authorities take actions with the view to control this ascending market. Nevertheless there are no conclusive evidences that support the idea that the recent measures were the best solution to the problem, having in counterpart suspicious that such measures could exert the contrary effect. The analysed results precisely suggest that those measures ere not able to control the CDS spreads explosive behavior, showing that it requires new measure planning in order to obtain a more efficiente market control to stabilize the market.
Index
Appendix………...………...56 Acknolegments ...iii Resumo ... v Abstract... vii Index ... ix Pictures Index ... xiTables Index ... xiii
Introduction ... 15
Chapter 1 Greek Debt Crises, ISDA 2014 and Uncovered CDS ... 20
1. Title: Literature Review ... 20
1.1 Subtitle: The increasing importance of the CDS market ... 20
1.2 Subtitle: Why and which measures were taken to control the market? ... 25
2. Title: Methodology and Results ... 31
2.1 Subtitle: The data ... 31
2.2 Subtitle: Methodology ... 32
2.3 Subtitle:Results ... 36
Chapter 2 Gyprus Bail-in Episode ... 43
2.1 Subtitle: Cyprus Historical View ... 43
2.2 Subtitle: Cyprus CDS Evolution: ... 45
Conclusion ... 52
xi
Pictures Index
Chapter 1
Greek Debt Crisis, ISDA 2014 and Uncovered CDS ... 20
2.3 Subtitle:Results ... 36 Picture 1:CR14 upfronts ... 40 Picture 2:CR14 spreads ... 41 Picture 3: CR upfronts ... 41 Picture 4: CR spreads. ... 42 Chapter 2 Gyprus Bail-in Episode ... 43
2.2 Subtitle: Cyprus CDS Evolution: ... 45
Picture 5: Top 10 riskier Sovereigns (CDS spreads in bps) in the last quarter of 2012 ... 51
Picture 6: Top 10 riskier Sovereigns (CDS spreads in bps) in the 2nd quarter of 2013 ... 51
Appendix Picture 7: CDS spreads for several countries during the 3rd quarter of 2013 ... 58
Picture 8: CDS spreads for several countries during the 4th quarter of 2013 .. 58
Picture 9: CDS spreads for Cyprus and Greece during the 1st quarter of 2014 58 Picture 10: CDS spreads for several countries during the 2nd quarter of 2014 59 Picture 11: CDS spreads for Cyprus, Portugal and Greece during the 3rd quarter of 2014 ... 59
xiii
Tables Index
Chapter 1
Greek Debt Crisis, ISDA 2014 and Uncovered CDS ... 20
2.3 Subtitle:Results ... 36
Table 5: Summary statistics of Greek SCDS spreads and upfronts under both legislations. ... 42
Chapter 2 Gyprus Bail-in Episode ... 43
2.2 Subtitle: Cyprus CDS Evolution: ... 45
Table 6: Cyprus CPD and CDS spreads for quarters between 2012 and 2014 50 Table 7: Top 10 countries with higher risk in the last quarter of 2012 and in the 2nd quarter of 2013 ... 50
Appendix Table 1: right tail ADF test for CR14 upfronts ... 56
Table 2: right tail ADF test for CR14 spreads ... 56
Table 3: right tail ADF test for CR upfronts ... 57
15
Introduction
CDS are a derivative credit insurance concerning a reference entity. Moreover, CDS is a transaction where the buyer agrees to pay to the seller periodic amounts, agreed in the beginning of the contract, during the life of the agreement or until a certain event occur. The spread is a measure of probability of failure throw the reference entity and its’ connected with credit ratings, and the higher the spread, the higher the amount to be paid. In turn, the seller makes no payments unless a credit event related to the reference entity occurs, in which the settlement obligation is triggered. These credit events are defined by the International Swaps and Derivatives Association (ISDA). According to its 2003 definitions, the class of qualifying credit events was composed by bankruptcy, failure to pay, obligation default or acceleration, repudiation and restructuring. In September 2014, credit event definitions were extended to include government-initiated bail-ins for a financial sector reference entity. But opposite to other insurance derivatives, the buyer did not need to be exposure to the risky entity until 2011, when the European Parliament banishes the transactions of uncovered CDS. Investors use CDS mostly to transfer risk to the CDS sellers, improving the credit quality of their own portfolios.
Since a first usage by J.P. Morgan, and despite of the their 20 years of existence, Credit Default Swaps since the onset of 2007 crisis, have experienced a rapidly increasing and its becoming an important tool, not only as an hedging instrument, but also as a speculative one. Due to all that, several attempts to
regulate the market have been made, subjecting the market to several constraints, especially after the Euro Area debt crisis. This increase, show the importance of this type of derivative, especially in periods of economic stress.
Several studies have been conducted to understand the increasing importance of the CDS market, its role on the onset and growth of financial crisis and how it interacts with the bond market in the price discovery process, in order to sense who the leading market is. Conclusions show that CDS market is usually the leader in stress markets or in periods of stress, and incorporates information more rapidly, although it still remains some doubts about it, once results are not conclusive. But the fact that CDS has increasing its importance, and it exerts a huge influence in the Market can’t be denied.
Before the financial crisis CDS contracts consist mostly in emerging economies, since investors view those economies with higher risk, once more valuable credit risk. However, after 2008 crisis, the increasing risks lead to a necessity to more hedging tools, which boosted the CDS market, viewed as an important indicator of credit risk. Due to all these events and as a consequence of the sharp increase in CDS markets, suspicious about the use of this type of derivatives as speculation was raised. So, regulatory entities stat to have concerns regarding the yield manipulation throw the use of CDS contracts, due to the fact that short selling can push sovereign prices into a spiral in extreme market conditions, and as a consequence leading to a stressful markets and to a raise in the issuance cost of underlying sovereigns. Such concerns had led to some attempts to standardize the CDS market by European authorities in order to control the speculative use. Several attempts of standardization were made, being one of the most important and severe the ban of the «naked» CDS as well as the inclusion of the bail-in as a qualifying credit event in ISDA 2014. But, despite existing some signs of overshooting in CDS predicted value in periods of distress on the most vulnerable economies there is no conclusive evidence
17
that such overshooting can cause higher sovereign funding costs. In fact CDS tends to react to new information more rapidly than the underlying market, providing in that way a useful hedge and enhance financial stability. Indeed such measures can have the opposite effect and reduce the market liquidity to a point in which its effect as a hedging instrument can be affected. Moreover, the rules concerning the ban of CDS are not precise, since the percentage amount of risk exposure is according to the writer opinion, making it possible for the buyer to have contracts without any exposure to the reference entity. Since CDS has become such important tool that can enhance or even onset financial crisis, it is mandatory to have precise rules and to understand if the existing rules can in a precise way stabilize the market and end up speculative behavior and a as a consequence end up the exuberance behavior, leading to a more stable economy. It is with this view that this paper was made, in order to assess if the previous measures taken by European authorities had contributed in a significant way to stability, or if it is necessary to come up with different ideas to regulate the market in a better way.
In order to study the ban of the uncovered CDS and to compare the influence of the new ISDA 2014 in the CDS market, 5-year SCDS spreads and upfronts for the period between 22/09/2014 and 13/3/2015 were taken from the source Markit. The methodology used in this paper was a General SADF test statistic considering a backward strategy proposed by Phillips, Shin and Wu (2015) that allows testing for explosive behavior for the data of the sample. A Matlab existing code was used to implement the previous procedure, simulating the critical values for each particular problem. Results here show that the ban of «naked CDS» didn’t have the desired effect and could not control the yield manipulation by investors and as a consequence the explosive behavior persists in a similar way before the ban. This comes to show that new measures are needed to do control the market in a more precise way.
The inclusion of government-initiated bail-ins in the credit event definitions provides protection for bank bond holders, attempting to mitigate such flights, and is the most recent of several regulatory adjustments CDSs have suffered in recent years. So, in order to have a better understanding on how the inclusion of the bail-in as a qualified credit event on ISDA 2014 a study about the Cyprus bail-in situation was made, since it was the first time such measure was put into practice, and one of the biggest episodes of regulation. First is given a brief historical explanation, stating the events that lead to the need of the bail-in, and in a second part is given the evolution of the CDS spreads of Cyprus before and after the bail-in. The CDS spreads were taken from Standard & Poor’s quarterly reports since 2012 until 2014 in order to contain the bail-in episode. Overall, and despite being still inconclusive, results suggest that the bail-in had a positive effect in a long term despite CDS spreads still remain high. Despite all that, bail-in bail-introduces uncertabail-inty, and as a consequence the variance of the CDS spreads increased as well during the period before the bail-in. This comes to show that the inclusion in the ISDA 2014 may lead to an opposite results, being still uncertain its consequences.
The following paper is divided in 5 parts as follow: In the first chapter there is a literature review relative to both chapters, where is described the increasing importance of the CDS market, why it as increased throw the recent years, and which and why there is the necessity of new measures to control the CDS market. Next there is an explanation on the data and methodology used and a results analysis. In a second chapter is analysed the Cyprus bail-in episode, where first its presented the historical reasons that lead to the necessity of a bail-in and then is analysed the evolution of the CDS market during those events. At last a conclusion on the results analysed in this dissertation is presented.
Chapter 1
Greek Debt Crisis, ISDA 2014 and Uncovered
CDS
1. Title: Literature Review
In light of the Global Financial Crisis, some studies aim to explain the determinants of the sovereign risk, focusing in macroeconomic fundamentals or in specific risks. Recent crisis has raised concerns regarding the role of CDS, and since 2008 sovereign debt crisis, the importance of the CDS has increases due to a bigger risk faced by investors, once before that the risk faced was smaller and as a consequence there were few incentives to trade this type of derivative. Taking this into account several authors conducted studies in order to assess the role and importance of CDS in the Global Market, and its influence during crisis. These studies aim to perceive how the CDS market interacts with the Bond market, inorder to sense which one of these is the leading market in the price discovery processand what is its influence on the onset and crisis growth.
1.1 Subtitle: The increasing importance of the CDS market
Several authors have tried to prove and explain the increasing influence of the CDS market. However the net standing amounts of CDS relative to the underlying assets is really small, and due to that it has been argued that this small market cannot influence the underlying cash market, remaining the idea
21
of the small importance of CDS market relative to the Bond market. On the other hand, the increasing liquidity of the CDS market in the recent years demonstrates its growing influence and constitutes a key issue in the recent literature on CDS. Moreover, the volume is not the only relevance factor of price leadership, and understands how the transmission from one market to another takes place is essential. As a matter of fact, the relationship between the CDS premium and the Bond spread with the same maturity in the same entity is strong, should be zero in theory, and understands how each one influences the other and which one is the leader in the PDP is a key issue.
Anne-Laure Delatte, Mathieu Gex and Antonia López-Villavicencio (2012) found evidence that the relationship between the CDS and the Bond market depends on market characteristics and on the level of market distress, and is not linear as assumed before. To relax the PDP assumption of linearity the authors introduces threshold effects in order to try to explain the relationship between the Bond and the CDS market in a non linear way. According to them, the constant and continuous PDP is an erroneous belief as the heterogeneous belief in the market produces non linear beliefs. Using a non linear model that changes the speed as a function of economic variables, instead of adjust toward equilibrium, allows them to test if the leading market reverses or not above a certain level of credit risk perceived by market participants. Moreover conclusions show that the Bond market plays a dominant role only in the less risky countries in calm periods, and the higher the distress the more the CDS market dominates the transmission of information.
CDS is an important measure of risk and its increasing volume in the recent years come to show the necessity of investors to trade this type o derivative. In theory, so that there is no arbitrage, CDS and Bond spreads should be approximately equal for the same entity and maturity, and its small difference equal to the risk free rate, which do not happened in reality due to perfect
match between these two types of contracts being really difficult to happen and due to liquidity effects. CDS are not in limited supply and are not fragmented like bonds, and when an investor wants to liquidate his position in the bond market it is not strictly necessary to sell it back, making the CDS spreads incorporating less liquidity leading them to be lower. These CDS characteristics are decisive, since when the investors favor a more liquid market, it will be the market where investors turn to.
There is a suspicious that since market participants uses CDS to hedge against default risk and in speculative strategies, CDS premia tends to overreact during crisis, and a growing influence on the Bond market cannot be assumed as neutral once it can push up borrowers’ interest. Due to that, the European commission has since 2010 expressed concerns that speculations on sovereign CDS may be one of the causes to the sovereign debt crisis, issuing several proposals to regulate the market since then. It is then necessary to understand not only how whose market is the leader on the PDP but also to ascertain how the financial crisis or periods of high stress had affected the links between both markets.
Virginie Courdert and Mathieu Gex (2013) analyze and try to perceive which market was the leading one in the Price Discovery Process. In order to do that, a sample of 5 years CDS premia and bond spreads on a generic 5-year bond on the same entities for 17 financials and 18 sovereigns using interpolation was applied to run a panel vector error correlation model, which have the advantage of estimate the long and the short term relationship. In a first stage a comparison between the adjustments of the two spreads for banks and sovereigns, and in a second stage, using a nonlinear cointegration system, the author tested if there was a rupture during crisis. The results showed that the CDS market leads the Bond market during the whole sample, and accounts for 65% of the PDP. When new news are disclosure into the market about a given
23
corporate, market participants tend to take advantage of it by trading CDS instead of bonds, which can be explained by the greater liquidity of the CDS market. On contrary, for sovereigns there is no leading market and the PDP occurs equally in both markets according to results. This can be due to a greater liquidity in government bonds, compared to corporate ones. Results suggests that CDS market contributed more to the PDP for riskier sovereigns, demonstrating that the global financial crisis in which the level of risk for all entities has raised may have boosted the role of the CDS market. The adjustment speed of the Bond market on the CDS market during crisis increases, while the one of the CDS market is decreases, which means that the leading of the CDS market is enhanced by the crisis. This may happen not only during crisis, but also when the level of risk increases.
Another key issue is the fact that during Crisis Governments tend to take actions to support financial institutions with the view to avoid financial distress or at least to reduce it. Due to those governmental actions, a certain level of risk is transferred from governments to financial institutions, and understands this credit risk transfer mechanism is essential to understand the recent evolution and influence of the CDS market.
Adrian Alter and Andreas Beyer (2014) focused their studies in the dynamics of spillovers effects during the European sovereign debt turmoil, analyzing daily data of CDS spreads and aggregating this information into a Contagion Index with four main components, among sovereigns, among banks, from banks to sovereigns and conversely. It was shown that spillover effects intensify during crisis such as the likelihood of contagion prior to policy interventions and key financial market events. Results also demonstrated that the non-core countries are more sensitive to shocks and the gap in the level of contagion between core and non-core countries narrows during crisis. This amplification of contagion can be seen as the increasing interdependence of the sovereign
CDS spreads, since governmental measures to support financial institutions during crisis results in a credit risk transfer from banks to sovereigns.
In turn Irina M. Stanga(2014) analyze bank bailouts and bank-sovereign contagion channels, dividing it into two main channels of contagion. One is related to the risk transfer from the bank to the government due to bank rescue measures that leads to a decrease in bank default risk and an increase in the fiscal burden of governments and the other with the co-movement between the default risks of the two channels, related with the reduction by governments in obtaining fund due to a deterioration of the sovereign creditworthiness.
Interventions to support the financial sector are associated with increases in fiscal burden and impair the sustainability of sovereign debt, resulting in a risk transfer that leads to an increase in sovereign CDS spreads and a counter move in CDS spreads of the banking sector. More precisely, the issuing of new debt to fund bailouts leads to a reduction on the existing bonds, and since they constitute a significant part of banks portfolios, this dilution will directly affect the bank sector as well, becoming the default risks of both sectors interlinked.
The author tries to quantify the effect of bank bailouts in the default risk in both sectors proposing a framework to identify the effect of those rescuing measures and deal with the endogeneity between banks and governments. For that a structural VAR model is used, allowing the endogeneity between both sectors CDS spreads and the use of sign restrictions was necessary to disentangle the two channels of contagions and therefore to identify the effects on both the default risk of governments and banks. While a positive sovereign risk shock can be identified based on an increase of both sectors CDS spreads and is associated with the second contagion channel, a positive bailout shock is associated with the first contagion channel and is identified throw a increase in CDS spreads of banks and an contrary movement in government CDS spread. The persistence of the shock indicates the extent to which risk transfer remain
25
linked between banks and sovereigns. The overall results show a positive match between the bailouts shocks identified by the model and the dates they were announced by the government, validating in this way the identification scheme. The largest shocks of the sample occur in 2008, precisely in the peak of the European sovereign crisis and when the first bank rescuing measures were announced. Moreover, results show that bailout shock leads to an increase in government default risk and vice versa, showing a strong contagion between the public and the private sector, especially in Europe.
It becomes clearly obvious that the study of how the CDS market had evolved in the recent years and how it interacts with the Bond market in the PDP is essential to have a better comprehension of the market reactions in certain circumstances and events in order to prevent and predict it more precisely. So there is no doubt of the increasing importance of the CDS market in the past recent years. It has become a very important tool, and investors more often use it not only as a safety mechanism due to the risk increasing, but also as a speculative one.
1.2 Subtitle: Why and which measures were taken to
control the market?
As it was shown, CDS market has increasing significantly in recent years, more precisely since 2008 and as a consequence, his impact has increasing as well, especially the SCDS market in the Eurozone, consequence of banks bail ins, in which the private sector transfer some risk to the public sector, of higher distress governmental economies and of spillovers among the Euro countries once they have a strong economic connection. The Eurozone debt crisis is clearly one of the major factor for this increasing in the SCDS market, having in
June 2012 6 Euro countries in the top 15 reference entities by gross notional, with Italy and Spain in the top two positions of the Table.
Before the financial crisis the majority of the SCDS market consisted in contracts of emerging market economies because investors view those economies as higher and once more valuable credit risk. However after 2008 crisis the increasing risk of sovereign debt of advanced economies and the necessity of rises in hedging have boosted activity in SCDS market. SCDS have then become important risk management tools and their premium an important indicator of credit risk. Some authors as seen before argue that CDS market has been having an important role in the onset and growth of the recent crisis and the debate of the usefulness of sovereign CDS intensify with the European sovereign debt crisis. Due to CDS market rapidly increasing influence, questions on whether speculative use of CDS contracts could be destabilizing have arisen. Such concerns have led to some measures attempts taken by the European authorities in order to control that. The SCDS credit events are defined by the International Swap and Derivatives Association (ISDA), and according to its 2003 definitions, bankruptcy, failure to pay, obligation default or acceleration, repudiation and restructuring were stated as qualifying credit events.
Several attempts of standardization were made, being the first attempt in 2009, in which one of the most important measures was the use quarterly payment of fixed coupon rates (25, 100, or 500 basis points). A coupon of 25 bps, for example, implies, that for a CDS of 36 million Euros, bought in a previous year, the buyer owes a payment of approximately (90/360)*(25/10000)*36M, that is 22500 EUR, every quarter, during the maturity of the CDS agreement, or until a credit event occurs. A second attempt was the ban of the uncovered SCDS, which it was one of the most important and controversial measures taken. This
27
ban is due to a perspective that short selling can push sovereign prices into a downward spiral in extreme market conditions that can lead to distressful markets which would lead to a raise in the issuance costs of underlying sovereigns.
SCDS spreads and sovereign bonds reflect market factors and fundamentals, and as shown by some studies inclusive one by IMF (A New Look at the Role of
Sovereign Credit Default Swaps), «SCDS tend to reflect more rapidly new
information, especially in periods of distress, and the use of SCDS as a proxy hedges for other types of credit risk leads inevitably to market spillovers». Despite existing some overshooting signs in SCDS predicted value for periods of distress on the most vulnerable European Countries, there is very little evidence that such SCDS spreads increasing can cause higher sovereign funding costs. This means that there is no conclusive evidence that supports the measure of banning the purchasing of «naked» CDS. Indeed this measure can lead to reduction in SCDS market liquidity to a point in which the effectiveness as a hedging instrument can be affected and as a consequence the usefulness as a market indicator will be lost. On the other hand, and despite some investors see the SCDS market a useful risk indicator and a valuable hedging instrument, others consider that SCDS are speculative tools that do not reflect underlying fundamentals or the actual risks, which implies that they can exceedingly raise funding costs for governments, threatening in this way the financial and fiscal sustainability and increasing market stress. To answer to these raised questions, some studies aim to perceive if SCDS spreads do reflect macroeconomic fundamentals as credit spreads, if they rapidly increment in prices new released information and if they are more likely than other markets to be destabilized. Overall, the results show, or at least there is no evidence to support the opposite, that SCDS spreads provide indications off credit risk that reflect the same market conditions and economic fundamentals as the underlying bonds.
It also demonstrate that SCDS tends to reflect new information more rapidly than the underlying market in cases of market exuberance, which means that they can provide a useful hedge and thereby enhance financial stability. Due to their interconnection with other markets SCDS can lead to the propagation of risks exacerbating systemic events, but so can the other markets, making it difficult to assess and isolate specific influences. The results come to demonstrate that the new measures not only are unjustified, but also it may result in unforeseen consequences that can negatively affect market liquidity and cause dislocations in other markets.
Dealer banks dominate the transactions of SCDS due to their activities and in order to manage their exposure to sovereigns. So under stress, this high level of concentration can lead to market dysfunctions. Traditionally sovereigns do not post collateral to cover the mark-to-market risks of their OTC positions in interest rate and other derivatives. Therefore when sovereign own money to dealer banks, they have exposure on these OTC contracts. But it is not possible to discern from the public available information, whose percentage is meant to cover risks of existing debt, and whose percentage is meant to profit from expected spread widening. If indeed SCDS spreads indicate that SCDS are more speculative than the underlying asset, it is possible that SCDS spreads are not explained by economic fundamentals to the same extent as government bonds and that they are in fact driven more by financial market factors than bonds. Spreads of SCDS and government bonds are basically driven by the same fundamental economic factors which suggest that both reflect sovereign risk, and the price leadership will be attributed to the market that faster eliminates price differences from the long-run equilibrium relationship between both spreads. Previous studies show that despite varies across country and over time value of SCDS information had become more important, and that as SCDS
29
liquidity increases it also increases the SCDS incorporation of information speed.
There are also some concerns about the excessive volatility in SCDS and contagion across countries, which lead to policies attempting to limit SCDS trading. However, due to high market interconnections, is difficult to ascertain which market are more likely to be contagious. Therefore, there is no conclusive evidence to assume that SCDS market tends to be more destabilizing than other markets. In sum there are no previous studies that conclusively support the negative perceptions about the SCDS market, and despite there is some evidence of overshooting for euro area countries, this does not implicate increases in sovereign funding costs. On the opposite, test suggest that government bond and SCDS spreads exhibit the identical dependence on key economic fundamentals being both equally influenced by market risk factors.
Despite there is no conclusive evidence that SCDS markets overly influence underlying bond market, several regulatory and policy initiatives were taken to limit the use of SCDS contracts that are likely to affect the SCDS market and their implications for financial stability. As said before, the most influent was the ban on uncovered «naked» SCDS contracts that was announced on March 24, 2012, and entered into effect on November 1, 2012. Under this new regulation market participants can only buy SCDS contracts only if they hold the issuer’s debt or if they have «meaningful» correlation with the sovereign debt at the time of execution. This ban, as other new OTC reforms design to make the market safer, with the view to harmonize fragmented short selling rules and CDS trading, are likely to increase the SCDS trading costs. In particular it seeks to reduce the risks and failures caused by uncovered short selling and CDS protection buying. This measure were taken due to a risk that short selling in extreme market conditions can lead to an excessive downward spiral in prices and as a consequence to a disorderly market and systemic risks.
The European Commission argues that «circuit breakers» provide time for investors reassess intrinsic value. But the question of what is the time a priori that is required for the temporary suspension remains. Although not be clearly the main reason, since March 2012, when the European Parliament adopted the final version of the measures implicating the ban of the uncovered SCDS, SCDS market liquidity had fallen, especially the SCDS market referring to Portugal, Greece, Ireland, Italy and Spain debt, although the SCDS market volatility decreased for the whole euro area countries. This measure may implicate the removal from some investors even with covered positions due to the fear of being seen as speculative, once the rules are so vague. But once the drop of the liquidity has coincided with other events such as the OMT, it is not clear that it has been due to the new measures relative to SCDS. Also, there is the fear and it remains the perception that this recent ban is more likely to affect smaller economies once it may reduce the investors’ interest on the underlying bond market of those countries, increasing in that way the cost of debt issuance. Yet, it is still necessary to regulate the market, and the fact that Market authorities are in a process of evaluation and trying to regulating it is encouraging. Also there are provisions in the regulation that allows European authorities to suspend such measures if they can prove that the market liquidity is reduced by them.
The last attempt of standardization was in September 2014, when credit event definitions were extended to include government-initiated bail-ins for a financial sector reference entity.
Another measure that could control the explosiveness in the SCDS is the payment of an upfront when buying a SCDS. The upfront is a payment of a certain percentage of the all amount in the SCDS contract, equal to the difference between the spread and the coupon. It should be stated, that despite some attempts, standardization has not been achieved yet. A perfect counter
31
example is Cyprus, whose SCDSs have been quoted in basis points all through the 2010-2014 turmoil. Notwithstanding, for highly distressed reference entities, CDSs are usually quoted in upfronts, instead of spreads, which can not only reduce counterparty risks for SCDSs sellers, but also diminish the high leverage nature of the SCDS market.
2. Title: Methodology and Results
2.1 Subtitle: The data
The data for this paper consist in daily 5-year maturity Greek SCDS spreads and SCDS upfronts for the period between 22/9/2014 and 13/3/2015 for CDS under 2003 Greek definitions and for CDS under ISDA 2014 definitions, that comprises 125 observations each. The maturity of the SCDS was chosen due to the higher liquidity of the 5-year SCDS compared to the others and the dates were chosen to match the introduction of ISDA 2014 definitions, and also to contain the Greek elections period, once it was one of the most trouble periods after the implementation of the ISDA 2014 so that it makes the test of the new measures in controlling the exuberance in SCDS spreads and upfronts more reliable. Both SCDS spreads and upfronts were taken from the source Markit. This data should allow to test if upfronts are less prone to explosive behavior, if CR14 further reduces that propensity, if in explosiveness remains in spreads despite the ban on the naked SCDS and if explosive root periods have any particular meaning. The reason to have both SCDSs spreads and upfronts data might not be so clear at first sight, at as i tis usually considered that for SCDSs quoted in upfronts, the spread should be irrelevant for the investor, as it does not play a role on the return she will obtain when selling. There is strong evidence that SCDSs spreads, although imperfectly, do increase with the
default likelihood of the reference entity, even for those were SCDSs quote is in upfronts (see Longstaff et al 2011; Badaoui 2013). Spreads are incorporated in the default probability function used in CDS, and despite they might also be influenced by a risk premium, and by correlations with market bonds, they provide an indication of the investors’ expectations regarding the default probabilities. Hence, since SCDSs traders gain both when selling at a higher upfront, or when a credit event occurs, spread behavior should still be assessed, namely due to high financial distress of the Greek economy (hence, the high default likelihood) whose default probabilities increased from 38% to 70%, which is typical from a very fragile economy. Due to the small size of the sample, critical values were obtained by Monte Carlo Simulations, rather than by asymptotic results.
2.2 Subtitle: Methodology
The principal objective of this paper is to aim a conclusion on whether the recent CDS measures had improve in a significant way the explosiveness experienced in the CDS market or not. To achieve that, an econometric detection mechanism was used that allows us to test explosiveness in a time series data. Several authors seen bubbles has explosive behavior, which mean that the tests used to test for bubbles can also be used to test for explosiveness in CDS market. Until very recently, bubbles detection mechanisms were unsuccessful and the achievements didn’t have a satisfactory degree of certainty. Has stated by Refet S. Gurkaynak(2008) «We are still unable to distinguish bubbles from time-varying or regime-switching fundamentals, while many small sample econometrics problems of bubble tests remain unresolved. »
There is an extensive literature on the econometric tests for bubbles and innumerous tests with different approaches like variance bounds tests of Shiller
33
(1981) and LeRoy and Porter (1981), integration/cointegration based tests (Diba and Grossman, 1988a, b) or West’s Two-Step Tests. The approach used was based in the integration/cointegration based tests, of which the most recent works has shown effectiveness of recursive procedures in identifying and dating bubbles in real time, which can be very useful tools has a warning mechanism. The following equation is the starting point of the PWY test as most asset price tests:
(
)=
This first degree difference equation can be iterated forward to achieve this second equation:
, such that
;
which issimilar to the following equation:
=
The asset price has two components, the market fundamentals which is the discounted value of expected future dividends (first term of equation 2), and the bubble parte (second term). Under the assumption that r grows faster that the dividends, market fundamental is stationary while the bubble part do not converge. If is non-explosive, then the explosive behavior of can only provide from , which is sufficient proof of existing of exuberance behavior.
The price of the asset today is the sum of the discounted expected future dividends and the expected future price of the asset:
The transversality condition makes the second term equal to zero. So, in case there is a positive bubble and the term differs from zero, the agent can sell the asset and the lost utility will be lower than the sale value. This would lead to disequilibrium in prices, once all agents will sell the asset making the price fall until the fundamental level.
Exuberance in terms of explosive autoregressive behavior propagated by a process on the form
=
+
+
and Phillips, Wu and Yu test the presence of explosive behavior by applying the augmented Dickey-Fuller test for a unit root against the alternative of an explosive root (the right-tailed) for each time series estimated by the following least squares regression:=
+
+
+
;
~NID(0,
);
Where
E (
=0, E (
and
{
}
is the series the researcher is interested in.The unit root null hypothesis is =1 and the alternative hypothesis is
>1. For a recursive right-tailed test, one needs to find an initial window size, , for recursive estimation. The equation is estimated recursively fixing the starting point as the first observation and increasing one observation each time to the subset date sample. The ADF sequence is thus obtained and the SADF statistic is then the supreme value of for < 1 being 1 the total sample,
and the fraction size of the full sample.
The PWY test relies on the estimation repetition of the ADF model on a forward expanding sequence and the test is obtained as the sup value of the ADF statistic sequence. Evidence of explosive behavior is then obtained if the SADF statistic is larger than the right side critical values for certain limited period of time. However this procedure has one big issue. Due to the starting point being fixed, in the presence of more than one bubble, only the first one may be detected if the others are dominated by the first one. Phillips, Wu and Shi (2015) overcome this issue of the complexity nonlinear structures inherent in multiple bubbles in the same sample and present a new test procedure that provides a mechanism of detecting explosiveness and also the origin and the collapsing of the explosive dates successfully, which involve the recursive implementation of a right-side unit root test and a sup test. They present a
35
generalized version of the sup ADF test of Phillips, wu and yu. Phillips et a. applied a rolling version of the SADF test, where the starting window moves over the sample, and extend the SADF test by nesting it in a loop in order to overcome the fixed size of the starting windows. This method increments the starting point ( [0, each run, resulting in a new interval that comes from the fact that the end point , is varying from to 1. The GADF test is therefor:
GSADF(
)=
{
With distribution:
{
}
The Generalized SADF test (GSADF) is able to detect multiple explosive behaviors in the data and overcome in this way the weakness of the SADF test. Nevertheless it is important to notice that the tests may fail to detect an early explosive behavior if the starting window size is too large. This new procedures cover more subsamples of the data and have greater window flexibility, being able to outperform the PWY procedures in detecting explosive behavior when multiple episodes occur in the data. In addition to the GSADF test, a modified version of the original PWY algorithm is developed in which the detection procedure is repeated sequentially with re-initialization after the detection of each bubble. This sequential PWY algorithm works with subsamples of the data with different initializations in the recursions and therefore in theory is capable of detecting multiple bubbles.
In order to obtain consistent dating strategies for bubbles, Phillips, Shin and Wu (2015) further elaborate the SADF statistic considering a backward strategy. The backward SADF test performs a sup ADF test on a backward expanding sample sequence, where the end sample is fixed at , the sample fraction
corresponding to the end point of the window and the starting point varies
from 0 to . Hence, the GSADF test starts from the implementation of the
backwards sup ADF test repeatedly for each value 2∈[ 0;1], making inference based on the sup value of the backwards sup ADF sequence { 2( 0)} 2∈[ 0;1], becoming the test statistic:
(
)=
{
}
And:
GSADF=
(
)}
There is a Matlab and a Gauss code that allows implementing the previous procedure in a very simple way, simulating the critical values for each particular problem available. Also, PSY conclude from extensive MC simulations that the initial window width should be chosen according to the response surface: otal sample.
Critical values are provided for some cases in Phillips, Shin and Wu (2015), but the recommended practice is to simulate the critical values for standard 1%, 5% and 10% significance levels in each empirical problem.
2.3 Subtitle:Results
In this section, the model developed by Phillips Shin and Yu (2015) is used to address the question whether or not the new regulation measures, more precisely the ban of the uncovered SCDS and to test also if the upfront quotes of SCDS were able to control the excess reaction experienced in the SCDS market. There is clear evidence of existence of exuberance behavior, once it has been
37
documented (e.g. Coudert and Gex, 2010) as such the possibility of bubbles. No minimum period is defined by Phillips, Shin and Yu (2015), so it can be consider that any minimum period choice is arbitrary. The main purpose is to assess if the EU measures, which objective is mainly to difficult the yield manipulation of SCDS especially in distress economies due to the amplification in the price discovery process in the bond market, did succeed and if not, considering a minimum exuberance period, can it be consider or not a bubble. From dealers’ view point, explosive spread behavior is still a possibility for very significant gains, irrespective of how long that surge in spreads is maintained. Moreover, for SCDSs quoted in upfronts, explosiveness in the upfront series would have the same type of meaning return opportunities for SCDSs dealers. A differentiation between the CDS under 2003 Greek credit definitions (CR) and the CDS under the ISDA 2014 definitions (CR14) is made.
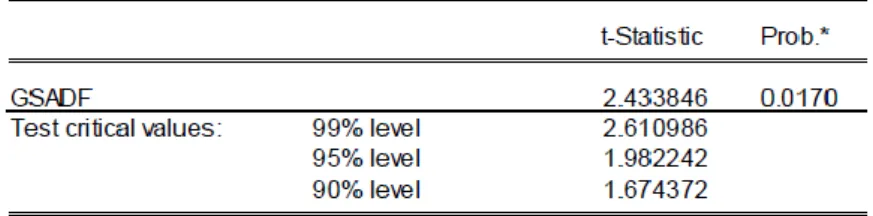
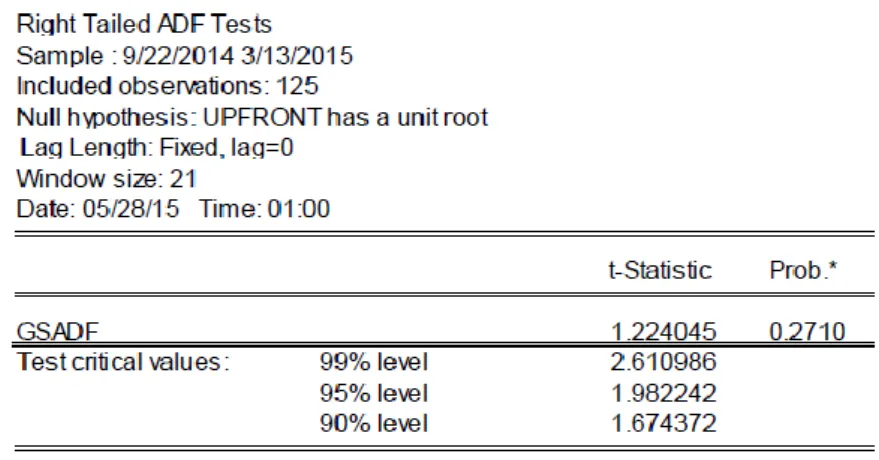
Table 1 and 3 in the Appendix are referent to the GSADF test conducted on Greek upfronts data for the sample period. While in table 1 the SCDS are under ISDA 2014 SCDSs, in Tables 3, for the same sample period, data on SCDSs upfronts for Greece are under the Greece 2003 conventions. Tables 2 and 4 also in the Appendix report the GSADF test on Greek 5 year SCDSs for the same sample period, but referent to the SCDS spreads and as previous, table 2 is referent to SCDS under ISDA 2014, while table 4 data are under the Greece 2003 conventions. Figures 1,2,3 and 4 plot in green the CR14 upfront series, the CR14 spread series de CR upfront series and the CR spread series, in red the 95% critical value sequence and in blue the Backward SADF sequence for CR4 upfronts, CR upfronts, CR4 spreads and CR spreads, for the same financial instrument, in the sample period. Statistical evidence of explosive root or market exuberance exists whenever the evidence reported in the tables shows that the GSADF t statistic is above the simulated critical values, and the explosive periods are identifiable as the ones where the backwards SADF
sequence (the blue line) exceeds the 95% quantile of the relevant distribution (the red line). In the case that this happens for a significant period of time, it might be the case of a bubble existence.
Table 5 is a summary statistical table that includes the mean, the sample variance, sample deviation, range, among others statistical measures that help in the analysis of the results.
It remains obvious that despite all the measures there is still explosive behavior in the SCDS market, which implicates that the measures did not had the desired effect. As it can be clearly seen in the pictures even under the new legislation there are still some episodes of market exuberance for spreads and upfronts, being the most dramatic in the end of 2014 which match the announcement of early presidential elections from PM Samaras. This may be due to higher increase in the risk perception from investors in Greek bonds and the market reaction to the news. At that time there are three tries to elect a president throw the parliament, more precisely in 17th 23rd and 29th of
December of 2014 that did not succeed as it was expectable, implicating by the constitution that will be legislative elections in January, which later on are schedule for 25 of January in the last day of 2014. In the following three days of the announcement of the presidential elections on 8th of December of 2014 the
SCDS spreads rise around 100 basis points per day. In such a short period, SCDS upfronts and spreads under the new legislation rise from its minimum value in the all data sample of 15.87 in 22/09/2014 to 35.67 in 30/12/2014 in the case of upfronts and from 470.35 (the minimum value in the data sample) in 23/09/2014 to 1295.84 in the case of spreads. These events might be the principal explanation for the persistent exuberance behavior, which remains for a significant period of time. This happens due to the market expectation of the fail in the success of parliament elections. The announcement in 6th of January of
39
expectation of financing suspension by troika, will increase the market risk perception since there is the expectation that Syriza will win the elections and as a consequence the Greek stock market falls 30% in the next day. From 6th to
7th of January, the SCDS spreads under the new legislation experience a jump of
413 basis points, the highest among all data. With the oncoming of the election, the polls show a more certain Syriza victory, and in 25/1/2015 Syriza wins with 149 places in a parliament of 300. In the 26th of January CR SCDS upfronts
experienced the highest jump in upfronts from all data, and goes up around 3 percent. As it can be seen in the tables, the mean SCDS spreads and upfronts are way above the minimum values, which are in the first two days of the sample, and the sample standard deviation is more than 400 basis points in spreads and more than 7 percent in the case of upfronts.
These values, despite not being totally clear, can be seen as a warning, and a deeper analysis on the pictures comes to show that in fact explosive behavior exists.
As it can be seen in pictures, both SCDS quoted in spreads and upfronts even under the new legislation increase significantly in this dates due to the higher risks perceived. Under CR 14 upfronts increase for more than the double in a very short period of time, which cannot be explained by fundamentals and spreads increase more than the triple, from 470 to the maximum of 2186 in the beginning of February. Moreover, and despite they exhibit explosive behavior as well and show an increase from 15 to 44, SCDS quoted in upfronts under 2003 legislation show a less explosive behavior than the ones under the new legislation. Although the SCDS spreads under CR are the ones who are more prone to explosive behavior among all, and the ones who experience the highest jump. Despite all that, we can see that whatever the legislation, SCDS quoted in upfronts are less prone to explosive behavior than SCDS quoted in spreads but still exhibit explosive behavior. Overall there is one major market
explosive behavior experienced in all data in the end of the year 2014 and another explosive behavior in the beginning of February, but only for spreads under both legislations.
It becomes obvious that this new measures did not had the necessary control in the yield manipulation by investors, and that new measures are required to do that in a more precise way. Also, according to the rapidly increasing in both spreads and upfronts it remains the idea that at least in stressful economies in stress periods momentum trading dominates over fundamentals, once fundamentals cannot explain this huge increase in such a short period of time.
Despite not being obvious and require a further analysis, there are some indicators of bubble behavior, although it can be argued if whether or not the time interval of the explosive behavior is enough to be considered a bubble. Nevertheless it’s at least a warning indicator of bubble existence.
41
Picture 2:CR14 spreads
Picture 4: CR spreads.
Table 5: Summary statistics of Greek SCDS spreads and upfronts under both legislations.
CR14 Upfronts CR14 Spreads CR Upfronts CR Spreads Mean 30.38 1119.06 28.3 1020.04 Standard Error 0.73 41.42 0.68 35.79 Median 30.71 1016.51 29 968.71 Standard Deviation 8.15 463.08 7.55 400.16 Sample Variance 66.46 214440.98 56.9 160130 Range 28.61 1716.09 25 1401.3 Minimum 15.76 470.36 15.2 457.07 Maximum 44.36 2186.45 40.3 1858.4 Count 125 125 125 125
43
Chapter 2
Gyprus Bail-in Episode
As we saw before several attempts to regulate the SCDS market were made, and due to the economical link between banks and governments, CDS restructuring definitions were adjusted in order to dissociate sovereign and banking risk. Banking regulations moved away from the bailout period, which had proven unsustainable in the Euro Area, to contingent convertible bonds and even bail-ins with hair-cuts on bank holders and depositors. The inclusion of government-initiated bail-ins in the credit event definitions provides protection for bank bond holders, attempting to mitigate such flights, and is the most recent of several regulatory adjustments CDSs have suffered in recent years.
Due to this inclusion in credit events, it becomes mandatory to have a better comprehension of the impact this measure could have, and analyzing the bail-in episode bail-in Cyprus can give a better bail-insight of it, sbail-ince it was one of the biggest episodes of regulation. In a first sight and according to some previous studies this Cyprus bail-in episode suggested that bail-ins could also increase sovereign default probabilities, as a result of capital flights.
To understand the Cyprus bail-in episode in a better way it is necessary to analyze the economic historical facts that lead to that measure, such as a brief view of Cyprus economy.
2.1 Subtitle: Cyprus Historical View
Cyprus is known for being a «fiscal paradise», since due to his law taxes and high return it was an attraction to foreign companies, and with the Cyprus
entry in the European Union, banks gain even more capital. Even with the European Crisis in 2008, Cyprus continued stable maybe due to his traditional policies of loans and deposits. Nevertheless Cyprus banks start to compete between themselves for deposits and start to offer higher and higher interest rates, not following the Euribor. Until 2012 Cyprus had financial stability and investors view Cyprus debt as a safe investment. But the explosion in the navy base Evangelos Florakis, and the financial Greek crisis warning the market to a potential Cyprus crisis once Cyprus had at that time an enormous amount of Greek Bonds. In October 2011 the bank sector in Cyprus starts to be alarming once the Laiki Bank star to use the ELA program insistently. Before the entry in the Euro Zone international loans were too difficult, especially for south European countries, and at that time the Drachma was continually falling, resulting in a high inflation and high taxes to Greek bond holders. With Greece joining euro the entire previous scenario changed and it became easy for the Greek government to get access to financial markets and credit, once every country was seen with similar risk. Although the bankruptcy of Lehman Brothers in 2008 change all the economic perspective and banks start to get more hesitant in conceding credits and start to look to each country separately in terms of risk. So, interest rates start to increase as well, mainly for those with high debt, becoming once again difficult to have access to credit. Due to all this Greek start to have serious financial problems, and in 2011 agreed with the Euro Zone and declared the non-compliance of his debt securities, and as a consequence the debt holders did lost big part of their investment, which aggravates the Cyprus financial health, once Cyprus banks own big amounts of Greek debt, around 25% of the GDP. With the election of the new president Demetris Christofias the government expenditure increases, which lead to an increasing in the sovereign debt. In July the ECB refuses to accept Cyprus
45
sovereign securities as a guarantee for loans and rating agencies start to see Cyprus as a high risk country and low Cyprus ratings accordingly.
In 11/11/2013 appears news in Financial Times, «Radical rescue proposed for Cyprus» containing three main measures to diminish the banking sector, being one of them and the most radical the bail-in, warning to the risks of this measure and its possible contagion to the Euro Zone and Cyprus bank sector possible collapse. The agreement consisted in a bail-in option for all depositors, with both insured as un-insured experiencing a haircut. The agreement consisted in a tax of 9.9% for the deposits above 100000 euros and a tax of 6.75% to the ensured deposits. The decision occurred in 16 of March and it was known as «Black Saturday». But this raised some protest once it was controversial, and the measure was vetoed in parliament. Although, and due to an increasing necessity of funding in the 10th of April a second attempt was made, and the
bail-in measure succeed, being the first time such measure was made. This new solution lead to the dissolution of the bank Laiki and to a restructuring of the Cyprus bank throws bail-in. As referred before, the 6th of March was known as
Black Saturday due to the huge losses experienced in the deposits, once the announcement of such measures destroyed the confidence in Cypriot banks. The deposits in Cypriot banks suffer a reduction from 70.2 billion in December 2012 to 47.3 billion in December 2013. This decline is due to the previous measure, and it may only disappear if such measures are banned, restoring the credibility.
2.2 Subtitle: Cyprus CDS Evolution:
During all this, Cyprus sovereign bonds suffer several changes in terms of risk, and as a consequence the SCDS market suffers changes as well. In this
chapter it will be analyzed the Cyprus CDS behavior during all this process, before and after the bail-in agreement.
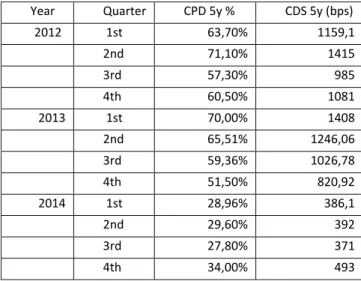
Standard & Poor’s publish quarterly reports where it describes the evolution of risk of sovereign Debt writers. This evolution is measured throw the observation of the Cumulative Probability of Default (CPD) that is calculated throw the CDS spreads and throw a recovery rate.
Tables 5 and 6, and pictures 2 and 3 will give a brief view of the CDS spreads during all the process, as well as a comparison with other countries and a bankruptcy probability given by the CPD. Table 6 and picture 2 are referent to CDS of several countries with the highest CDS spreads, and table 7 is the evolution of the Cyprus CDS spreads since for the last quarter of 2012 (before bail-in) and the second quarter of 2013 (after bail-in) to give a better insight of what can happen to the CDS market with a bail-in inclusion. Also, a series of tables that contain the CDS spreads of several countries for different quarters after the bail-in can be found on the appendix.
Cyprus surge for the first time in the S&P reports in the first quarter of 2012, despite the data use in that report only began in 16 of March for the same year. It enters in that report immediately to the top of the 10 most riskier countries, which happened after the Greek debt forgiveness and restructuring. With this Greek was removed from the report once its CDS no longer were traded. This events lead to a CPD of 63.7% and a rise in the CDS 5 years spreads to 1159.1 basis points.
In the middle of the second quarter the CDS spreads experienced again a sharp raise going above 1600 basis points, ending the quarter around 1400 basis points. In this quarter there are two events that are important to mention: the end of mandate of the Cyprus Central Bank Athanasios Orphanides in 2nd of
May and Cyprus Bonds downgrading in Several Rating Agencies, including Moody’s. This was due to the increasing probability of Greece exit the Euro
47
Area, which would result in higher financing needs once Cyprus institutions
were extremely exposed to Greek economy, and the Greek elections on 17th of
July come to aggravate this situation even more. With all this, Cyprus no longer had the minimum requisites of credit quality demanded, and ECB stop accepting Cypriot bonds as a guarantee for refunding.
Throw the third quarter, as in all Europe; Cypriot CDS remain constant with a tendency to decline in the end of the quarter ending with a value inferior to 1000 basis points. This decline was motivated by the plan of Mario Draghi of unlimited Cypriot Bonds purchase with the objective of stabilize the euro. At the same time the Greek situation seems to deteriorate, revealing a small liquidity in the Greek CDS market.
It is possible to view in table 7 and in the picture 2 some aspects of the country financial situation in the last quarter of 2012. At that moment Cyprus was near to become the riskiest country once again and remains in the second place for several months. In the 4th quarter Cyprus CDS spreads became to
increase gradually, probably due to preliminary agreement that was reveal to the press. However in December the CDS spreads experienced a sharp rise, going above 1200 basis points and ending the year around 1100, and with a correspondent CPD of 60.5%. The sharp rise in December is explained by the news in the German press about the possibility of Russian money laundering throw Cypriot Banks. At that time Cyprus had the 4th biggest CDS spread raise,
increasing around 9.7%. It can be seen that in the end of the year Cyprus have more than the double of the next riskier European country (Portugal).
In the first quarter of 2013 there is an increasing in the Beginning of January of the Cyprus CDS spread from 1000 to 1200 basis points. In this time the Cypriot Banks suffer the biggest decrease in the deposits in the recent History. In 11 of February of 2013, according to Leocádio (2014) with the news in the Financial Times quoting confidential documents about a possible bail-in, the
deposits suffer again a decrease, even bigger than the one verified in January. But at 24th of February, Nicos Anastasiades is elected president which had a
positive impact on the CDSs, and until 16 of March the CDS spreads gradually decrease until reach 600 basis points. Although, with the bail-in decision, the CDS verify an aggressive rise to 1400 basis points starting a high volatility period. Until 25 of March, when it was known the bail-in conditions, the spreads decrease once again and gone below 1000 basis points, having after that data return to 1400, corresponding to a CDP of 70%.
After the agreement on March 2013, in the second quarter of 2013, it can be seen that Cyprus didn’t change its position in the ranking, remaining once again the 2nd riskier country, being the only change the probability of
bankruptcy that increase a little bit. It can be conclude that its position in the ranking and its financial condition didn’t change significantly in a year. Throw this; the bail-in imposed by troika didn’t have the desire effect in a short term, showing precisely the opposite, once Cyprus bankruptcy probability increased. This analyses shows that at that time, even after three months of the agreement, there was still fears about the solution found for the financial problems having the CDS spreads ending the quarter with 1200 basis points and a CDP of 65.51%. In the middle of the 3rd quarter the volatility experienced
before stabilized, ending a little bit above 1000 basis points. In the last quarter of the year, despite having decline significantly, as in the rest of the Europe, the CDS spreads still exhibit a little bit of volatility, ending the quarter with 820 basis points and a respective CPD of 51.5%. In the beginning of 2014 the previous tendency persisted, having the Cyprus CDS decline 52% ending the quarter with 386 basis points, slightly below the Greek spreads. In the second quarter of the same year, despite the Cyprus CDS spreads remain practically unchanged, its liquidity increased, according to the S&P Capital IQ (2nd quarter,