2019
UNIVERSIDADE DE LISBOA
FACULDADE DE CIÊNCIAS
DEPARTAMENTO DE BIOLOGIA ANIMAL
Patterns of positive selection on the transcriptome of western
Iberian Squalius fish: a new approach accounting for alternative
splicing
Carlos Ernesto Rodríguez Ramírez
Mestrado em Biologia Evolutiva e do Desenvolvimento
Dissertação orientada por:
Professora Doutora Maria Manuela Coelho
Professor Doutor Vítor Sousa
- 2 -
For my family, who no matter the distance always supported me.
- 3 -
Acknowledgments (Agradecimentos)
Como é sempre o caso em todas as nossas conquistas importantes na vida, este trabalho não teria sido de todo possível sem a ajuda e o apoio de muita gente. Estou-vos profundamente grato a todos vocês, não só pelo vosso apoio durante a realização deste trabalho, mas pelo apoio incondicional que sempre me deram. Palavras nunca serão suficientes para expressar a gratidão que sinto. Ainda assim, deixo-vos um breve, porém sentida, mensagem de agradecimento a todos vocês.
Primeiro quero agradecer à minha amada família. É graças ao vosso grande apoio e amor que hoje sou a pessoa que sou e que consegui chegar até onde cheguei. Mesmo agora, a um oceano de distância, vocês continuam a apoiar-me incondicionalmente. Apesar de apenas vos dedicar uma fração do tempo que merecem, vocês continuam a arranjar tempo para mim sempre que necessito. Pelo amor e apoio que me deram a vida inteira, obrigado. Amo-vos muito.
Em segundo lugar, queria agradecer aos meus fantásticos orientadores: a Professora Manuela Coelho e o Vítor Sousa. Obrigado pelo vosso constante apoio, positivismo, energia e paciência. Obrigado por todas as fascinantes discussões científicas que tivemos (eram sempre o ponto alto do meu dia). Obrigado por tudo o que me ensinaram. Tenho a certeza que hoje sou um melhor investigador graças a vocês e estou muito agradecido por ter tido a oportunidade de trabalhar com vocês.
A seguir, queria agradecer as pessoas fantásticas do meu grupo Evolutionary Genetics. Foram vocês que animaram o meu dia-a-dia durante os longos meses da realização deste trabalho. Obrigado por todas as discussões interessantes que tivemos (tanto as científicas como as menos científicas!). Obrigado por toda o apoio, ajuda, sugestões e conselhos que me deram. Fico feliz por fazermos todos parte do mesmo grupo. Quero agradecer ao João Moreno pela sua inestimável ajuda na parte da extração do RNA do Squalius
aradensis e do Squalius torgalensis e no envio das amostras para a BGI. Foi um processo mais sofrido do
que estávamos à espera, mas nunca desististe de repeti-lo até as amostras chegarem em boas condições à BGI. Também te agradeço por graciosamente teres cedido acesso às tuas sequências de Sanger de genes do ciclo circadiano que foram essenciais para demonstrar a fragmentação das sequências do transcriptoma. Tamém quero agradecer ao Miguel Machado e ao Tiago Jesus. Ao Miguel Machado por graciosamente ter-nos dado acesso aos dados de RNA-seq não-publicados do Squalius alburnoides (AA) e ao Tiago por ter partilhado conosco múltiplos scripts para análises transcriptomicas. Para além disso, ambos tiveram a simpatia de explicar-nos a organização do servidor do Evolutionary Genetics.
E claro que não podia deixar de agradecer a todos meus maravilhosos amigos. Apesar de já não nós vermos com a frequência que gostaríamos, sempre que nos reencontramos é motivo de grande alegria para mim.
- 4 -
São vocês que me levantam o animo e põem um sorriso na cara independentemente de quão desanimado esteja. Infelizmente não vos posso agradecer a todos individualmente aqui, mas há duas pessoas em particular a quem tenho que agradecer. Primeiro, Catarina Mouta, por vir visitar-me a faculdade sempre que podia. Não tens ideia do quão valiosas estas visitas eram para mim: pela companhia, apoio e alegria que me davas. Obrigado, Cata. Segundo, Inês Ventura, por todo o apoio e bons conselhos que me deste, e por me levantares sempre o ânimo com a tua energia contagiante. Obrigado, amiga.
Finalmente, quero agradecer a minha namorada, Cátia Chanfana. Estiveste sempre ao meu lado. Festejaste comigo os pontos altos, e sofreste comigo os pontos baixos O teu amor, carinho e apoio incondicional são constantes que alegraram os meus dias, mesmo os mais difíceis, e que me deram força para ultrapassar os obstáculos que tinha pela frente. És uma pessoa maravilhosa e tenho muita sorte de que faças parte da minha vida. Estou-te profundamente grato por tudo, meu amor. Obrigado.
- 5 -
Resumo
Um dos principais objetivos em biologia evolutiva é compreender os mecanismos moleculares do processo de adaptação dos organismos vivos, nomeadamente o tempo e o modo em que este ocorre. Avanços na sequenciação de última geração (“next generation sequencing”) têm permitido melhorar o nosso conhecimento sobre os mecanismos da adaptação ao nível molecular, inclusive em espécies não-modelo. Um exemplo disto é o uso de dados de RNA-seq para procurar assinaturas de seleção positiva ao nível do transcriptoma usando o rácio entre substituições não-sinónimas e substituições sinónimas (dN/dS). Contudo, a utilização de dados de RNA-seq nestes estudos está associado ao risco de existirem diferentes isoformas resultantes de splicing alternativo misturadas nos alinhamentos de genes ortologos. Ainda assim, ao providenciar dezenas de milhares de sequências de genes codificantes, os dados de RNA-seq podem ajudar a compreender o tempo e o modo do processo adaptativo. Actualmente, também existem métodos para inferir o rácio dN/dS para cada ramo de uma árvore de genes (“gene tree”), denominados modelos de
branch-site. Estes métodos permitem identificar os ramos das “gene trees” onde é mais provável ter
ocorrido seleção positiva para determinado gene.
Em Portugal existem quatro espécies de ciprinídeos de água doce do género Squalius (S. carolitertii, S.
pyrenaicus, S. torgalensis e S. aradensis) que estão distribuídas ao longo de um cline de temperatura
norte-sul que abrange dois tipos de climas – Atlântico e Mediterrânico - e que é refletido num cline de características morfológicas. Estudos recentes de expressão génica e previsão da estrutura das proteínas em duas destas espécies, S. torgalensis e S. carolitertii, sugeriram que S. torgalensis possui uma adaptação às temperaturas mais elevadas, características da região Mediterrânica que habita, nomeadamente no gene
hsp90.
Neste estudo procurámos determinar se existem evidencias de seleção positiva no transcriptoma de quatro espécies de Squalius do oeste da Península Ibérica, nomeadamente S. carolitertii, duas populações de S.
pyrenaicus (Tejo e Guadiana), S. torgalensis e S. aradensis. Para este efeito combinámos novos dados de RNA-seq com dados de estudos anteriores para obter assemblies dos transcriptomas destas espécies e de Leucisucs burdigalensis e Danio rerio, usados como outgroups. Estes dados permitiram-nos caracterizar o
número de genes ortólogos com assinaturas de seleção positiva, identificar os ramos da filogenia destas espécies com evidência de seleção positiva e determinar quais as funções biológicas com assinaturas de seleção ao longo da filogenia dos Squalius do oeste da Península Ibérica. Para além disso, dado que para detectar seleção é necessário inferir a uma árvore filogenética para cada gene (“gene tree”), foi possível caracterizar as relações filogenéticas entre estas espécies ao nível do transcriptoma.
Como usámos dados de RNA-seq de órgãos e condições distintas, foi necessário ter particular atenção à possibilidade de existirem diferentes isoformas nos alinhamentos de genes ortologos. Por este motivo,
- 6 -
desenvolvemos três pipelines bioinformáticas diferentes para 1) identificar grupos de sequências ortologas (i.e potenciais genes ortologos) entre os transcriptomas das nossas espécies; 2) criar alinhamentos de boa qualidade dessas sequências ortologas sem serem afetados pela presença de diferentes isoformas de splicing; e 3) realizar testes de seleção positiva nos alinhamentos limpos. Na primeira pipeline, Pipeline 1, utilizámos um script para implementar a metodologia do Best Reciprocal Hits (BRH) para a identificação de sequências ortologas e um método que agrupa sequências por similaridade para filtrar isoformas do mesmo transcrito. Na segunda pipeline que desenvolvemos, Pipeline 2, para a identificação dos genes ortologos utilizámos um pacote baseado no princípio do BRH mas com uma implementação mais completa (OrthoDB). Para a Pipeline 2 também desenvolvemos uma abordagem nova para lidar com alinhamentos com diferentes isoformas de splicing misturadas, que tem como princípio manter apenas as regiões do alinhamento onde as isoformas apresentam os mesmos exões. A última pipeline que desenvolvemos, Pipeline 3, é semelhante à Pipeline 2 mas é menos conservadora de modo a aumentar o número de genes ortologos identificados. Cada pipeline foi aplicada a um dataset de transcriptomas distinto. Os dados gerados pela Pipeline 3 foram os que utilizámos para as restantes análises. Dado que o o transcriptoma de S. aradensis era mais fragmentado do que o das outras espécies repetimos as análises com dois datasets que diferiam na inclusão (Dataset D) ou não (Dataset C) de S. aradensis.
Os nossos resultados demostraram que utilizando a Pipeline 1 fomos capazes de obter um número considerável de ortologos (10 767) e de ortologos com assinaturas de seleção (1 307). Contudo, a análise de alinhamentos mostrou que muitos dos genes sobre seleção positiva continham regiões desalinhadas, consistentes com a presença de exões de diferentes isoformas. Com a Pipeline 2 não encontrámos este problema, mas com o custo de uma grande redução no número total de ortologos (475) e de ortologos com assinaturas de seleção (19). Na Pipeline 3 obtivémos um número de ortologos comparável ao da Pipeline 1 (entre 9 605 e 13 525), e um menor número de ortologos com assinaturas de seleção (entre 106 e 247). Apesar destes resultados não serem diretamente comparáveis devido ao facto de não termos usado sempre os mesmo dados para as três pipelines, estes resultados sugerem que a Pipeline 3 consegue diminuir os falsos positivos devidos a alternative splicing, ao mesmo tempo que preserva o máximo de informação possível dos dados.
Relativamente aos padrões das gene trees nos transcriptomas das nossas espécies, descobrimos que no caso do Dataset C a gene tree mais suportada no transcriptoma (39% dos genes ortologos) corresponde à filogenia descrita recentemente com base em 7 genes nucleares, que sugere a parafilia de S. pyrenaicus em relação a S. carolitertii. Para além disso, uma outra porção do transcriptoma (10% dos ortologos) apoiava uma gene tree que segregava a espécies do clima Atlântico (S. carolitertii e S. pyrenaicus do Tejo) e do clima Mediterrâneo (S. pyrenaicus do Guadiana e S. torgalensis), o que pode ser um sinal de convergência nalguns genes entre espécies que habitam em regiões com o mesmo tipo de clima.
- 7 -
Relativamente às assinaturas de seleção, encontramos sinais de seleção em 2.0% dos genes ortologos no Dataset C e 1.4% no Dataset D. Isto não difere muito dos 2-4% de genes ortologos com assinaturas de seleção que estudos semelhantes estimaram noutras espécies de peixes ósseos. Em ambos os datasets encontramos sinais de seleção positiva em todos os pontos da filogenia, sendo que os ramos com mais genes com assinaturas de seleção positiva dentro do clade Squalius pertencem a espécies a viver sob a influência do clima Mediterrânico (S. pyrenaicus do Guadiana e ao S. aradensis). Visto que estudos prévios encontraram evidência de adaptação à temperatura noutra espécie que vive sob a influência do clima Mediterrânico, S. torgalensis, é possível que o relativo elevado número de genes sobre seleção positiva na linhagem destas espécies seja em parte uma resposta às altas temperaturas no Verão, características deste ambiente. No entanto, descobrimos que estas espécies de Squalius apresentam genes com assinaturas de seleção em funções tão variadas como a coagualação sanguínea, a resposta imunitária, desenvolvimento, proteólise, ligação entre proteínas e metabolismo. Nalguns casos, estas funções parecem estar sobretudo associadas a determinados ramos da filogenia. Por exemplo, a coagulação sanguínea tem 3 dos 5 genes desta categoria no ramo do S. pyrenaicus do Guadiana. Contudo, na maioria dos casos o número de genes sob seleção positiva em cada categoria funcional estavam distribuídos de forma idêntica ao longo dos ramos da filogenia. Isto indica que a nossa análise de enriquecimento funcional detetou funções biológicas que foram selecionadas de forma consistente ao longo da filogenia destas espécies. Em conclusão, os resultados do presente estudo sugerem que há 1.4-2.0% de genes sobre seleção positiva em todos os ramos da filogenia, principalmente em espécies sob a influência do clima Mediterrânico, que no geral apresentam um número maior de genes sobre seleção positiva.
Este estudo demonstra ainda que, em estudos comparativos que usem transcriptomas, a presença de
alternative splicing pode facilmente afetar os alinhamentos, e eventualmente levar a falsos positivos. Nesta
tese foi desenvolvida uma nova metodologia para lidar com a presença de isoformas de splicing alternativo nos alinhamentos, baseada no princípio de manter apenas os exões em comum entre isoformas de diferentes espécies. Esta pipeline bioinformática aqui desenvolvida é um recurso que pode ser útil para estudos comparativos em transcriptomas noutras espécies. Finalmente, relativamente aos Squalius do oeste da Península Ibérica, este estudo traz novas ferramentas transcriptomicas para duas destas espécies – S.
aradensis e a população do Tejo de S. pyrenaicus, para as quais não existiam dados transcriptomicos. Os
resultados deste estudo servem de ponto de partida para estudos mais detalhados no futuro.
- 8 -
Abstract
One of the main goals of evolutionary biology is to understand the molecular mechanisms of adaptation. Advances on next generation sequencing (NGS) have allowed to improve our knowledge on the mechanisms of adaptation, including in non-model organisms. One example is the use of RNA-seq data to test at the transcriptome level for the presence of signatures of positive selection using the ratio of non-synonymous to synonymous mutations (dN/dS ratio). However, the identification of orthologous sequences between the transcriptomes of different species is challenging because of the possibility of mixing different splicing isoforms on the ortholog alignments. Even so, by providing tens of thousands of sequences for protein coding genes, RNA-seq can be a powerful tool for understanding the time and mode of the adaptative process.
In Portugal, the western Iberian freshwater cyprinids of the Squalius genus are a good system to study adaptation. The reason is that there are four species (S. carolitertii, S. pyrenaicus, S. torgalensis and S.
aradensis) distributed across a north-south temperature cline, encompassing two distinct climate types –
Atlantic and Mediterranean. Recent studies found evidences of adaptation to temperature in one of the southern species (S. torgalensis). In this study, we compared the transcriptomes of these four species to look for genes with signatures of positive selection, infer branches of their phylogeny with evidence for positive selection, and identify biological functions that were enriched in genes under positive selection. We also characterized the relationship between these species at the transcriptome level.
Since our RNA-seq data for the different species came from different organs our study was especially vulnerable to the effect of alternative splicing. We have thus developed a new approach to deal with alternative splicing in comparative studies using transcriptomic data. Our approach was based on identifying ortholog alignments with different splicing isoforms and remove the regions on the alignments with exons that were not common between isoforms. Our results suggest that our approach manages to reduce the quantity of false positives related to alternative splicing in comparison with a more conventional approach.
Regarding the phylogenetic relationship between species, we found support for the paraphyly between S.
pyrenaicus and S. carolitertii, which has been also suggested by recent studies. Regarding the patterns of
positive selection on these species, we found positive selection in 1.4% to 2.0% of the identified ortholog gene groups, which is comparable to what has been estimated for bony fish species in other studies. Interestingly, we found a relatively higher number of genes under positive selection on the branches of the southern species under the Mediterranean climate type than on the northern species under the Atlantic climate type. This could suggest that the southern Squalius species might be under stronger selective pressures due to the characteristics of the Mediterranean climate type, like high summer temperatures. We also found that the genes with signatures of selection were enriched on several biological functions,
- 9 -
including blood coagulation, immunity, proteolysis, development and metabolism. Rather than having particular functions associated with specific branches of the phylogeny, most of the biological functions were generic and distributed similarly across species. This suggests that these biological functions have been consistently selected on the phylogeny.
In conclusion, in this study we present a new approach to deal with alternative splicing on comparative studies using transcriptomic data, which can be useful for comparative studies on other species. We also present new transcriptomic data for two species of western Iberian Squalius – S. aradensis and the Tagus population of S. pyrenaicus. These results can be used as a resource for further studies on adaptation using the western Iberian Squalius as a model.
- 10 -
Table of Contents
Acknowledgments (Agradecimentos) ... - 3 - Resumo ... - 5 - Abstract ... - 7 - Table of Contents ... - 10 -List of Figures and Tables ... - 12 -
Tables ... - 12 -
Figures ... - 13 -
1. Introduction ... - 14 -
2. Methods ... - 19 -
2.1 RNA Seq data ... - 19 -
2.1.1 Newly sequenced transcriptomes ... - 19 -
2.1.2 Published transcriptomes ... - 22 -
2.2 Datasets ... - 22 -
2.2 Bioinformatic pipelines for identification of orthologs with signatures of selection ... - 24 -
2.2.1 De novo transcriptome assembly ... - 24 -
2.2.2 Contig redundancy removal (Unigene identification) ... - 25 -
2.2.3 Open Reading Frame (ORF) identification ... - 26 -
2.2.4 Ortholog identification and annotation ... - 26 -
2.2.5 Ortholog group (OG) sequence alignment ... - 27 -
2.2.6 Cleaning orthologous group (OG) alignments... - 28 -
2.2.7 Inferring gene trees for aligned multispecies orthologous groups ... - 30 -
2.2.8 Detecting positive selection... - 30 -
2.3 Downstream analyses ... - 31 -
2.3.1 Transcriptome-wide distribution of gene trees ... - 31 -
2.3.3 Mapping the signatures of positive selection in to the phylogney ... - 32 -
2.3.2 Functional enrichment analysis ... - 32 -
2.3.3 Functional enrichment mapping on the phylogeny ... - 33 -
2.4 Target genes related to temperature response and circadian rhythm ... - 34 -
2.5 Ethics statement ... - 34 -
3. Results ... - 38 -
- 11 -
3.2 Ortholog groups (OGs) and multispecies alignments ... - 41 -
3.3 Gene trees across the transcriptome ... - 45 -
3.4 Orthologous groups with signatures of positive selection (pOG) ... - 48 -
3.4.1 A new approach for correcting misaligned regions ... - 48 -
3.4.2 Patterns of positive selection across the western Iberian Squalius species tree ... - 53 -
3.5 Functional enrichment analysis ... - 56 -
3.5.1 Top score biological functions ... - 56 -
3.5.2. Biological functions under positive selection across the species tree ... - 57 -
3.6 Target genes related to temperature response and circadian rhythm ...61
4. Discussion ...62
4.1 New splicing-aware pipeline for comparative sequence analysis on transcriptomic data ...62
4.1.1 Development and improvement of the pipeline ...62
4.1.3 Current limitations to distinguish isoforms from paralogs ...65
4.2 Evolutionary history of Portuguese Squalius fish ...66
4.2.1 Dominant gene tree patterns across the transcriptome...66
4.2.2 Signatures of positive selection on Squalius fishes ...67
4.2.3 Biological functions under selection throughout the evolution of the Iberian Squalius fishes .69 5. Final remarks and Future Perspectives ...71
6. Bibliography ...73
- 12 -
List of Figures and Tables
Tables
Table 2.1 - Transcriptomic data for each transcriptome assembly used in this study. Table 2.2 - Summary of the species and transcriptome assemblies used on each dataset.
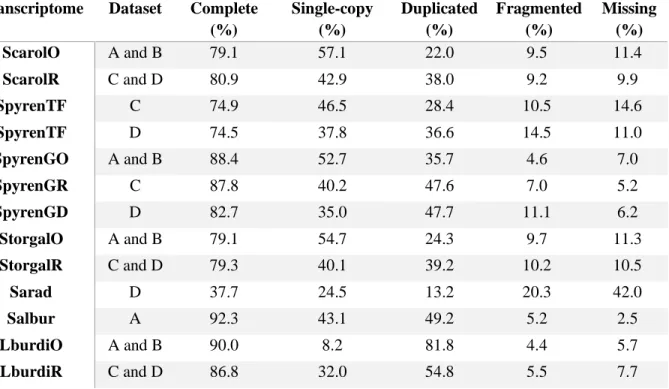
Table 3.1 - Raw and cleaned reads metrics for the three transcriptomes sequenced in this study. Table 3.2 - Contig summary statistics for all the transcriptomes assemblies used on this study. Table 3.3 - Completeness results of the transcriptome assemblies used in this study as calculated by
BUSCO using a benchmark of 4584 universal single copy genes on Actinopterygii.
Table 3.4 - Number, proportion and mean length of open reading frames (ORF's) predicted by
Transdecoder for each transcriptome assembly.
Table 3.5 - Summary of the results of several steps of the bioinformatic pipeline from the ortholog
identification until the selection tests.
Table 3.6 - Frequency and proportion of gene trees in each of the gene tree clusters (GTCs) for Dataset C and D.
Table 3.7 - Number and proportion of pOGs mapped on the different branches of the inferred species tree
(Dataset C).
Table 3.8 - Number and proportion of pOGs mapped on the different branches of the inferred species tree
(Dataset D).
Table 3.9 - Top 10 scoring Functional Clusters inferred for Dataset C’s pOG list as given by DAVID’s
Functional Clustering, ranked according to enrichment score.
Table 3.10 - Top 5 Functional Clusters inferred for Dataset D’s pOG list as given by DAVID’s Functional
Clustering Analysis, ranked according to enrichment score.
Table 3.11 - Number of pOGs in each Functional Category that are under selection on each branch of the
species tree inferred for Dataset C.
Table 3.12 - Number of pOGs in each Functional Category that are under selection on each branch of the
- 13 -
Figures
Figure 1.1 - Distribution of the four Squalius species in Portugal.
Figure 2.1 - Summary of the main differences between the three bioinformatic pipelines developed during
this study to get OG alignments and test them for selection.
Figure 2.2 - Downstream analysis with the results of Dataset C and D.
Figure 3.1 - BUSCO results for the transcriptome assemblies used in this work.
Figure 3.2 - Number of orthologs throughout the different steps of the bioinformatic pipeline from the
ortholog groups identification until the selection tests.
Figure 3.3 - Distribution of the alignment lengths on datasets C and D.
Figure 3.4 - Median topology of the gene tree clusters (GTC) on Pipeline 3 for: I) all the GTC’s on
Dataset C and II) the six top GTC’s on Dataset D.
Figure 3.5 - First example of an alignment with a misaligned region in different steps of the cleaning
process.
Figure 3.6 - Second example of an alignment with a misaligned region in different steps of the cleaning
process.
Figure 3.7 - Third example of an alignment with a misaligned region in different steps of the cleaning
process.
Figure 3.8 - Example of a plot of pairwise distances between the sequences of the different species on the
three OG alignments showed above (From top-left to bottom: Figure 3.5, Figure 3.6 and Figure 3.7).
Figure 3.9 - Frequency of ortholog groups with signatures of positive selection (pOGs) on the branches of
the inferred species tree ( i.e the median topology of the most frequent gene tree cluster) of I) Dataset C and II) Dataset D.
Figure 3.10 - Proportion of pOGs in each Functional Category that are under selection on each branch of
- 14 -
1. Introduction
Adaptation is the evolutionary process through which phenotypic traits that increase the fitness of individuals on a given environment change due to the action of natural selection (Barrett and Hoekstra, 2011). This evolutionary mechanism has allowed living organism to colonize many of the different environment present on Earth. Therefore, it is not surprising that understanding the molecular mechanisms of adaptation is one of the main goals of modern evolutionary biology (Barrett and Hoekstra, 2011; Nielsen, 2005; Savolainen et al., 2013). Despite this, the molecular basis, the tempo and mode of adaptation are still poorly understood for most cases, especially for non-model organisms (Barrett and Hoekstra, 2011; Nielsen, 2005; Savolainen et al., 2013).
The revolution of next-generation sequencing (NGS) on the past years have contributed significantly to improve our knowledge on the mechanisms of adaptation by giving us access to genome-wide data (Barrett and Hoekstra, 2011; Savolainen et al., 2013; Stapley et al., 2010). This opens the door to understand the genetic basis of adaptation (how many and what genes?), and the genetic architecture of traits under selection (what regions of the genome?). Among other things, with next-generation sequencing we can study patterns at the genome level and hence we avoid the bias of choosing and focusing only on a few candidate genes (Barrett and Hoekstra, 2011), we have the power to identify adaptive mutations and to differentiate selective forces from demographic factors (Barrett and Hoekstra, 2011); and we are able to see how selection works not only at the level of genes, but also at the level of whole molecular networks (Daub et al., 2013; Foll et al., 2014). In recent years, the falling costs of sequencing have allowed to expand this type of studies to non-model organisms, namely ecological model organisms, for whom the main traits involved in adaptation are known but identifying their genetic basis was challenging due to a lack of genetic tools (Stapley et al., 2010).
Adaptation can be studied with a bottom-up approach, where we start by identifying putative adaptive genes through molecular signatures and then try to identify their phenotypic effects (Barrett and Hoekstra, 2011). Two common approaches to identify these putative adaptive genes are (i) population genetics and (ii) comparative genetics (Nielsen, 2005). Population genetics use data on the variation of the allelic frequency of polymorphic genetic markers within and between populations, to detect patterns consistent with the action of selection within or across populations. Comparative genetics, on the other side, uses data on the differences on gene sequence between species to detect patterns of past selection in one or more species. This last approach relies mostly, but not only, on comparing the number of non-synonymous and synonymous substitutions (dN/dS ratio) present in a gene to measure the strength and mode of selection acting on protein coding genes at a genomic scale (Jeffares et al., 2015). The idea behind this test, which is only applicable to the protein coding sequencing of a gene, is that non-synonymous substitutions (dN) are substitutions that change the aminoacid sequence of the protein and hence are considered potentially under
- 15 -
selection, while synonymous substitutions (dS) are substitutions that do not alter the aminoacid sequence of the protein and hence are considered neutral. When this ratio, also denominated ω, is less than one (ω<1), it indicates purifying selection, as the proportion of non-synonymous is lower than the synonymous substitutions; a ω = 1 indicates neutral evolution as both non-synonymous and synonymous substitutions occur at the same rate; and a ω >1 indicates positive selection as the rate of non-synonymous substitutions is larger than the synonymous substitutions (Jeffares et al., 2015; Nielsen, 2005). This statistic can be obtained at different levels from gene-wide to site-level, which can be used to answer different questions, such as: what genes are under purifying/positive selection? And in more detail, what are the sites under selection? Or, what are the branches in the gene tree under selection?
One type of NGS data for which the comparative genetics approach has been used to study adaptation is to sequence RNA of transcripts expressed at cells from different tissues, a technique known as RNA-seq that generates transcriptomic data (Baker et al., 2018; Cicconardi et al., 2017; Ghiselli et al., 2018; Yang et al., 2012; Zhao et al., 2014). Besides the great amount of gene transcripts present on the transcriptome, two other traits make this type of NGS data ideal for comparative analysis: 1) the fact that sequences from protein coding genes are easy to filter through the polyA tail of mRNA, and hence we can target gene sequences with high certainty; and 2) the fact the transcript sequences on the transcriptome are from processed mRNA and therefore, for each gene we obtain the final CDS sequence without intronic regions. Nonetheless using transcriptomic data for comparative analysis also presents a significant challenge for the identification of orthologous sequences due to the presence of alternative splicing (Breschi et al., 2017; Zambelli et al., 2010). Orthology identification is usually based on sequence similarity to identify ortholog sequences between species. Since splicing isoforms only diverge on the alternative spliced exons, different splicing isoforms of the same transcript can end up on the alignments of orthologous transcripts and bias the results of comparative analysis due to the presence of different exons between species. This is a very relevant issue considering that alternative splicing is a widespread phenomenon across the transcriptome, estimated to affect more than 90-95% of genes on humans (Pan et al., 2008; Wang et al., 2008; Zambelli et al., 2010). Some transcriptomics studies deal with alternative splicing by using methods to cluster very similar sequences on the transcriptome and then select only the longest or more expressed sequence of each cluster (Cicconardi et al., 2017; Jesus et al., 2016; Kong et al., 2014; Machado et al., 2015; Wang et al., 2017). However, this approach is based on the assumption that the expressed transcript isoforms are the same across all species. Considering the dynamic nature of the transcriptome, this might not be true for all of the transcripts, especially for studies using transcriptomes that come from public repositories where the organs, life stage, and conditions on which the transcriptomes were sequenced, and the protocols used for the sequencing of the transcriptomes are not necessary the same. Nevertheless, RNA-seq and transcriptomic studies allow to perform comparative genetic studies, even for non-model organisms with large genomes.
- 16 -
Two types of biological models are commonly used in studies of adaptation. One are species/populations on contrasting environments and with contrasting traits, and the other are species/populations distributed along environmental clines that exhibit a corresponding clinal variation on certain traits (Barrett and Hoekstra, 2011). Understanding the genetic basis of the differences between these populations/species can give us insights in to the molecular process of adaptation to their environments (Barrett and Hoekstra, 2011).
In Portugal, the cyprinids from the genus Squalius are a very well studied group of freshwater fishes that are distributed from North to South of the country along an environmental cline of temperature, which is reflected on a cline of external morphology traits, namely size, number lateral line scales, number of fin rays and number of gill rakers (Coelho et al., 1998). Currently, besides the Squalius alburnoides complex, there are four Squalius species in Portugal, S. carolitertii, S. pyrenaicus, S.torgalensis and S.aradensis. All of which are endangered except for S. carolitertii (Henriques et al., 2010; Machado et al., 2015; Mesquita et al., 2005). S. carolitertii is found in the Lima, Douro, Vouga and Mondego basins; S. pyrenaicus is found in the Samarra, Colares, Tagus, Sado, Guadiana, Almargem and Quarteira; S. torgalensis is found in the Mira drainage and S. aradensis in the Arade, Seixe and Quarteira drainages (Coelho et al., 1995, 1998), (Figure 1.1). Moreover, these species inhabit the two climatic types that exist in the Iberian Peninsula: Atlantic, with mild temperatures and a stable climate; and Mediterranean, which is characterized by strong seasonal cycles, with high temperatures and droughts in summer (Carvalho et al., 2010; Henriques et al., 2010; Magalhaes et al., 2003). Species at the north of the Iberian Peninsula like S. carolitertii and the Tagus population of S. pyrenaicus are under the influence of the Atlantic climate type, while species at the south like the Guadiana S. pyrenaicus, S. torgalensis and S. aradensis are under the influence of the Mediterranean climate type (Jesus et al., 2016, 2017).
Squalius species have been investigated in controlled conditions in the laboratory in recent studies (Jesus
et al., 2016, 2017) to test the response of S. carolitertii and S. torgalensis to a predicted scenario of climate change for the end of the century, focusing on temperature and pH changes (Jesus et al., 2016, 2017). These two species inhabit the two climatic types, S. carolitertii in the Atlantic and S. torgalensis in the Mediterranean (Jesus et al., 2017). The authors studied a set of fourteen target genes, obtained from previous
- 17 -
Figure 1.1 - Distribution of the four Squalius species in Portugal.
studies on acute thermal stress on these species (Jesus et al., 2016), using two different approaches: 1) measure gene expression response on individuals from both species exposed to different experimental controlled conditions in the laboratory of warming and/or acidification; 2) studying the predicted effects of the fixed substitutions on these genes between the two species in the structure and physicochemical properties of the proteins they code for. The authors found that the gene expression of these 14 genes was significantly different among temperature/pH conditions in S. carolitertii (the northern species) but that S.
torgalensis (the southern species) gene expression was mostly unchanged. Together with these results they
found that the predicted thermostability in proteins related with thermal response (HSP90) and with immunity (GBP1) is higher for S. torgalensis, and that there are structural differences in genes related with thermal response (HSC70 and FKBP52), immunity (GBP1) and glucose methabolism (HIF1α). These results led the authors not only conclude that S. torgalensis has a greater tolerance to warming and acidification than S. carolitertii, but also to postulate that such increased tolerance result from adaptation to higher temperatures characteristic of Mediterranean climate, resulting from changes at the protein level on
S. torgalensis. Even though the authors did not perform any type of selection tests based on molecular data
(namely dN/dS) to test this hypothesis, other data from the group has shown evidences of adaptive convergence for some genes in the southern species (Coelho et al., unpublished data).
S. carolitertii S. pyrenaicus S. torgalensis S. aradensis
- 18 -
Taken together, the evidences of molecular adaptation found in previous works, the distribution of these species along an environmental cline, their clinal variation on traits of external morphology and the existence of some genomic tools, make this group of freshwater fishes an interesting model for the study of molecular adaptation. Therefore, the main goal of this thesis is to study the signatures of positive selection across the transcriptome and the phylogeny of Western Iberian Squalius freshwater fishes. To accomplish this, we defined three specific goals:
1) To develop a bioinformatics pipeline to identify orthologous genes across the transcriptomes of different species and use them to test for positive selection. The aim is that this pipeline takes into account alternative splicing and duplicated genes, thus enabling us to use transcriptomic data from different species obtained from different organs for comparative sequence analysis.
2) To characterize, for the first time, the signatures of positive selection across the phylogeny of these species at the transcriptome-level, using a branch-site dN/dS test to look for signatures of positive selection not only at the tips of the species tree (i.e. on the branches of extant species), but also on their ancestor species (i.e. the internal branches of the species phylogeny). For these tests we also inferred gene trees for each orthologous gene, allowing us to characterize the transcriptome-wide relationships between species.
3) To use functional enrichment analysis to gain insights about the molecular and biological functions that were under positive selection through time across the phylogeny of these species. We tested if biological processes of genes under positive selection were associated with particular branches of the species tree, to obtain a general view about adaptation of the Squalius clade through time.
This comparative transcriptomic study allowed us to identify the genes and biological functions that were involved in adaptations at different points in the evolutionary history of these species. Besides its fundamental relevance, understanding the action of natural selection through the phylogeny can also have practical implications, like helping to predict their potential response to future environmental changes.
- 19 -
2. Methods
2.1 RNA Seq data
In this study we combined newly generated RNA-seq data with available RNA-seq data from previous studies (Table 2.1). Regarding the new data, it includes data from the Iberian freshwater fish Squalius
aradensis and Squalius pyrenaicus from Tagus and Guadiana populations. Regarding the available data
from previous studies, these included libraries of: S. carolitertii and S. torgalensis (Genomic Resources Development Consortium et al., 2015a); S. pyrenaicus from the Guadiana population (brain and gonads) (Genomic Resources Development Consortium et al., 2015b); Leuciscus burdigalensis (Genomic Resources Development Consortium et al., 2015c), which was used as a close outgroup since Leuciscus is a sister clade to Squalius (Stout et al., 2016); S. alburnoides from the AA genomotype (Matos et al, in prep), whose genome should be similar to the genome of its Anaescypris-like parental, and hence was used as another outgroup; and finally the Danio rerio CDS (Howe et al., 2013) ,which was used as the basal outgroup, as well as the source of gene annotations. It is noteworthy that for simplicity, we will be using the term “species” for all of these samples including the Tagus and Guadiana populations from S. pyrenaicus. This is also because recent studies suggest that these two populations are likely paraphyletic in relation to S.
carolitertii (Sousa-Santos et al., 2019; Waap et al., 2011).
2.1.1 Newly sequenced transcriptomes
2.1.1.1 - Sampling
The S. aradensis specimens were captured by electrofishing (performed with low duration pulses to avoid killing juveniles, 300V and 2-4A) from the Odelouca stream in the Arade basin (37º17'0.53''N; 8º29'7.31''W). The individuals were anesthetised and euthanized with an overdose of tricaine mesylate (400 ppm of MS-222; Sigma-Aldritch, St. Louis, MO, USA). Organs were stored in RNAlater® at -80ºC until further use. We also used tissue samples from individuals of S. pyrenaicus previously sampled on the Tagus and Guadiana basins (Matos et al., 2015) which were preserved at -80ºC. The fishes from the Tagus population came from the Portuguese river Ocreza from the Tagus basin (39º43'48.23''N; 7º45'38.13''W), while the fishes from the Guadiana population came from de Oeiras stream from the Guadiana basin (37º37'30.30"N; 7º48'37.03"W) (Matos et al., 2015).
- 20 - 2.1.1.2 - RNA extraction
RNA was extracted from four individuals for each of the three samples from S. aradensis and S. pyrenaicus mentioned above. For both S. pyrenaicus populations RNA was extracted from muscle. For S. aradensis, RNA was extracted from brain tissue because it was the only tissue available in good conditions for this species. Tissue Ruptor (Qiagen, Valencia, CA, USA) was used to homogenize the organs and afterwards RNA was extracted using the Total RNA Purification Kit (Norgen Biotek Corp., Thorold, ON, Canada) according to the manufacturer's instructions. RNA concentration was measured on Qubit® 2.0 Fluorometer (Thermofisher Scientific, Waltham, MA, USA) and its quality (RNA quality number – RQN and 28S/18S)
evaluated using AATI Fragment Analyzer (Advanced Analytical Technologies, Inc.). Once confirmed the good quality of the RNA libraries, these were pooled per species and then stored on dry powder at room temperature using the GenTegra-RNA Kit (GenTegra® LLC., Pleasenton, CA, USA) for shipment to the Beijing Genomics Institute (BGI, Hong Kong, China) to be sequenced. Once at BGI, Agilent 2100 Bioanalyzer (Agilent RNA 6000 Nano Kit) was used to confirm the quality of the samples (measuring the RNA concentration, RIN value, 28S/18S and fragment length distribution).
2.1.1.3 - Library preparation, sequencing and read cleaning
Library preparation and sequencing was performed in outsourcing at BGI as follows: 1) mRNA was isolated from total RNA using the oligo(dT) method to isolate poly(A) RNA; 2) mRNA was fragmented; 3) first and second cDNA strands were synthesized; 4) cDNA fragments were purified and resolved with EB buffer for end reparation and poly(A) tail addition; 5) cDNA fragments were connected with adapters; 6) cDNA fragments of suitable size were selected for PCR amplification; 7) the quality and quantity of those libraries was evaluated using Agilent 2100 Bioanalizer and ABI StepOnePlus Real-Time PCR System; and 8) finally libraries were sequenced using Ilumina HiSeq 4000 to generate 100 bp paired-end reads.
The sequencing resulted in 11.5 GB of raw reads, which were filtered at BGI by discarding reads with adaptor sequences, reads with more than 5% of unknown bases (N) and reads with 30% or more of the bases with a Phred base score lesser than 15. This resulted in 11 GB of cleaned reads that together with the raw reads were stored in FASTQ format. Once we received this data, we confirmed the quality of the clean reads independently using FastQCv0.11.7 (https://www.bioinformatics.babraham.ac.uk/projects/fastqc/).
- 21 -
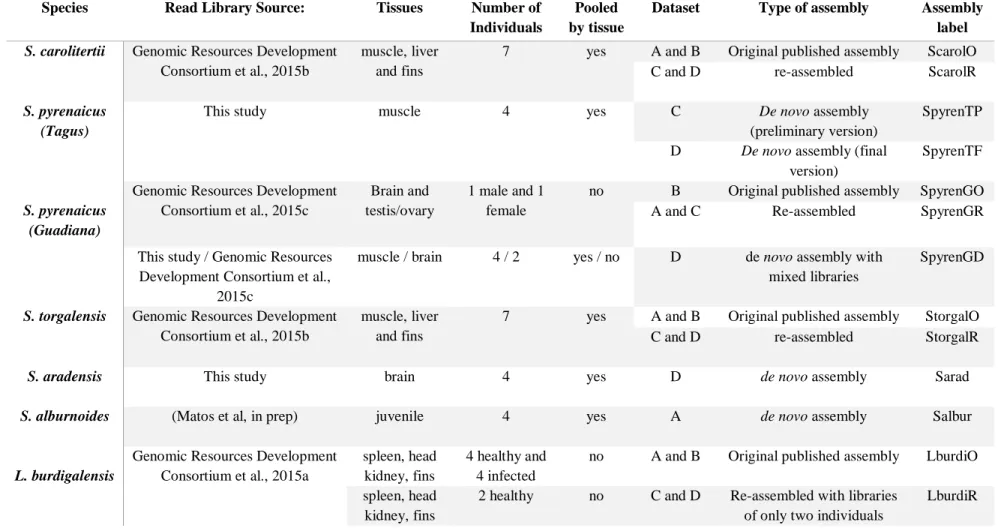
Table 2.1 – Transcriptomic data for each transcriptome assembly used in this study.
Species Read Library Source: Tissues Number of
Individuals
Pooled by tissue
Dataset Type of assembly Assembly
label
S. carolitertii Genomic Resources Development Consortium et al., 2015b
muscle, liver and fins
7 yes A and B Original published assembly ScarolO C and D re-assembled ScarolR S. pyrenaicus
(Tagus)
This study muscle 4 yes C De novo assembly
(preliminary version)
SpyrenTP D De novo assembly (final
version)
SpyrenTF
S. pyrenaicus (Guadiana)
Genomic Resources Development Consortium et al., 2015c
Brain and testis/ovary
1 male and 1 female
no B Original published assembly SpyrenGO A and C Re-assembled SpyrenGR This study / Genomic Resources
Development Consortium et al., 2015c
muscle / brain 4 / 2 yes / no D de novo assembly with mixed libraries
SpyrenGD
S. torgalensis Genomic Resources Development Consortium et al., 2015b
muscle, liver and fins
7 yes A and B Original published assembly StorgalO C and D re-assembled StorgalR
S. aradensis This study brain 4 yes D de novo assembly Sarad
S. alburnoides (Matos et al, in prep) juvenile 4 yes A de novo assembly Salbur
L. burdigalensis
Genomic Resources Development Consortium et al., 2015a
spleen, head kidney, fins
4 healthy and 4 infected
no A and B Original published assembly LburdiO spleen, head
kidney, fins
2 healthy no C and D Re-assembled with libraries of only two individuals
- 22 -
2.1.2 – Published transcriptomes
We had direct access to cleaned reads for S. carolitertii, S. torgalensis and S.pyrenaicus from the Almargem River (Guadiana basin), available from previous studies (Genomic Resources Development Consortium et al., 2015a, 2015b) on the following online repositories: S. carolitertii and S. torgalensis on NCBI SRA, under the project accession numbers SRP049802 and SRP049801, respectively; and S.
pyrenaicus on the European Nucleotide Archive under the study accession number PRJEB9465. We also
had access to cleaned reads from S. alburnoides AA form from an unpublished RNA-seq study (Matos et al, in prep). Cleaned reads from healthy L. burdigalensis individuals were downloaded from NCBI SRA with the project accession number SRP049407 (Genomic Resources Development Consortium et al., 2015c), using “fastq-dump” from the SRA-Toolkit v2.8.2.1 (Leinonen et al., 2011). Finally, we also downloaded the the Danio rerio database of predicted coding sequences by Ensembl, using the GRCz10 genome assembly of Danio rerio (Howe et al., 2013) .
2.2 – Datasets
Four different transcriptome datasets were used during this study. The different datasets correspond to the chronological order in which they were analysed due to the timing at which we received the RNA-seq data from BGI (the latest being received on September 2018). Moreover, based on results we were getting we also made some adjustments in the datasets through time. The four datasets used were (Table 2.2):
- Dataset A, where we prioritized transcriptome assemblies created with the same software (Trinity).
When species had no published transcriptome assembly or, if available, were not assembled with Trinity, we performed a de novo assembly. We used the following data: 1) three published transcriptome assemblies from S. carolitertii (ScarolO), S. torgalensis (StorgalO) and L. burdigalensis (LburdiO); 2) one de novo re-assembly of the published transcriptome of the Guadiana S. pyrenaicus (SpyrenGR); 3) One de novo assembly of the unpublished S. alburnoides from the AA genomotype (Salbur); and used 4) the D. rerio CDS database as outgroup and source of gene annotations. For dataset A we ensured that all datasets were generated with the same software, using default settings. - In Dataset B, we changed the outgroup species and changed the approach by using the transcriptome
assemblies as published in their original studies. Thus, Dataset B was the same as Dataset A but without the S. alburnoides and using the published Guadiana S. pyrenaicus assembly (SpyrenGO), instead of our Trinity re-assembly.
- In Dataset C, we included new data and de novo re-assembled all the transcriptomes ourselves using
- 23 -
(ScarolR), S. pyrenaicus from Guadiana (ScarolGR), S. torgalensis (StorgalR) and L. burdigalensis (LburdiR). In the case of L. burdigalensis we only assembled libraries from 2 out of 8 individuals due to computational limitations; 2) de novo assembled the preliminary RNA-seq data of the newly sequence Tagus S. pyrenaicus transcriptome; 3) we included the D. rerio coding sequence (CDS) database to use as outgroup and source of gene annotations.
- Dataset D was similar to C, but included all the newly sequenced RNA-seq data. It differed from
Dataset C on: 1) the Tagus S. pyrenaicus, since we used the final RNA-seq data (SpyrenTF) instead of the preliminary data; 2) the Guadiana S. pyrenaicus, since we merged the published brain library with our newly sequenced muscle library (SpyrenGR); 3) the new RNA-seq data of S. aradensis. Just as in Dataset C, all the published transcriptomes were de novo re-assembled using exactly the same settings as used for the de novo assemblies.
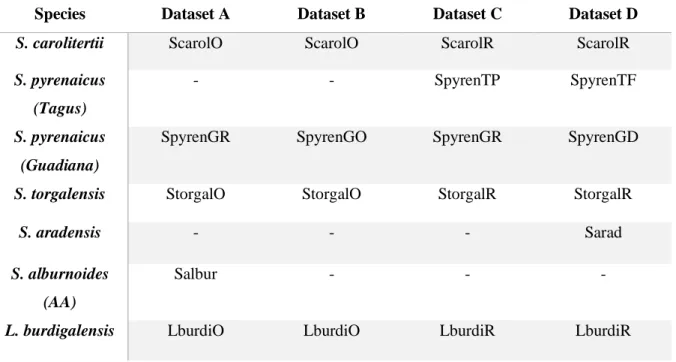
Table 2.2 - Summary of the species and transcriptome assemblies used on each dataset. The symbol “-”means that species was not used for that dataset.
Species Dataset A Dataset B Dataset C Dataset D
S. carolitertii ScarolO ScarolO ScarolR ScarolR
S. pyrenaicus (Tagus)
- - SpyrenTP SpyrenTF
S. pyrenaicus (Guadiana)
SpyrenGR SpyrenGO SpyrenGR SpyrenGD
S. torgalensis StorgalO StorgalO StorgalR StorgalR
S. aradensis - - - Sarad
S. alburnoides (AA)
Salbur - - -
- 24 -
2.2 – Bioinformatic pipelines for identification of orthologs with
signatures of selection
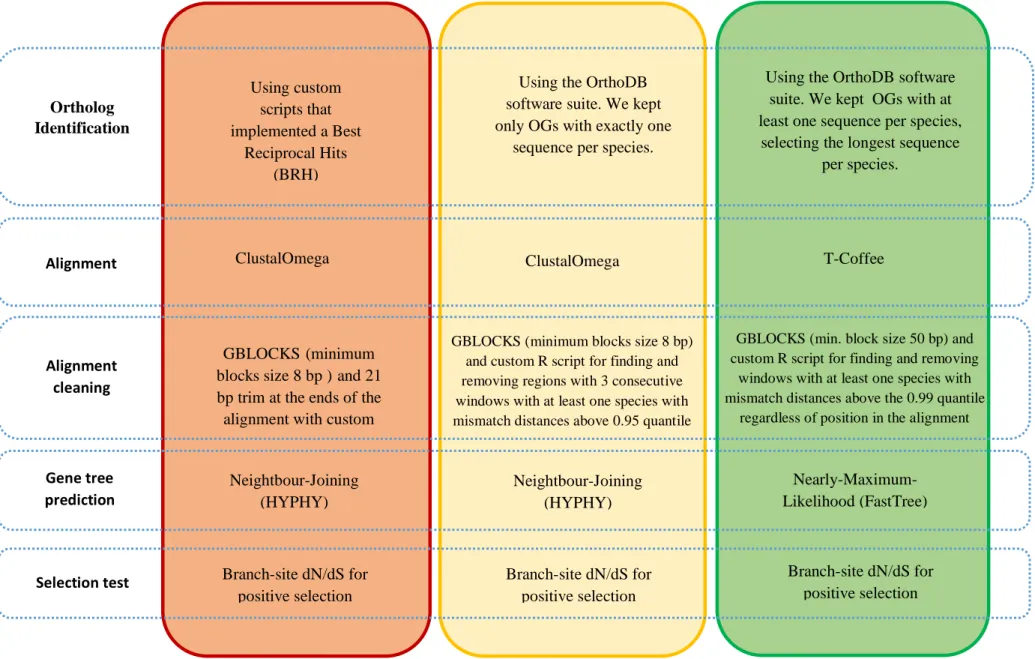
To detect signatures of positive selection on orthologous sequences without being affected by high rates of false positives or low number of orthologs, we needed a bioinformatic pipeline to 1) identify of orthologous sequences between the transcriptomes of our species, 2) obtain good quality clean alignments of the orthologous sequences, and 3) perform comparative analysis on these alignments, namely positive selection tests. We developed three different pipelines to achieve this, each one improving on the previous one. For simplicity we named these pipelines per order of development as Pipeline 1, Pipeline 2 and Pipeline 3 (Figure 2.1). Pipeline 1 used simple approaches for ortholog identification and transcript isoform filtering that are commonly used on comparative studies, and was loosely based on the bioinformatic pipeline used by Wang et al., to do phylogenetic analysis on the transcriptome of four luminescent beetles (Wang et al., 2017). Pipeline 2 used a more sophisticated method for ortholog identification than Pipeline 1 and dealt better with splicing isoforms, but it was too conservative. Pipeline 3 was based on Pipeline 2 but was less conservative while still dealing with the splicing isoforms, having several improvements and corrections compared to Pipeline 2. Pipeline 3 was the final version of our bioinformatic pipeline, and the dataset of orthologous sequences with signatures of selection identified with this pipeline was used for further analysis (see below). For the chronological reasons mentioned previously, for each pipeline we used different transcriptome datasets: for Pipeline 1 we used Dataset A; for Pipeline 2 we used Dataset B; and for Pipeline 3 we used Dataset C and D. Next, we describe the various steps that composed these pipelines and how they differ from each other, giving special emphasis to Pipeline 3.
2.2.1 – De novo transcriptome assembly
We performed de novo assembly of transcriptomes in Pipeline 1 (Dataset A) and in Pipeline 3 (Dataset C and D), i.e. we assembled the transcriptomes without using a reference genome. We used Trinity v2.5.1 (Grabherr et al., 2011) with default settings (kmer size = 25, minimum kmer coverage = 1, minimum contig length = 200 bp). Regarding the process of assembly, Trinity algorithm involves three steps. First, find the full sequence of the dominant isoform of a transcript and the unique sequences of the alternative isoforms. Second, cluster those sequences and construct a de Brujin graph per gene, or cluster of similar genes. Finally, process these graphs to find overlapping sequences to infer the full sequence encompassing all isoforms of a transcript, attempting to distinguish isoforms from paralogous genes. To avoid any potential bias of comparing transcriptomes assembled with different versions of Trinity, different settings or even different assemblers, on Pipeline 3 (Dataset C and D) we also de novo re-assembled all the species that had published
- 25 -
transcriptome assemblies using the same settings as above. Because our goal was to obtain homologous gene sequences across species ignoring gene expression levels, pooling data from different organs did not pose any problems to our analyses. Thus, to increase the power of the assembly algorithm, we assembled together all the RNA-seq libraries from each species, independently of whether they came from different tissues or samples, following the suggestion on Trinity’s manual. It is noteworthy that to improve the coherence of the organs used on our assemblies, on Dataset D we re-assembled the S. pyrenaicus from Guadiana without the gonads library and adding our newly sequenced muscle library.
In all the three pipelines, we included a step to evaluate the completeness and quality of the resulting transcriptome assemblies. This was done using BUSCO v3.0.2b (Simão et al., 2015; Waterhouse et al., 2017) and TransRate v1.0.3. (Smith-Unna et al., 2016). BUSCO assesses the completeness of a genome or transcriptome assembly by comparing it against databases of universal single-copy orthologs for a given evolutionary lineage. For the assessment of the completeness of our six transcriptomes we selected the Actinopterygii (ray-finned fishes) database, which was the most specific lineage available in BUSCO that encompassed our species. TransRate is a tool used to evaluate the quality of de novo transcriptome assemblies using only the reads and the assembly as input, and computing several quality metrics, such as N50, which can be used as a quality metric that gives an estimate of the distribution length of the resulting assembled fragments (contigs).
2.2.2 – Contig redundancy removal (Unigene identification)
A common step in transcriptomic studies data is the obtention of a unigenes dataset, i.e a dataset with only one sequence representing each gene per species. The goal is to filter all but one isoform per transcript (usually the longest or the most expresed) in order to simplify downstream analysis. For Pipeline 1 and Pipeline 2 we used CD-HIT-EST v4.6.8 (Fu et al., 2012), which implements a common approach of clustering sequences by similarity, keeping only the longest contig for each cluster. We ran CD-HIT-EST with a similarity threshold value of 0.80 for Pipeline 2, since in our testing this value seemed to eliminate most of the alternative splicing on the transcriptome assemblies. However, since CD-HIT-EST takes longer to run with lower values of similarity threshold, on Pipeline 1, due to time constrains we were only able to run CD-HIT-EST with a similarity threshold of 0.80 for the Guadiana S. pyrenaicus assembly, and 0.85 on the S. torgalensis. On Pipeline 3 we used a more sophisticated step to jointly detect unigenes and orthologous during the ortholog identification step (see below), and hence this step was not required.
- 26 -
2.2.3 – Open Reading Frame (ORF) identification
We built a CDS database for all the transcriptome assemblies in a given dataset by predicting the Open Reading Frames (ORFs) of all the unigenes on the assemblies. This was done using TransDecoder v5.0.2 (https://github.com/TransDecoder/TransDecoder/wiki), considering a minimum sequence size of 300 bp and running the TransDecoder.LongOrfs and TransDecoder.Predict modules. In order to be able to use this CDS dataset for downstream analysis we trimmed the TransDecoder header and simplified the sequences headers using a custom Bash script (Supplementary Folder 2.1).
2.2.4 - Ortholog identification and annotation
To identify orthologs groups (OG) of sequences between the transcriptomes and Danio rerio CDS databases we used two different approaches. For Pipeline 1 we wrote custom Bash and R scripts (Supplementary Folder 2.1) that implemented a Best Reciprocal Hits (BRH) methodology to find OGs using tools from BLAST 2.6.0 + (Camacho et al., 2009). This approach is based on the simple principle that orthologous sequences across two transcriptomes should be reciprocal best matches of each other when using local alignment search tools like BLAST. It also assumes that if there are other sequences with comparable similarity scores, then they are very likely paralogous, and hence those sequences should be removed from further analysis. However, BRH does not guarantee that paralogous genes are discarded if for example the true ortholog of a sequence in one transcriptome was not sequenced on all the other transcriptomes. In that case paralogous genes from those transcriptomes could be the best reciprocal hits.
In order to increase our confidence that the dataset contained only true orthologous, reducing the possibility of including paralogous, we considered a more sophisticated approach. Thus, for Pipeline 2 and 3 we used the OrthoDB suite v2.3.1, which is based on the pipeline used for the creation of the database of ortholog groups ORTHODB v.9.1. (Zdobnov et al., 2017). This pipeline works by: 1) finding the best reciprocal hits (BRH) of genes between assemblies; 2) searching for BRH within the assemblies that are more similar than the BRH between assemblies – these are called in-paralogs and should represent gene duplications after the speciation event; 3) combine the results of the two previous steps to create clusters of orthologous sequences, the orthologous groups (OGs), which theoretically should descend from a single gene in the ancestral of all the species (Kriventseva et al., 2015). We ran the OrthoDB pipeline with default settings except that we used Blast+ v2.7.1 (Camacho et al., 2009), which is a faster alignment algorithm than the default.
We processed the output of ORTHODB with custom scripts, which allowed us to jointly detect orthologous unigenes. First, for each ortholog group identified, we obtained the OrthoDB IDs of all the
- 27 -
sequences belonging to that group. Then, for each species, those OrthoDB IDs were mapped to the corresponding sequence ID on the transcriptome assembly. We only considered ortholog groups with at least one sequence per species. Due to isoforms, some orthologs groups had more than one sequence per species, and in these cases we kept only the longest sequence per species. Because we were working with the transcriptome instead of the genome, these similar sequences were most likely isoforms rather than gene duplications. By choosing the longest sequence we aimed to keep the most informative isoforms for the downstream analysis to detect selection. It is important to notice that despite of this approach being more sophisticated than a simple BRH, and in theory being more accurate, there is still no guarantee that we kept the same isoform for each species in every OG identified. We addressed this potential confounding factor in a trimming step after the alignment of the OG sequences from different species (see below).
Finally, we created a BLAST custom database for each transcriptome with the makeblastdb module from Blast+ v2.7.1. Given the transcriptome ID of each ortholog group we obtained the sequences from the transcriptomes databases with the blastdbcmd module of Blast+, as a fasta file per ortholog group with the unaligned sequence of each species. For each ortholog group we assumed that the Danio rerio sequence annotation corresponded to the annotation of sequences on the ortholog group.
2.2.5 – Ortholog group (OG) sequence alignment
Having our dataset of orthologous groups (OGs) between our transcriptomes, we proceeded to aligning them. In Pipeline 1 and Pipeline 2 we aligned the sequences of the OG using ClustalOmega v.1.2.4 (Sievers et al., 2011) with default settings. In Pipeline 3 we performed this step using T-COFFEE v11.00 (Notredame et al., 2000). This is because T-COFFEE preserved the integrity of the ORFs better than ClustalOmega, since it performs the nucleotide alignment accounting for the protein sequences (options -other_pg seq_reformat -action +translate command on T-COFFEE). We aligned our sequences using the fM-COFEE algorithm, a fast version of the M-COFFEE algorithm (Wallace, 2006) which only uses three fast aligners to create a consensus: MUSCLE (Edgar, 2004), MAFFT (Katoh et al., 2002) and Kalign (Lassmann and Sonnhammer, 2005). Finally, we used the “-other_pg seq reformat -action +thread_dna_on_prot_aln” options to map the nucleotide sequences on the protein alignments and obtain the multispecies nucleotide alignments for each OG, with one sequence per species.
- 28 -
2.2.6 – Cleaning orthologous group (OG) alignments
After obtaining the OG alignments, we used used GBLOCKS v0.91b (Castresana, 2000; Talavera and Castresana, 2007) to remove gaps and poor quality alignment regions. GBLOCKS algorithm involves the following steps: 1) finding blocks within the alignment with conserved flanking regions; 2) removing regions with too many contiguous nonconserved positions; 3) by default, removing gap positions; 4) removing blocks that are too small. For Pipeline 1 and Pipeline 2 we ran GBLOCKS in codon mode, with all settings on default, namely not allowing gap positions on the blocks, a minimum block length of 10 bp, and a maximum number of contiguous nonconserved positions of 8 bp. For Pipeline 3 we ran GBLOCKS with the same settings, except for the minimum block length which we changed to 50 bp because we found that a lower value allowed short conserved blocks within poor quality regions to be kept on the aligments, which could lower the overall quality of the alignment.
GBLOCKS algorithm works by detecting the overall conservation of regions of the alignment. This has the undesired effect that if few individual sequences are completely misaligned, that region could still be considered conserved by the algorithm provided that the other sequences are conserved (Castresana, 2000). This can lead to incorrectly keeping misaligned OGs, which in downstream analyses could result in false signatures of positive selection. A careful visual inspection of random alignments indicated that this happened in some of our alignments. The misalignments however did not occur randomly across the whole alignment, but were mostly on certain regions, usually at the ends of the alignments, where one or two sequences suddenly diverged completely from the other species. Assuming this could be the result of a low quality of some sequences at the ends, we tried to remove such regions by creating a custom script to trim the ends of the alignments, removing 21 bp at each end (Pipeline 1). However, we found that the misaligned regions could have far more than 21 bp of length and that misalignments could also occur in the middle of the sequence. Notoriously, there were cases when two sequences were misaligned on the same region but were aligned between themselves. These patterns resemble what we would expected if the alignments comprised different splicing isoforms, suggesting that at least some of our OGs comprised different splicing isoforms across species. Considering that our transcriptomes came from different organs for different species, this is not surprising. Technical problems like incomplete sequencing of all the transcripts isoforms could also cause this situation. Since the algorithms of both our BRH script and OrthoDB are based on sequence similarity, in transcripts where a common isoform for all species did not exist, the more similar isoforms from each species are selected for each orthologous group, even if they were not from the same isoforms. This would result in OG alignments that would be misaligned on the regions were the alternative exons of different isoforms meet. In cases where this happened only for a couple of sequences, GBLOCKS could still fail to filter such misaligned regions. Due to the heterogeneity of the tissues where our
- 29 -
transcriptomes came from, we suspected that most OGs could contain a mixture of different splicing isoforms. For this reason, we decided not to remove all the OGs with misalignments because such an approach would potentially remove most of our OG dataset. Therefore, we developed an alternative approach as described next.
2.2.6.1 – A new approach to align OGs accounting for different isoforms across species
To remove poorly aligned regions due to a mixture of different splicing isoforms we created a custom R script. This complements GBLOCKS, by removing poorly aligned regions from the alignment that GBLOCKS was unable to detect. Assuming that these misalignments correspond to exons only found in some species (i.e. a different isoform), by discarding such regions we would thus obtain a multispecies alignment comprising only the common exons across species in the orthologous group.
The custom R script to minimize the impact of isoforms that we created involves the following steps. First, we calculate a matrix of pairwise differences (using the ratio of mismatches) between the sequences of all species against each other. These distances were calculated on windows of 48 bp along the alignments. Second, we computed the distribution of the pairwise mismatch distances between a given species and all others, across all the orthologous group alignments. Third, to detect misaligned regions, we considered that windows of 48bp with distances larger than a given quantile of the empirical distribution were outliers (0.95 for Pipeline 2 and 0.99 for Pipeline 3). On Pipeline 2, we removed regions with 3 consecutive windows of 48 bp whose pairwise mismatch distance value was superior to the 0.95 quantile for at least one species. On Pipeline 3, we took a more stringent filter removing all windows of 48 bp whose pairwise mismatch distance was larger than the 0.99 quantile at least for one species, regardless of their location on the alignment. Finally, we trimmed the first and last 18 bp of the remaining alignment to eliminate any tips of alternative exons that could still remain on the alignment. To keep only sequences with a reasonable number of sites, all resulting cleaned alignments with less than 100bp were discarded, which was done with a custom script. This is a conservative approach aiming to avoid any false positive signature of positive selection in downstream analyses due to alignment errors. However, by minimizing the probability of false positives we also increased the chances of discarding true positives, i.e. the risk of discarding divergent windows due to positive selection. The algorithm implemented in our custom R script was validated by analyzing simulated datasets where we introduced alignment errors at specific regions affecting mainly one species.