Introduction
Stand regeneration is one of the most important as-pects of silviculture as it ensures stand and production perpetuity. Regeneration occurs after one or several disturbances releasing growing space, usually after the
elimination of some adult trees. Regeneration mecha-nisms can be of two main types: by seed or vegetative (Smith et al., 1997; Oliver e Larson, 1996).
The different types of natural regeneration, though not exclusive, are associated to the stand regime. Vegetative regeneration is usually associated to coppi-ces, though it can also occur in high forest stands: for example sweet chestnut can produce coppices when the aerial part is destroyed by animals or due to other
Regeneration in multi-species in Serra da Lousã
A. C. Gonçalves
1* and A. Carvalho Oliveira
21 ICAAM. Departamento de Engenharia Rural. Universidade de Évora. Apdo. 94. 7002-554 Évora. Portugal 2 Departamento de Engenharia Florestal. Instituto Superior de Agronomia. Tajapa da Ajuda.
1349-017 Lisboa. Portugal
Abstract
Stand regeneration is one of the most important aspects of silviculture as it ensures stand and production perpetuity. Regeneration occurs after one or several disturbances releasing growing space, usually after the elimination of some adult trees. In Northern and Central Portugal many maritime pine old growth stands have natural regeneration of several broadleaved species, in particular sweet chestnut and English oak. In multi-species stands regeneration and recruitment analysis should consider both density and diversity measures. A series of permanent plots established in Serra da Lousã made it possible to characterise the existing natural regeneration and its evolution with two successive measurements in 2001 and 2009. All individuals with a diameter at breast height equal or less than 5 cm were considered as regeneration. Their recruitment was evaluated in 2009 and analysed as a function of absolute stand density measures and seven diversity indices. The results revealed that recruitment rate was high and that there was a trend towards a balance in terms of species and their proportions, while maintaining a tendency towards clustering and segregation according to the Clark and Evans and the Pielou indices, respectively.
Key words: regeneration; recruitment; multi-species stands; diversity; high forest.
Resumen
Regeneración en bosques mixtos en la Serra da Lousa
La regeneración del rodal es uno de los aspectos más importantes de la silvicultura, ya que garantiza la perpetui-dad del rodal y de la producción. La regeneración se produce después de uno o varias intervenciones para liberar el espacio de crecimiento, generalmente después de la eliminación de algunos árboles adultos. En el norte y centro de Portugal muchos rodales de pino negral de edad madura presentan regeneración natural de varias especies de fron-dosas, en particular, castaño y roble. En rodales con varias especies el análisis de la regeneración y el reclutamien-to debe tener en cuenta medidas tanreclutamien-to de densidad como de diversidad. Una serie de parcelas permanentes estable-cidas en la Serra da Lousã ha permitido caracterizar la regeneración natural existente y su evolución con dos mediciones sucesivas en 2001 y 2009. Se consideran como regenerado todos los individuos con un diámetro a la altura del pe-cho igual o inferior a 5 cm. Su reclutamiento se evaluó en 2009 y se analizó en función de medidas de la densidad absoluta de la masa y de siete índices de diversidad. Los resultados revelaron que la tasa de reclutamiento fue alta y que hubo una tendencia hacia un equilibrio en términos de especies y sus proporciones, mientras se mantiene una tendencia a la agrupación y segregación de acuerdo con los índices de Clark y Evans y el índice de Pielou, respec-tivamente.
Palabras clave: regeneración; reclutamiento; rodales multi-específicos; diversidad; bosque.
* Corresponding author: [email protected] Received: 26-11-10. Accepted: 05-08-11.
natural or human events. Seed regeneration is more frequent in high forest stands, though it can occur to a lesser extent in coppices (Fabião, 1996; Oliver e Larson, 1996; Alves, 1988; Lanier et al., 1986; Natividade, 1950).
According to Harmer (1994a,b, 1995) there has been a renovated interest in natural regeneration as a method for stand establishment. Several authors (Piussi, 1994; Davis and Johnson, 1987; Ayanz, 1986; Lanier et al., 1986) state that natural regeneration is an interes-ting restocking method, from the economically, sil-viculturaly and ecologically point of view. This type of regeneration is especially important in ecologi-cally sensitive areas and/or zones with of great land-scape value, where the visual impact has to be consi-dered.
Evans (1988) states that, in silvicultural terms, the reasons for the interest in natural regeneration are: its capacity to occupy small areas, protection of natural regeneration by adult trees and as a potential source of species different from the existing main species. In addition, natural regeneration has many possibilities of becoming eff icient through time, due to multiple seed productions, especially if favoured by adequate silvicultural practices (McDonald and Abbott, 1994; Ayanz, 1986).
Many references can be found about regeneration processes and conditions (Kathke and Bruelheide, 2010; Barja et al., 2009; Maltez-Mouro et al., 2009; Kabrick et al., 2008; Darabant et al., 2007; Oliver, 2007; Bolte and Villanueva, 2006; Paluch, 2005; Oliver, 2003; Rozas, 2002; Page et al., 2001; Burschel et al., 1992) as well as to stand diversity analysis (Ruprecht et al., 2010; Graz, 2004; Pommerening, 2006; Pommerening, 2002; Pretzsch, 1998).
The goal of this study is to analyse absolute stand density measures and diversity of regeneration and recruitment, in maritime pine (Pinus pinaster Aiton.) old growth stands with natural regeneration of seve-ral broadleaved species, in particular sweet chestnut (Castanea sativa Miller.) and English oak (Quercus robur L.).
Material and methods
Data
Serra da Lousã is a mountainous range (40° 04’ 51’’ N and 8° 14’ 44’’ W) about 250 km northeast of Lisbon.
This forest area is mainly composed of maritime pine (Pinus pinaster Aiton.) stands, pure about 12.1% of the total area and mixed with sweet chestnut (Castanea sativa Miller), about 40.1% of the total area. Other softwood and hardwood species are also present in pure or mixed stands, namely Douglas f ir (Pseudotsuga menziesii Franco.), Mexican cypress (Cupressus lusi-tanica Miller.), Lawson cypress (Chamaecyparis lawsoniana Parl.), English oak (Quercus robur L.), red oak (Quercus rubra L.), wild cherry (Prunus avium L.), beech (Fagus sylvatica L.) and Tasmanian blue gum (Eucalyptus globulus Labill.) (Gonçalves, 2003). Mixed maritime pine and sweet chestnut stands are characterised by old growth maritime pine trees in the superior and intermediate layers and several broad-leaved and softwood species of natural regeneration in the intermediate and inferior layers, especially sweet chestnut and English oak. The stands are high forest, but some coppices are also present, mainly of sweet chestnut (Gonçalves, 2003).
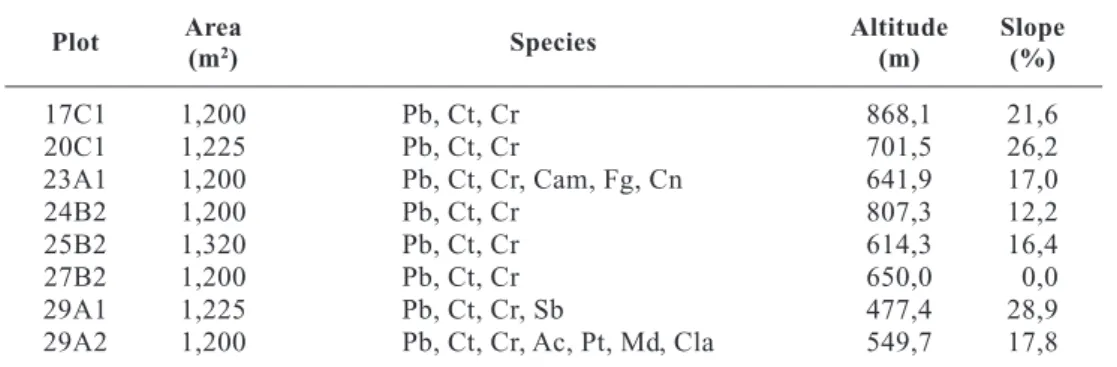
The data set is composed of 8 plots, situated in the mixed maritime pine and sweet chestnut stands, with the characteristics shown in Table 1. In these plots, dendrometric parameters of all the trees, namely diameter at breast height, total height and crown radii in 4 directions (North, South, East and West) were measured in 2001 and 2009, and the coordinates were registered in 2001.
After the first measurement, cuttings were carried out, in order to promote a transformation process towards the increase of broadleaved species. The se-lection cuttings, of low intensity, removed mainly maritime pine individuals. The best poles of sweet chestnut coppices, namely straight stems, vigorous crowns and those with expected high growth rates were selected to be maintained and the other poles were removed. As the stand density and diversity measures did not showed significant differences (Wilcoxon test for a significance level of 0.05) before and after the cuttings, the effect of the cuttings has been considered not to affect the analysis.
Methods
The main stand was defined as all individuals with greater than 5 cm diameter at breast height. As all trees were measured in 2001 it was possible to evaluate the recruitment in 2009, that is the individuals that attained a diameter at breast height greater than 5 cm in 2009.
The recruitment was analysed as a function of abso-lute density parameters: number of trees per hectare (N), basal area per hectare (G) and ground cover (GC), the latter calculation assuming the crown has a circular projection whose radius is the arithmetic mean of the four measured crown radii. To evaluate diversity seven diversity indices (Table 2) were used to characterize
the horizontal and spatial distribution of the individuals in multi-species stands (Gilliam, 2002; Neumann and Starlinger, 2001; Staudhammer and Lemay, 2001; Biber and Weyerhaeuser, 1998).
The absolute density measures and the diversity in-dices for regeneration, in 2001, and recruitment, in 2009, as well as for the main stand, in 2001, were
statis-Table 1. Plot characterisation
Plot Area Species Altitude Slope
(m2) (m) (%) 17C1 1,200 Pb, Ct, Cr 868,1 21,6 20C1 1,225 Pb, Ct, Cr 701,5 26,2 23A1 1,200 Pb, Ct, Cr, Cam, Fg, Cn 641,9 17,0 24B2 1,200 Pb, Ct, Cr 807,3 12,2 25B2 1,320 Pb, Ct, Cr 614,3 16,4 27B2 1,200 Pb, Ct, Cr 650,0 0,0 29A1 1,225 Pb, Ct, Cr, Sb 477,4 28,9 29A2 1,200 Pb, Ct, Cr, Ac, Pt, Md, Cla 549,7 17,8
Pb: maritime pine. Ct: sweet chestnut. Cr: English oak. Cla: Lawson cypress. Sb: cork oak. Pt: Douglas fir. Cam: red oak. Cn: Pyrenean oak. Md: strawberry tree. Ac: mimosa. Fg: alder buck-thorn.
Table 2. Diversity indices
Name Acronym Formula Diversity measure Target
population
Species richness RS Horizontal Stand
Relative density RDi Horizontal Species
Relative basal area RBAi Horizontal Species
Simpson index D Horizontal Stand
Shannon and Weaver index H Horizontal Stand
Clark and Evans aggregation index Ri Spatial distribution Species
Pielou segregation index Si Spatial distribution Species
Spi: specie i. Ni: number of individuals of specie i. N: total number of individuals. Gi: basal area of specie i. G: total basal area.
pi: probability of an individual belonging to kthspecie. robs: average observed distance of a tree to its nearest neighbour. resp:
avera-ge expected distance to the nearest neighbour. m: total number of pairs of trees of specie 1. n: total number of pairs of trees of spe-cie 2. b and c number of pairs whose nearest neighbour is of a different spespe-cies, a and d number of pairs whose nearest neighbour is of the same species, v = a + c, w = b + d.
Si= 1− N b
( )
+ c vn+ wm(
)
Ri=robs rexp H= − pi× ln pi i=1 k∑
D= Ni(
Ni−1)
N N(
−1)
⎛ ⎝ ⎜⎜ ⎞ ⎠ ⎟⎟ i=1 N∑
RBAi= Gi G×100 RDi=Ni N ×100 RS= Spi i=1 K∑
tically compared with the non parametric Wilcoxon test (Maroco, 2007) with the SPSS (version 18.0 for Windows) for a significance level of 0.05.
Results
Natural regeneration was found for the following plant species: maritime pine, sweet chestnut, English oak, red oak, wild cherry, Pyrenean oak (Quercus pyre-naica Willd.), cork oak (Quercus suber L.), alder buck-thorn (Frangula alnus Miler.), strawberry tree (Arbutus unedo L.), acacia (Acacia sp.), Douglas fir and Lawson cypress.
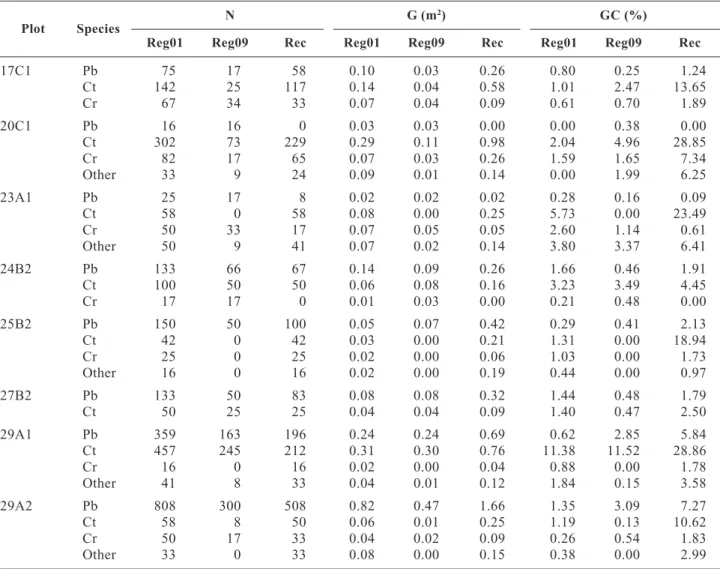
Analysis of the density measures considered the three main species in the mixture while all the other
individuals were grouped under the «other» class (Table 3). This was because their numbers were too small and would lead to a biased analysis, especially with regard to the spatial diversity indices. More than half of the regeneration individuals were recruited to the main stand in 2009. Maritime pine and English oak, though the latter in a smaller proportion, had a high rate of recruitment, in the plots with lower crown cover or where their regeneration was located in gaps, which corresponds well to the shade intolerant behaviour of these species, with statistically significant differences for maritime pine (exact 1-sided p value of 0.08) but not for English oak. Sweet chestnut, being a shade tolerant species, had high rates of recruitment in all plots. From 2001 to 2009 the individuals of this species were able to overcome the competition and increased
Table 3. Number of trees per hectare (N), basal area per hectare (G) and crown cover (GC)
Plot Species
N G (m2) GC (%)
Reg01 Reg09 Rec Reg01 Reg09 Rec Reg01 Reg09 Rec
17C1 Pb 75 17 58 0.10 0.03 0.26 0.80 0.25 1.24 Ct 142 25 117 0.14 0.04 0.58 1.01 2.47 13.65 Cr 67 34 33 0.07 0.04 0.09 0.61 0.70 1.89 20C1 Pb 16 16 0 0.03 0.03 0.00 0.00 0.38 0.00 Ct 302 73 229 0.29 0.11 0.98 2.04 4.96 28.85 Cr 82 17 65 0.07 0.03 0.26 1.59 1.65 7.34 Other 33 9 24 0.09 0.01 0.14 0.00 1.99 6.25 23A1 Pb 25 17 8 0.02 0.02 0.02 0.28 0.16 0.09 Ct 58 0 58 0.08 0.00 0.25 5.73 0.00 23.49 Cr 50 33 17 0.07 0.05 0.05 2.60 1.14 0.61 Other 50 9 41 0.07 0.02 0.14 3.80 3.37 6.41 24B2 Pb 133 66 67 0.14 0.09 0.26 1.66 0.46 1.91 Ct 100 50 50 0.06 0.08 0.16 3.23 3.49 4.45 Cr 17 17 0 0.01 0.03 0.00 0.21 0.48 0.00 25B2 Pb 150 50 100 0.05 0.07 0.42 0.29 0.41 2.13 Ct 42 0 42 0.03 0.00 0.21 1.31 0.00 18.94 Cr 25 0 25 0.02 0.00 0.06 1.03 0.00 1.73 Other 16 0 16 0.02 0.00 0.19 0.44 0.00 0.97 27B2 Pb 133 50 83 0.08 0.08 0.32 1.44 0.48 1.79 Ct 50 25 25 0.04 0.04 0.09 1.40 0.47 2.50 29A1 Pb 359 163 196 0.24 0.24 0.69 0.62 2.85 5.84 Ct 457 245 212 0.31 0.30 0.76 11.38 11.52 28.86 Cr 16 0 16 0.02 0.00 0.04 0.88 0.00 1.78 Other 41 8 33 0.04 0.01 0.12 1.84 0.15 3.58 29A2 Pb 808 300 508 0.82 0.47 1.66 1.35 3.09 7.27 Ct 58 8 50 0.06 0.01 0.25 1.19 0.13 10.62 Cr 50 17 33 0.04 0.02 0.09 0.26 0.54 1.83 Other 33 0 33 0.08 0.00 0.15 0.38 0.00 2.99
their growing space and had diameter growth rates that allowed their recruitment to the main stand, with statically signif icant differences of regeneration in relation to recruitment (exact 1-sided p value of 0.016). In basal area, there was a considerable increase for the three species, maritime pine, sweet chestnut and English oak, corresponding to an annual mean incre-ment of 0.43 cm, 0.51 cm and 0.35 cm, respectively, as confirmed by the significant differences between regeneration and recruitment (exact 1-sided p values of 0.016, 0.04 and 0.047, respectively). The same trend was observed for crown cover with an annual crown radius increment of 0.11 m and 0.31 m, respectively for maritime pine and sweet chestnut, showing signi-ficant differences for these two species (exact 1-sided p values of 0.016 and 0.004), but not for English oak with a more moderate increment in crown radius, of 0.08 m.
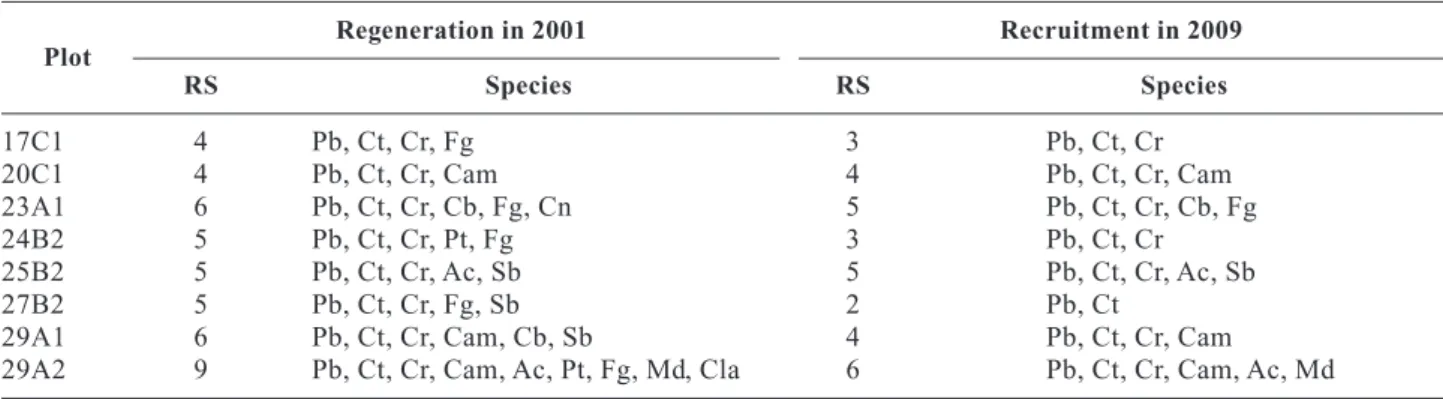
Species richness (RS) of regeneration varies between 4 and 9 and that of recruitment between 2 and 6 (Table 4).
Maritime pine and sweet chestnut are present in all plots, English oak in seven, and the other species are present in one two or three plots. The changes that have occurred in the number of species reflect the fact that either the species did not overcome competition pressure and, consequently, were not recruited (English oak in plot 24B2 and 29B1), or were present with a very limited number of individuals that did not survi-ved (for example, Pyrenean oak, Douglas fir and Lawson cypress).
For relative density (RD) and relative basal area (RBA) no clear trend between regeneration and re-cruitment was found. This is in conformity with the fact that no significant differences were detected, as it could be expected, considering the proportions of the different species.
Simpson index (D) increased where there was a balanced number of recruited individuals per species (Table 6). The opposite was observed in plots 25B2 and 29A2 where the number of recruited maritime pine
Table 4. Species richness (RS) and species
Plot Regeneration in 2001 Recruitment in 2009 RS Species RS Species 17C1 4 Pb, Ct, Cr, Fg 3 Pb, Ct, Cr 20C1 4 Pb, Ct, Cr, Cam 4 Pb, Ct, Cr, Cam 23A1 6 Pb, Ct, Cr, Cb, Fg, Cn 5 Pb, Ct, Cr, Cb, Fg 24B2 5 Pb, Ct, Cr, Pt, Fg 3 Pb, Ct, Cr 25B2 5 Pb, Ct, Cr, Ac, Sb 5 Pb, Ct, Cr, Ac, Sb 27B2 5 Pb, Ct, Cr, Fg, Sb 2 Pb, Ct
29A1 6 Pb, Ct, Cr, Cam, Cb, Sb 4 Pb, Ct, Cr, Cam
29A2 9 Pb, Ct, Cr, Cam, Ac, Pt, Fg, Md, Cla 6 Pb, Ct, Cr, Cam, Ac, Md
Pb: maritime pine. Ct : sweet chestnut. Cr: English oak. Cla: Lawson cypress. Cb: wild cherry. Sb: coak oak. Pt: Douglas f ir. Cam: red oak. Cn: Pyrenean oak. Md: strawberry tree. Ac: acacia, Fg: alder buckthorn.
Table 5. Relative density (RD) and relative basal area (RBA)
RD RBA
Plot Pb Ct Cr Other Pb Ct Cr Other
Reg Rec Reg Rec Reg Rec Reg Rec Reg Rec Reg Rec Reg Rec Reg Rec
17C1 26.5 28.0 50.0 56.0 23.5 16.0 27.3 27.5 62.7 62.7 12.8 9.8 20C1 3.8 0.0 69.8 71.8 18.9 20.5 7.6 7.7 1.7 0.0 70.0 71.0 18.5 18.9 9.8 10.1 23A1 13.6 6.7 31.8 46.7 27.3 13.3 27.3 33.3 7.5 4.3 45.6 54.2 18.0 10.7 28.9 30.9 24B2 53.3 57.1 40.0 42.9 6.7 0.0 56.7 62.4 38.7 37.6 4.7 0.0 25B2 64.3 54.6 17.9 22.7 10.7 13.6 7.1 9.1 51.4 47.8 22.2 23.8 6.7 7.2 19.7 21.2 27B2 72.7 76.9 27.3 23.1 76.1 78.6 23.9 21.4 29A1 41.1 42.9 52.3 46.4 1.9 3.6 4.7 7.1 43.2 43.1 49.1 47.1 2.0 2.7 5.7 7.2 29A2 85.1 81.3 6.1 8.0 5.3 5.3 3.5 5.3 80.1 77.2 9.9 11.6 4.3 4.2 5.7 7.0
individuals was much higher than that of the other species, and in plot 29A1 where the number of mari-time pine and sweet chestnut accounted for 80% of the recruited individuals. For the Shannon and Weaver index (H) the opposite was observed. In the plots where the proportions of maritime pine and/or sweet chestnut increased (see Table 5), there was a reduction of this index. The similarity of species’ proportions in regene-ration and recruitment might explain the non statistical differences.
Clark and Evans aggregation index (R) shows that the three species have a tendency towards a cluster distribution (Table 6), indicating that the distances between their individuals are smaller than expected according to the Poisson distribution. The Pielou segre-gation index (S) shows a tendency towards segresegre-gation, for the three species, indicating that the nearest neighbours of an individual belong to the same species, except for the regeneration of maritime pine in plot 24B2 that had a tendency towards intermingling or association. The reduction of the value of Clark and Evans aggregation index and the increase of the Pielou index for maritime pine in recruitment indicates a higher tendency towards clustering, with statistically significant differences (exact 1-sided p values of 0.008 and 0.031, respectively). In fact, seed dispersal, germi-nation and early survival are constrained by the clima-te, site and seed trees (e.g. Oliver e Larson, 1996; Lanier et al., 1986). Although maritime pine has a light seed and germinates well, its survival is determined by the presence of direct sunlight. The presence of sweet chestnut in the inferior and intermediate layers, leads to sparse survival of maritime pine in shaded
condi-tions. On the other hand, all plots had canopy gaps where the maritime pine recruited individuals were mainly located, that is in clusters. Sweet chestnut and English oak seeds are heavy, so dissemination tends to take place in small patches close to the seed tree, unless animals transport the seeds to further away. This justifies their tendency towards clustering, even though their behaviour is different. Sweet chestnut has an even more marked tendency towards clustering due to its natural ability to produce coppices (observed in all the plots) and because its early development is not limited by direct sunlight, as it is a shade tolerant species. The faster growth of the dominant poles reducing the number of poles per coppice in the recruitment as well as the cuttings might explain the significant differences in relation to regeneration for both indices (exact 1-sided p values of 0.031 and 0.031, respectively). English oak is a shade intolerant species whose seed-lings’ initial development occurs when sunlight is not a limiting factor. The fact that these individuals are mainly located in the canopy gaps might explain the non significant differences between regeneration and recruitment.
The main stand in 2001 (see Gonçalves et al., 2010) was compared with both regeneration and recruitment. In regeneration and recruitment a reduction of the proportion of maritime pine and an increase in sweet chestnut can be observed with statistically significant differences for relative density and relative basal area (exact 1-sided p values of 0.004, 0.004, 0.004, 0.004, 0.008, 0.008, 0.004, 0.004, respectively) and for re-lative basal area for English oak regeneration (exact 1-sided p value of 0.023). The statistically significant
Table 6. Simpson index (D), Shannon and Weaver index (H), Clark and Evans aggregation index (R) and Pielou segregation
index (S)
D H R S
Plot Pb Ct Cr Pb Ct Cr
Reg Rec Reg Rec Reg Rec Reg Rec Reg Rec Reg Rec Reg Rec Reg Rec
17C1 0.39 0.43 1.04 0.97 0.49 0.47 0.34 0.32 0.45 0.30 0.92 0.94 0.61 0.68 0.70 0.85 20C1 0.55 0.58 0.88 0.76 0.44 0.04 0.01 0.51 0.55 0.00 0.80 0.85 0.85 0.88 23A1 0.25 0.31 1.46 1.34 0.22 0.06 0.39 0.39 0.61 0.42 1.00 1.00 0.75 0.75 1.00 1.00 24B2 0.45 0.54 0.89 0.68 0.87 0.53 0.51 0.36 0.12 –0.06 0.47 0.08 0.54 0.86 25B2 0.47 0.38 1.07 1.22 0.66 0.51 0.66 0.66 0.42 0.42 0.69 0.80 0.84 0.84 0.84 0.84 27B2 0.63 0.68 0.58 0.54 0.37 0.32 0.11 0.10 1.00 1.00 1.00 1.00 29A1 0.45 0.41 0.92 1.03 0.38 0.30 0.41 0.29 0.11 0.11 0.80 0.89 0.57 0.80 0.96 0.96 29A2 0.73 0.68 0.61 0.75 0.81 0.67 0.35 0.35 0.22 0.16 0.01 0.38 0.90 0.92 0.94 0.96
differences between the main stand, in 2001, and regeneration and recruitment are also reflected in the Simpson and the Shannon and Weaver indices (exact 1-sided p values of 0.012, 0.008, 0.004 and 0.004) re-vealing that the probability for two randomly indivi-duals belonging to the same species and the probability of one individual of the kthspecies belonging to the kth
species, respectively, is smaller for the younger indi-viduals.
In the main stand maritime pine has a tendency towards regular distribution, due to its uniform special distribution, while sweet chestnut has a tendency to-wards clustering mainly due to coppicing (Gonçalves et al., 2010). Regarding the spatial distribution indices, the Clark and Evans index showed a higher tendency towards clustering in regeneration and recruitment than in the main stand for maritime pine (exact 1-sided p values of 0.008 and 0.008) and the Pielou index presen-ted a higher tendency towards segregation in regenera-tion for sweet chestnut (exact 1-sided p value of 0.012) and in recruitment for maritime pine and sweet chest-nut (exact 1-sided p values of 0.039 and 0.012, respec-tively). The increased tendency towards clustering in regeneration and recruitment is due to the spatial distribution of the niches without light constraints for maritime pine and is mainly caused by the number of poles per coppice for sweet chestnut.
Discussion
Recruitment and natural regeneration individuals occur in all plots for all species, except in plot 20C1 for maritime pine and in plot 24B2 for English oak. The species’ spatial distribution vary with the species’ shade tolerance: maritime pine and English oak indi-viduals are mainly located in niches with full sun-light, as opposed to sweet chestnut which does not seem to show a clear trend. Several authors (e.g. Maltez-Mouro et al., 2009; Oliver, 2007; Paluch, 2005; Rozas, 2002) have detected a similar spatial distri-bution pattern according the species’ shade tolerance: the intolerant species are located in canopy gaps while tolerant ones are found under the canopy of the main stand.
In recruitment the species proportions showed a trend towards a transformation in stand composition. In the main stand, maritime pine has a relative density varying between 52% and 92% in 2001 and in 2009, respectively, and a relative basal area was greater than
90% in both measurements (Gonçalves et al., 2010). Recruitment shows more balanced proportions, both for relative density and for relative basal area, revealing the ability of natural regeneration to occupy small areas and different niches, as referred to by Evans (1988). The Simpson and the Shannon and Weaver indices for recruitment show a trend towards higher diversity than they do in the main stand, due to the increase in the number of the two broadleaved species. The Clark and Evans index indicates a clustering tendency and the Pielou index a tendency towards segregation, due to the canopy gap and the different species’ shade tole-rance and coppicing. Enhancement of diversity obser-ved in recruitment is reflected in the main stand, in the second measurement, in 2009 (for details see, Gonçalves et al., 2010).
The individuals of the other recruited species, in spite of their small proportion in 2009, can also con-tribute towards increasing stand diversity in the future. However, acacia though with a small number of indi-viduals in plots 25B2 and 29A2, should be removed, as it is an invasive species in Portugal.
Analysis of natural regeneration development and recruitment with density and diversity measures in multi-species stands makes it possible to obtain further detail with regard to the proportions of the different species and their spatial distribution, espe-cially relevant if the species have different shade tole-rances.
Acknowledgements
The authors would like to thank Autoridade Florestal Nacional for permission to settle and measure the plots. Also, they would like to thank Rita Rodrigues, Tânia Antunes, Margarida Gonçalves, Belmiro Fernandes, Carla Ramos, Pedro Antunes and David Gomes for their help in the data collection. Funding was provided by the following projects: «Forest ecosystem manage-ment: an integrated stand-to-landscape approach to biodiversity and to ecological, economic and so-cial sustainability» (POCTI/36332/AGR/ 2000) and «Florestas mistas. Modelação, dinâmica e distribui-ção geográfica da produtividade e da fixadistribui-ção de car-bono nos ecossistemas florestais mistos em Portugal» (FCOMP-01-0124-FEDER-007010). Neda Bakhsha-deg is gratefully acknowledged for the English re-vision, as well as the contribution of two anonymous reviewers.
References
ALVES A.A.M., 1988. Técnicas de produção florestal, 2ª ed. INIC, Lisboa. 331 pp. [In Portuguese].
AYANZ A. S.M., 1986. Ecologia, tipologia, valoracion y alternativas silvopascicolas de los quejicares (Quercus
faginea Lamk.) de Guadalajara. Tesis doctorales.
Minis-terio de Agricultura, Pesca y Alimentacion, Instituto de Investigaciones Agrarias, Madrid. [In Spanish].
BARJA A.C., BORJA M.E.L., GARCÍA E.M., SERRANO F.R.L., ABELLÁN M.A., MOROTE F.A.G., LÓPEZ R.N., 2009. Influencia de la densidad de la masa adulta y el tratamiento del suelo sobre la regeneración del pino laricio (Pinus nigra Arn. ssp. Salzmannii) en España. Forest systems 18, 167-180. [In Spanish].
BIBER P., WEYERHAEUSER H., 1998. Numerical methods for characterizing structure and diversity applied to a na-tural tropical forest and an even aged teak stand. In: Natu-ral and socio-economic analysis and modelling of forest and agroforestry systems in Southeast Asia (Mies E., ed). German Foundation for Development, Food and Agricul-ture Development Centre. pp 83-104.
BOLTE A., VILLANUEVA I., 2006. Interspecific compe-tition impacts on the morphology and distribution of f ine roots in European beech (Fagus sylvatica L.) and Norway spruce [Picea abies (L.) Karst.]. Eur J Forest Res 125, 15-26.
BURSCHEL P., KATEB H. EL, MONSANDL R., 1992. Experiments in mixed mountain forests in Bavaria. In: The ecology and silviculture of mixed-species forests (Kelty M.J., Larson B.C., Oliver C.D., eds). Kluwer Aca-demic Publishers. pp 183-215.
DARABANT A., RAI P.B., TENZIN K., RODER W., GRATZER G., 2007. Cattle grazing facilitates tree rege-neration in a conifer forest with palatable bamboo under-story. Forest Ecology and Management 252, 73-83. DAVIS L.N., JONHSON K.N., 1987. Forest management.
McGraw-Hill, New York. 800 pp.
EVANS J., 1988. Natural regeneration of broadleaves. Fo-restry Commission. Bulletin 78. 46 pp.
FABIÃO A.M.D., 1996. Árvores e florestas, 2ª ed. Publica-ções Europa-America. 228 pp. [In Portuguese].
GILLIAM FS., 2002. Effects of harvesting on herbaceous layer diversity of a central Appalachian hardwood forest in West Virginia, USA. Forest Ecology and Management 155, 33-43.
GONÇALVES A.C., 2003. Modelação de povoamentos adultos de pinheiro bravo com regeneração de folhosas na Serra da Lousã. Tese de doutoramento. Instituto Su-perior de Agronomia, Lisboa. [In Portuguese].
GONÇALVES A.C., OLIVEIRA A. C., DIAS S.S., 2010. Evolution in multi-species high forest stands in Serra da Lousã: diversity analysis. Silva Lusitana, nº Especial Flo-restal Mistas, 79-90.
GRAZ F. P., 2004. The behaviour of the species mingling index Msp in relation to species dominance and disper-sion. Eur J Forest Res, 123, 87-92.
HARMER R., 1994a. Natural regeneration of broadleaved trees in Britain: I. Historical aspects. Forestry 67, 179-187. HARMER R., 1994b. Natural regeneration of broadleaved trees in Britain: II. Seed production and predation. Forestry 67, 275-286.
HARMER R., 1995. Natural regeneration of broadleaved trees in Britain: III. Germination and establishment. Forestry 68, 1-9.
KABRICK J.M., ZENNER E.K., DEY D.C., GWAZE D., JENSEN R.G., 2008. Using ecological land types to exa-mine landscape-scale oak regeneration dynamics. Forest Ecology and Management 255, 3051-3062.
KATHKE S., BRUELHEIDE H., 2010. Interaction of gap age and microsite type for the regeneration of Picea abies. Forest Ecology and Management 259, 1597-1605. LANIER L., BADRÉ M., DELABRAZE P., DUBOURDIEU
J., FLAMMARION J.P., 1986. Précis de sylviculture. ENGREF, Nancy. 468 pp. [In French].
MCDONALD P.M., ABBOTT C.S., 1994. Seedfall, regene-ration and seedling development in group-selection ope-nings. Pacific Northwest Forest and Range Experiment Station, Forest Service, United States Department of Agriculture, Research paper PSW-RP-220. 13 pp. MALTEZ-MOURO S., GARCÍA L.V., FREITAS H., 2009.
Influence of forest structure and environmental variables on recruit survival and performance of two Mediterranean tree species (Quercus faginea L. and Q. suber Lam.). Eur J Forest Res, 128, 27-36.
MAROCO J., 2007. Análise estatística com utilização do SPSS. Edições Silabo, 3ª ed. Lisboa. 822 pp. [In Portu-guese].
NATIVIDADE J.V., 1950. Subericultura. Ministério da Agri-cultura, Pescas e Alimentação, Direcção Geral das Flo-restas, 2ª ed. Lisboa. 387 pp. [In Portuguese].
NEUMANN M., STARLINGER F., 2001. The significance of different indices for stand structure and diversity in forests. Forest ecology and Management 145, 91-106. OLIVER C.D., LARSON B.C., 1996. Forest stand dynamics.
Update editions, John Wiley & sons, Inc. 519 pp. OLIVER P.A.T., 2003. Condicionantes y limitaciones de la
regeneración natural en un pinar oromediterráneo de
Pinus nigra subsp. salzmannii. Forest systems 12, 55-64.
[In Spanish].
OLIVER P.A.T., 2007. Dinámica de regeneración de Pinus
nigra subsp. salzmannii al sur de su área de distribución:
etapas, procesos y factores implicados. Forest systems 16, 124-135. [In Spanish].
PAGE L.M., CAMERON A.D., CLARKE G.C., 2001. Influence of overstorey basal area on density and growth of advanced regeneration of Sitka spruce in variably thinned conditions. Forest Ecology and Management 151, 25-35.
PALUCH J.G., 2005. The influence of the spatial pattern of trees on forest floor vegetation and silver fir (Abies alba Mill.) regeneration in uneven-aged forests. Forest Ecology and Management 205, 283-298.
PIUSSI P., 1994. Selvicoltura generale. UTET, Torino. 412 pp. [In Italian].
POMMRENING A., 2002. Approaches to quantifying forest structures. Forestry 75, 305-324.
POMMRENING A., 2006. Evaluating structural indices by reversing forest structural analysis. Forest Ecology and Management 224, 266-277.
PRETZSCH H., 1998. Structural diversity as a result of silvi-cultural operations. Lesnictví-Forestry 44, 429-439. ROZAS V., 2002. Estructura y patrones de regeneración del
roble y el haya en un bosque maduro del litoral occidental de Cantabria. Forest systems 11, 107-136. [In Spanish].
RUPRECHT H., DHAR E.A., AIGNER E.B., OITZINGER G., KLUMPP E.R., VACIK E.H., 2010. Structural di-versity of English yew (Taxus baccata L.) populations. Eur J Forest Res 129, 189-198.
SMITH D.M., LARSON B.C., KELTY M. J., ASHTON P.M.S., 1997. The practice of silviculture. Applied forest ecology, 9thed. John Wiley & Sons, Inc. 537 pp. STAUDHAMMER C.L., LAMEY V.M., 2001. Introduction
and evaluation of possible indices of stand and structural di-versity. Canadian Journal of Forestry Science 31, 1105-1115.