❊♥s❛✐♦s ❊❝♦♥ô♠✐❝♦s
❊s❝♦❧❛ ❞❡
Pós✲●r❛❞✉❛çã♦
❡♠ ❊❝♦♥♦♠✐❛
❞❛ ❋✉♥❞❛çã♦
●❡t✉❧✐♦ ❱❛r❣❛s
◆◦ ✹✻✾ ■❙❙◆ ✵✶✵✹✲✽✾✶✵
❊♠♣❧♦②♠❡♥t ❛♥❞ Pr♦❞✉❝t✐✈✐t② ✐♥ ❇r❛③✐❧ ✐♥ t❤❡
◆✐♥❡t✐❡s
▼❛r❝❡❧♦ ❈♦rt❡s ◆❡r✐✱ ❏♦sé ▼ár❝✐♦ ❈❛♠❛r❣♦✱ ▼❛✉rí❝✐♦ ❈♦rt❡③ ❘❡✐s
❉❡③❡♠❜r♦ ❞❡ ✷✵✵✷
❖s ❛rt✐❣♦s ♣✉❜❧✐❝❛❞♦s sã♦ ❞❡ ✐♥t❡✐r❛ r❡s♣♦♥s❛❜✐❧✐❞❛❞❡ ❞❡ s❡✉s ❛✉t♦r❡s✳ ❆s
♦♣✐♥✐õ❡s ♥❡❧❡s ❡♠✐t✐❞❛s ♥ã♦ ❡①♣r✐♠❡♠✱ ♥❡❝❡ss❛r✐❛♠❡♥t❡✱ ♦ ♣♦♥t♦ ❞❡ ✈✐st❛ ❞❛
❋✉♥❞❛çã♦ ●❡t✉❧✐♦ ❱❛r❣❛s✳
❊❙❈❖▲❆ ❉❊ PÓ❙✲●❘❆❉❯❆➬➹❖ ❊▼ ❊❈❖◆❖▼■❆ ❉✐r❡t♦r ●❡r❛❧✿ ❘❡♥❛t♦ ❋r❛❣❡❧❧✐ ❈❛r❞♦s♦
❉✐r❡t♦r ❞❡ ❊♥s✐♥♦✿ ▲✉✐s ❍❡♥r✐q✉❡ ❇❡rt♦❧✐♥♦ ❇r❛✐❞♦ ❉✐r❡t♦r ❞❡ P❡sq✉✐s❛✿ ❏♦ã♦ ❱✐❝t♦r ■ss❧❡r
❉✐r❡t♦r ❞❡ P✉❜❧✐❝❛çõ❡s ❈✐❡♥tí✜❝❛s✿ ❘✐❝❛r❞♦ ❞❡ ❖❧✐✈❡✐r❛ ❈❛✈❛❧❝❛♥t✐
❈♦rt❡s ◆❡r✐✱ ▼❛r❝❡❧♦
❊♠♣❧♦②♠❡♥t ❛♥❞ Pr♦❞✉❝t✐✈✐t② ✐♥ ❇r❛③✐❧ ✐♥ t❤❡ ◆✐♥❡t✐❡s✴ ▼❛r❝❡❧♦ ❈♦rt❡s ◆❡r✐✱ ❏♦sé ▼ár❝✐♦ ❈❛♠❛r❣♦✱ ▼❛✉rí❝✐♦ ❈♦rt❡③ ❘❡✐s ✕ ❘✐♦ ❞❡ ❏❛♥❡✐r♦ ✿ ❋●❱✱❊P●❊✱ ✷✵✶✵
✭❊♥s❛✐♦s ❊❝♦♥ô♠✐❝♦s❀ ✹✻✾✮
■♥❝❧✉✐ ❜✐❜❧✐♦❣r❛❢✐❛✳
Employment and Productivity in Brazil in the Nineties
José Márcio Camargo1 Marcelo Neri2 Maurício Cortez Reis3
I - Introduction
The nineties have proved to be one of the major turning points in Brazilian economic history. Brazil started out the decade as an economy closed to international trade flows and capital, in which the State played a major role as a producer of goods and services, and with a trend toward growing inflation. As the decade progressed, it moved to become an open economy, reducing commercial protection and deregulating capital flows, while diminishing the role of the State as a producer of goods and services through privatization. This culminated in a stabilisation programme based on an exchange anchor and supported by an opening up of trade and the financial market.
These structural changes have strongly affected the pace and pattern of growth in the economy. Brazil was plunged into deep recession between 1990 and 1992 when the level of activity slumped and unemployment swelled. As from 1993, and more markedly after the stabilisation plan was introduced in June 1994, this trend was reversed and growth resumed until 1997. The advent of the Asian crisis and the ensuing international financial crisis in mid-1998 interrupted the renewed spate of growth.
As could only be expected, these macroeconomic developments acutely affected the performance of the labour market. Indeed, the ripples continue to be felt as the decade draws to a close. The knock-on effects include a reduction in industrial employment and a higher proportion of workers employed in the informal sector of the economy, combined with increased real earnings and expansion of employment in commerce and the services sector.
However, the rise in the level of employment in commerce and the services sector - which offset the drop in industrial employment when stabilisation was in its infancy, averting an increase in unemployment - began to level off in 1997. At the same time, the Asian crisis made it impossible to maintain output due to external restrictions. The outcome was a sharp increase in the rate of open unemployment as from the beginning of 1998.
This evolution of the Brazilian labour market in the wake of economic deregulation and stabilisation raises a worrying prospect for the future in view of the change in demand for skilled labour, insufficient supply of such labour and the increase in long-term unemployment. If the country wants to avoid high rates of structural unemployment, it will have to adopt major reforms in its labour legislation to boost incentives for companies and employees to invest in qualification and training throughout workers’ working lives.
1
Lecturer, Economics Department, PUC/Rio.
2
Lecturer at EPGE/FGV and Head of the Center for Social Policies (CPS) at IBRE/FGV
3
The aim of this chapter is to analyse the performance of Brazil’s metropolitan labour market in the nineties. We shall examine the evolution of the level and structure of employment, real earnings and labour productivity in industry, commerce and services in addition to the level of unemployment. Based on the data provided by the Monthly Labour Survey (MLS) carried out by the Brazilian Geography & Statistics Institute (IBGE), we hold that the performance of Brazil’s metropolitan labour market can only be explained by the hypothesis that significant productivity gains are occurring in the industrial and services sectors of the economy. Using the data for Law 4,923, we provide evidence that such productivity gains have indeed occurred, especially in the post-stabilisation period.
Secondly, we examine changes in the structure of skills and qualification among workers employed in Brazil’s metropolitan regions, where substantial improvement has occurred in this respect.
The chapter is divided into six sections. The next section describes the stylised facts of the behaviour of Brazil’s metropolitan labour market throughout the nineties. The following section explains this behaviour on the basis of a simple demand and supply model for labour. Section four depicts the evolution of the marginal productivity of labour in the industrial and services sectors, taking hiring wages as a proxy for marginal productivity. This indicator is obtained from the Ministry of Labour’s Law 4,923 deflated by the specific price index for each sector. Section five examines the evolution of the qualification structure in the Brazilian labour market between 1990 and 1996. Finally, section six offers a number of conclusions.
II - Stylised Facts
The performance of the Brazilian metropolitan labour market in the nineties should be divided into two distinct subperiods. The first goes from 1990 to the stabilisation of the economy in 1994. This subperiod was marked by deep recession, a surging rate of open unemployment and extremely high levels of inflation. This was when major structural changes took place, mainly as a result of the deregulation of trade. The second subperiod began in 1994 and extends to the present day. During this time, not only was the rate of inflation reduced to genuinely low levels (in 1997 annual inflation was less than 5%), but output began to grow until 1997, since when it has stagnated.
Despite the great difference in macroeconomic performance in the two subperiods, in some aspects labour market performance has been homogenous. This is mostly due to the major structural changes that have been the hallmark of the period. In other words, those aspects of the operation of the labour market associated with the effects of structural changes (e.g. the opening up of the Brazilian economy, privatization and so on) have evolved in a similar fashion in both subperiods, although such transformations were far more intense in the first of the two. On the other hand, aspects of the operation of the labour market related to short-term macroeconomic performance (e.g. stabilisation) have evolved in a clearly distinct manner from one subperiod to the other. The aim of this section is to observe the behaviour of the Brazilian labour market between 1990 and 1998.
When the decade began, the Brazilian economy was deep in recession. Following a period of rampant inflation in the late eighties when prices increased as much as 80% a month, at the beginning of 1990 the government decreed a moratorium on domestic debt, which had a strongly recessive effect. The (deseasonalised) rate of open unemployment, which had stood at 4.0% in 1990, rose to 6% of the workforce in the second half of 1992, when recession was at its worst (see Graph 1).
Graph 1 Unemployment Rate Rate of open unemployment - MLS
Rate of Open Unemployment - MLS
Twelve-month centred moving average - Deseasonalised data
One important aspect that should be stressed is that, despite the deep recession, the increase in the rate of open unemployment was relatively moderate. At no point did the rate attain anything like the levels registered in the early eighties (8% of the workforce). On the other hand, open unemployment - unlike in the previous period referred to - began to show signs of containing a major structural component: systematic reduction of industrial employment and higher rates of employment in commerce and services. These signs began to take clearer shape when economic growth resumed and the level of industrial employment continued to drop despite increased output. Empirical evidence presented below shows that unemployment is relatively unaffected by cyclical trends in output.
These two features are clearly detectable through observation of the pattern of unemployment in the three main sectors of economic activity in Brazil: industry, commerce and services. Graph 2 shows that the aggregate level of employment remained stagnant from April 1991
to the end of 1992, followed by a period of mild recovery that lasted until mid-19944.
4
The data refer to the metropolitan regions of Belo Horizonte, Porto Alegre, Recife, Rio de Janeiro, Salvador and São Paulo. Unfortunately, a break in the sequence of data on the level of employment (PME/IBGE) occurred in
4.0 4.4 4.8 5.2 5.6 6.0
Mar-90 May-90 Jul-90 Sep-90 Nov-90 Jan-91 Mar-91 May-91 Jul-91 Sep-91 Nov-91 Jan-92 Mar-92 May-92 Jul-92 Sep-92 Nov-92 Jan-93 Mar-93 May-93 Jul-93 Sep-93 Nov-93 Jan-94 Mar-94 May-94
Graph 2
Recovery of the level of employment is visible in the commerce and services sectors while it continues to slide or remain stagnant in the industrial sector. Graphs 3, 4 and 5 show the evolution of the level of employment in these three sectors during the period under examination. As can be observed from the graphs, the level of employment in industry fell about 10% during the recession and then levelled off when the economy began to recover in the last two quarters of 1992. In commerce, meanwhile, besides remaining stagnant throughout the recession, as from the end of 1992 the level of employment began to pick up. In the services sector, on the other hand, the level of employment increased steadily throughout the entire period. The evolution of the rate of open unemployment is therefore directly associated with the reduction in industrial employment.
Shrinking employment in industry stems from the establishment of unfettered trade and the increased competition ensuing from this structural change. The opening up of the economy obliged Brazilian industry to introduce new technologies and new forms of labour organisation designed to raise productivity in order to survive. The offshoot was a systematic reduction of industrial employment. As we shall see in the next subsection, this fact is confirmed by the pattern of industrial employment subsequent to stabilisation when relatively rapid economic growth resumed.
Employment - Brazil - MLS
88 89 90 91 92 93 94 95
Jun-91 Aug-91 Oct-91 Dec-91 Feb-92 Apr-92 Jun-92 Aug-92 Oct-92 Dec-92 Feb-93 Apr-93 Jun-93 Aug-93 Oct-93 Dec-93 Feb-94 Apr-94 Jun-94
Graph 3
Graph 4
E m p l o y m e n t i n I n d u s t r y - M L S
75 76 77 78 79 80 81 82 83 84 85
Jul-91
Sep-91 Nov-91 Jan-92 Mar-92 May-92 Jul-92 Sep-92 Nov-92 Jan-93 Mar-93 May-93 Jul-93 Sep-93 Nov-93 Jan-94 Mar-94 May-94 Jul-94
1 2 - m o n t h c e n t r e d m o v i n g a v e r a g e B a s e : J u n / 9 0 = 1 0 0
E m p l o y m e n t i n C o m m e r c e - M L S
9 0 9 2 9 4 9 6 9 8 1 0 0 1 0 2 1 0 4
Jun-91 Sep-91 Dec-91 Mar-92 Jun-92 Sep-92 Dec-92 Mar-93 Jun-93 Sep-93 Dec-93 Mar-94 Jun-94
Graph 5
To gauge how the sectorial structure of employment varied between two distinct periods, we shall employ a turbulence index, which can be defined as:
| |
2 1
0
1 1
p
p
T
jm
j j −
=
∑
=
where pji is the proportion of employment in sector j in relation to total employment at an instant of
time i.
Based on MLS data for 27 sectors of the economy, the turbulence index recorded the figures displayed in Graph 6 for a one-year timespan. This analysis uses the annual arithmetical averages for employment in each of these sectors. From the graph, it can be seen that there were acute structural alterations in the early nineties associated with the switch from employment in industry to the services and commerce sectors.
E m p l o y m e n t i n S e r v i c e s - M L S
9 1 9 3 9 5 9 7 9 9 1 0 1 1 0 3
Jun-91 Sep-91 Dec-91 Mar-92 Jun-92 Sep-92 Dec-92 Mar-93 Jun-93 Sep-93 Dec-93 Mar-94 Jun-94
Graph 6
Until 1990, rates of unemployment followed the pattern of production cycles fairly closely. Whenever the economy went into recession, unemployment surged, reverting to the low levels recorded at the end of the previous period of growth when the trough ended. This fluctuation in the rates of open unemployment suggested a high degree of flexibility in the Brazilian labour market (real wages and employment) in relation to the intensity of shocks the economy underwent. In the nineties, the rate of unemployment has displayed a new growth trend not directly linked to output cycles. Moreover, a new component of structural change emerged at the beginning of the decade. This novelty has enhanced the importance of reallocation shocks with regard to unemployment.
The effects of cyclical variations in output and of reallocation shocks are measured by estimating the rate of unemployment registered in Table 1 below. Unemployment is estimated by using the lagged rate of unemployment itself, variations in GDP (calculated by IBGE) as a proxy for
variations in output, and a dispersion index5 calculated on the basis of the rate of growth in the
number of employees in 27 sectors of the economy, which records the effects of reallocation shocks. Seasonal dummies are also used to supplement these variables.
The data are quarterly and so the rate of unemployment used in these estimates is the quarterly arithmetical average of the monthly rates published by IBGE. The estimates are displayed in the following table:
5
The correlation between reallocation shocks and unemployment was first estimated by Lilien (1982). Further details on the elaboration of the dispersion index used here and on the effects of reallocation shocks on unemployment can be found in Reis (1999).
Turbulence Index - 1 Year
0 , 0 0 5 0 , 0 1 0 , 0 1 5 0 , 0 2
Table 1
Dependent Variable: Unemployment
Variables (1) (2) (3)
Unemploymentt-1 0.97
(25.44)**
0.98 (25.52)**
0.92 (18.40)**
GDPt -10.02
(5.92)**
-9.01 (5.90)**
-
GDPtt-1 -5.18
(3.34)**
-6.18 (4.17)**
-
Dispersiont -0.001
(0.97)
- -
Dispersiont-1 0.03
(2.08)**
- -
Seasonal dummy 1 0.15
(0.57)
0.46 (2.16)**
1.20 (4.95)**
Seasonal dummy 2 0.75
(2.58)**
0.88 (3.73)**
0.52 (1.83)**
Seasonal dummy 3 -0.008
(0.98)
0.38 (1.48)
0.07 (0.23)
Seasonal dummy 4 -1.18
(4.24)**
-0.90 (3.96)**
-0.32 (1.14)**
Observations 58[83:3-97:4] 58[83:3-97:4] 59[83:2-97:4]
Jarque-Bera 0.78 1.13 0.45
R2 adjusted 0.95 0.93 0.87
R2 0.93 0.93 0.88
Notes: -t statistics are shown in brackets. (*) and (**) indicate that the coefficients are significant at 10% and 5%, respectively.
The results obtained show that the rate of unemployment does not vary much in relation to the lagged rate, as can be seen from the fact that the coefficient for this variable is close to one in the equations above. Equation 1 shows that the dispersion index is positively significant at 5%, as are the variations in output but with negative values.
In equation 3 the unemployment rate is estimated solely in terms of its past value and the seasonal variations. Excluding output and reallocation shocks alters very little in terms of adjustment
of regression, as can be observed from the very slight difference between R2 and R2 adjusted in
The effect of reallocation shocks on unemployment in the early nineties can be gauged from the graphs below which trace the dual evolution of effective figures for unemployment and those forecast one period ahead by projecting equations 1 and 2 from 1983 to 1989. Models 1 and 2 represent, respectively, estimates that take into account or exclude the effects of sectorial shocks on unemployment.
The model that ignores the effects of sectorial shocks systematically underestimates the unemployment rate in the early nineties. In other words, failing to allow for differing effects from one sector to another of the structural changes that took place at the beginning of the decade seriously impairs the capacity to predict unemployment. The explanation as to why these reallocation shocks should so strongly influence the aggregate unemployment rate may lie in the labour market’s slowness to adjust to a new economic environment - a possibility explored in what follows.
Graph 7
Graph 8
U n e m p l o y m e n t R a t e : E f f e c t i v e a n d E s t i m a t e d b y E q u a t i o n 1
2 3 4 5 6 7
Real average earnings in the commerce and services sectors mirror the pattern of open unemployment throughout this period. Until mid-1992, real average earnings for workers in these sectors, deflated by the National Consumer Price Index (INPC), fell systematically, the trend being reversed when economic growth resumed and the rate of open unemployment began to drop at the end of 1992. This evolution demonstrates the relative flexibility of real wages in these sectors. The conclusion is that much of the labour market’s adjustment to recession took the shape of a reduction in real earnings (see Graphs 9 and 10), thus averting an even greater increase in unemployment.
Graph 9
R e a l A v e r a g e E a r n i n g s - C o m m e r c e ( I N P C C o n s u m e r P r i c e I n d e x )
8 0 8 5 9 0 9 5 1 0 0 1 0 5 1 1 0
Mar-91 Jun-91 12-month centred moving average - Deseasonalised DataSet-91 Dez-91 Mar-92 Jun-92 Set-92 Dez-92 Mar-93 Jun-93 Set-93 Dez-93 Mar-94 Jun-94
B a s e : D e z / 9 1 = 1 0 0
Unemployment Rate: Effective and Estimated
by Equation 2
2
3
4
5
6
7
Graph 10
By way of contrast, real earnings for workers in industry remained fairly constant throughout the recession, despite repeated reductions in industrial employment in the period (see Graph 11). This is partly due to the change in relative prices for tradeable and non-tradeable goods.
As Graph 12 shows, the relation between the National Consumer Price Index (which includes both types of goods) and the industrial sector Wholesale Price Index (which reflects only the prices of
goods for sale) displays a systematic downward trend until the end of 1993.
Graph 11
Real Average Earnings - Industry (IPA-IND Industrial Wholesale Index)
88 90 92 94 96 98 100 102 104
Mar-91 Jun-91 Sep-91 Dec-91 Mar-92 Jun-92 Sep-92 Dec-92 Mar-93 Jun-93 Sep-93 Dec-93 Mar-94 Jun-94
12-month centred moving average - Deseasonalised Data - Base: Mar/91=100 R e a l A v e r a g e E a r n i n g s - S e r v i c e s
( I N P C C o n s u m e r P r i c e I n d e x )
8 5 9 0 9 5 1 0 0 1 0 5 1 1 0
Mar-91 Jun-91 Set-91 Dez-91 Mar-92 Jun-92 Set-92 Dez-92 Mar-93 Jun-93 Set-93 Dez-93 Mar-94 Jun-94
Graph 12
Graph 13 shows that, deflated by the consumer price index, real earnings for workers in industry remained constant whereas deflated by the industrial price index (i.e. the real cost of labour) they sank substantially from the beginning of the decade until the end of recession in mid-1992 and then held level until the economy stabilised. In other words, throughout the period, income for workers and employers in the commerce and services sectors was effectively transferred to industrial corporations.
Graph 13
R e a l A v e r a g e E a r n i n g s - I n d u s t r y ( I P C c o n s u m e r P r i c e I n d e x )
9 8 1 0 3 1 0 8 1 1 3 1 1 8 1 2 3 1 2 8
Mar-91 Jun-91 Set-91 Dez-91 Mar-92 Jun-92 Set-92 Dez-92 Mar-93 Jun-93 Set-93 Dez-93 Mar-94 Jun-94
1 2 - m o n t h c e n t r e d m o v i n g a v e r a g e - D e s e a s o n a l i s e d D a t a - B a s e : M a r / 9 1 = 1 0 0
IP C - F i p e / I P A - I n d ú s t r i a ( B a s e : j a n / 9 4 = 1 0 0 )
9 0 1 0 0 1 1 0 1 2 0 1 3 0
Thus, in terms of major labour market trends in this first subperiod, it can be stated that:
a. employment in industry shrank while employment in the commerce and services sectors
expanded, keeping pace with the level of economic activity;
b. the rate of open unemployment tended to increase in the early nineties due to recession but
mostly because the labour market was slow to adjust to the structural changes that took place at the turn of the decade following the establishment of free trade. Once growth resumed in mid-1992, unemployment subsided slightly;
c. finally, workers’ real earnings in the commerce and services sectors rose inversely to the
evolution of the rate of open unemployment. Concommitantly, the change in relative prices in favour of goods destined for sale (industrial goods, in particular) prevented industrial workers’ real earnings from sliding, despite the fall in the level of employment. At the same time, the real cost of labour in this sector dropped significantly.
II.2 The 1994-1998 subperiod
The subperiod beginning in June 1994 features a major change in relation to the previous period: price stabilisation. Increased competition and the adoption of an exchange anchor slashed inflation (which had risen to 40% a month in June 1994) to about 5% a year in 1997.
One of the main effects of the exchange anchor combined with the increased demand resulting from price stabilisation itself was a change in the behaviour of relative prices in the Brazilian economy. The prices of non-tradeable goods rose faster than those of goods destined for sale, reversing the trend established in the previous subperiod. Meanwhile, the economy entered a new growth cycle and so the level of employment recovered.
By the beginning of 1995, the rise in the level of overall employment was sufficient to produce an abatement in the rate of open unemployment. Subsequently, in the wake of the Mexico crisis, the rate of open unemployment started to increase once more, becoming more acute in 1997 owing to stagnation in aggregate employment (see Graphs 14 and 15).
Graph 15
Once again, the evolution of the level of employment in the three sectors of the economy anaylsed separately (Graphs 16, 17 & 18) shows a similar pattern which is even clearer than the pattern visible at the beginning of the decade (see Graphs 3, 4 & 5). Industrial employment tends to diminish as from 1995, despite the growth in output, whereas employment in commerce and the services sector increases sharply until the end of 1996 when a clear trend toward stagnation sets in. Thus, in the immediate wake of stabilisation, growth in employment in the commerce and services sectors more than compensates the slump in industrial employment. But this ceases to be the case as from 1997. The result is a clear upward trend in the rate of open unemployment from this point onwards, reaching a head in 1998 when the level of employment fell in both these sectors.
Graph 16
O p e n U n e m p l o y m e n t R a t e - M L S
4 , 4 4 , 6 4 , 8 5 , 0 5 , 2 5 , 4 5 , 6 5 , 8 6 , 0 6 , 2 6 , 4 6 , 6 6 , 8 7 , 0 7 , 2
Jul-94 Oct-94 Jan-95 Apr-95 Jul-95 Oct-95 Jan-96 Apr-96 Jul-96 Oct-96 Jan-97 Apr-97 Jul-97 Oct-97 Jan-98
1 2 - m o n t h c e n t r e d m o v i n g a v e r a g e - D e s e a s o n a l i s e d D a t a
E m p l o y m e n t - B r a z i l - M L S
9 2 9 3 9 4 9 5 9 6 9 7 9 8 9 9 1 0 0 1 0 1
Jul-94 Oct-94 Jan-95 Apr-95 Jul-95 Oct-95 Jan-96 Apr-96 Jul-96 Oct-96 Jan-97 Apr-97 Jul-97 Oct-97 Jan-98 Apr-98
Graph 17
Graph 18
E m p l o y m e n t i n I n d u s t r y - M L S
6 7 6 9 7 1 7 3 7 5 7 7 7 9 8 1
Jul-94 Oct-94 Jan-95 Apr-95 Jul-95 Oct-95 Jan-96 Apr-96 Jul-96 Oct-96 Jan-97 Apr-97 Jul-97 Oct-97 Jan-98 Apr-98
1 2 - m o n t h c e n t r e d m o v i n g a v e r a g e B a s e : J u n / 9 0 = 1 0 0
E m p l o y m e n t i n S e r v i c e s - M L S
9 8 1 0 0 1 0 2 1 0 4 1 0 6 1 0 8 1 1 0 1 1 2 1 1 4
Jul-94 Oct-94 Jan-95 Apr-95 Jul-95 Oct-95 Jan-96 Apr-96 Jul-96 Oct-96 Jan-97 Apr-97 Jul-97 Oct-97 Jan-98 Apr-98
As the rate of open unemployment subsided, real earnings for workers in the commerce and services sectors rapidly picked up. However, another relevant phenomenon that should be taken into account is the change in relative prices favouring sectors producing non-tradeable goods. As long as this change in relative prices persists (i.e. until mid-1996), real earnings for workers in these sectors increased. At the end of the period, as the level of employment began to fall, the rate of open unemployment to rise and relative prices to cease favouring the products of these sectors, workers in commerce and the services sector began to suffer a systematic loss of real earnings.
In the industrial sector, despite the sharp fall in the level of employment, workers’ real earnings increased until the end of 1998. The drop in the level of industrial employment was due to more intense deregulation of trade, the effect being heightened by the exchange anchor. Contrary to what had happened in the first subperiod, though, change in the behaviour of relative prices led the prices of non-tradeable goods to rise faster than those of goods destined for sale following the stabilisation of the economy and the adoption of an exchange anchor. This strongly boosted the real cost of labour in industry. Between mid-1994 and the end of 1997, the real cost of labour in industry rose 30 percentage points.
This conjunctural effect intensified the structural effect of more open trade on industrial employment, which fell even further. It was only in 1998, when the Asian crisis depressed the level of economic activity, that both real wages and the cost of labour in industry began to fall.
Estimates show that from 1994 onward the behaviour of the rate of unemployment begins to differ somewhat from the previous subperiod. Reallocation shocks and output begin to play a less important part than the structural component, which begins to assume a key role.
Graph 19 displays effective rates of unemployment and those forecast one period ahead projected by equation 1 as from 1995. It is clear from the graph that there is an increase in the rate
E m p l o y m e n t i n C o m m e r c e - M L S
9 8 1 0 0 1 0 2 1 0 4 1 0 6 1 0 8 1 1 0
Jul-94 Oct-94 Jan-95 Apr-95 Jul-95 Oct-95 Jan-96 Apr-96 Jul-96 Oct-96 Jan-97 Apr-97 Jul-97 Oct-97 Jan-98 Apr-98
of unemployment that cannot be explained by variations in output or reallocation shocks. The forecast rate is always lower than the effective rate recorded in the last two years.
Graph 19
In brief, the 1994-1998 subperiod was marked by an increase in workers’ real earnings in every sector of economic activity, increased employment in the commerce and services sectors and declining employment in the industrial sector. The level of unemployment dropped immediately after stabilisation occurred owing to an increase in demand brought about by the drastic reduction in the rate at which prices were rising. In the aftermath of the Mexico crisis it began to climb again.
III - Stylised Facts - an attempt at explanation
Having described the stylised facts of Brazil’s metropolitan labour market in the nineties, we can proceed to come to grips with these facts.
Coming to grips with stylised facts means being able to explain them on the basis of a consistent model for the operation of the labour market. The model we shall be using in this chapter is the straightforward model of supply and demand for labour. In this model, the basic underlying premise is that the demand curve is formed by corporate maximising of profits. In the long term, this means that a company will only take on another worker if the value of the worker’s productivity is the same as the cost of hiring him, or greater than that cost in the case of uncompetitive markets.
On the labour supply side, the traditional hypothesis is optimisation in allocating the worker’s time among the various options available. This generates an upward supply curve. For the purposes of the present chapter, we shall focus on the 1994-1998 subperiod subsequent to the stabilisation of the economy.
The hallmarks of this period are economic growth, increased employment and real earnings in the commerce and services sector contrasting with declining employment, rising real earnings and
F o r e c a s t a n d E f f e c t i v e R a t e o f
U n e m p l o y m e n t
0 , 0 0 2 , 0 0 4 , 0 0 6 , 0 0 8 , 0 0
92.1 92.3 93.1 93.3 94-1 94-3 95-1 95-3 96-1 96-3 97-1 97-3
the higher real cost of labour in the industrial sector. Consequently, for it to be possible to explain this behaviour by means of a model of supply and demand for labour, the demand curves for labour would have to have turned upward in both sectors. However, since industrial employment declined, the displacement of the demand for labour curve should have been accompanied by a displacement to the left of the supply curve for labour in this sector.
Figures 1 and 2 below show the direction of the displacements of the supply and demand curves relating to supply and demand for labour in the industrial and services sectors in the period under examination that may explain the stylised facts described in the previous section.
Figure 1 -Industry
Wage D1 S1 S0 D0
c `w2
d b
S1 a
w1
S0 D1
D0
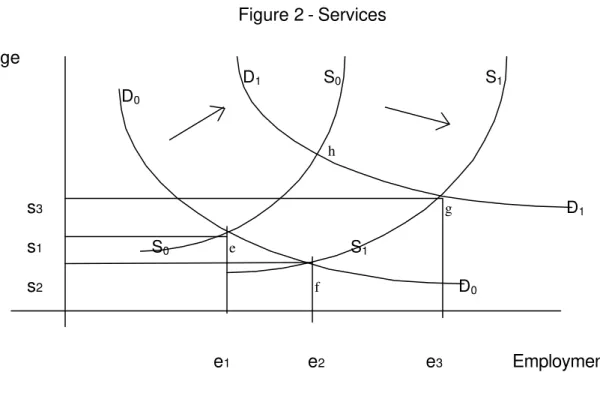
Figure 2 - Services
Wage
D1 S0 S1 D0
h
s3 g D1
s1 S0 e S1
s2 f D0
e1 e2 e3 Employment
Let us initially take the industrial sector. As we have seen, the three main stylised facts in this sector were the rise in real earnings, the increase in the real cost of labour and a reduction in the level of employment. This behaviour can only be explained by a model of supply and demand for labour if:
a. the supply curve for labour has moved to the left while the demand curve has remained
stable. In the figure above these movements are represented by the displacement of the demand
curve for labour from S0S0 to S1S1. The industrial labour market would then move from point a to
point d in the figure.
Or,
b. the demand for labour curve moved to the right, from D0D0 to D1D1, at the same time
as the labour supply curve was moving more than proportionally to the left. Point c in the figure.
Or,
c. the demand curve for labour has moved left, from D0D0 to D1D1, in conjunction with a
more than proportional upward shift of the labour supply curve, S0S0 to S1S1.
In all three cases, for it to be possible to explain the stylised facts described in the industrial sector labour market by using a labour supply and demand model, it is essential for the labour supply curve in the industrial sector to move to the left. In other words, the supply of labour in the industrial sector at each level of pay must have diminished.
these facts on the basis of a supply and demand model for labour. This figure shows the following possibilities:
a. a move to the right of the demand for labour curve, from D0D0 to D1D1, with the supply
curve remaining stable. Point h in Figure 2;
or,
b. a simultaneous displacement of the demand curve from D0D0 to D1D1, and of the supply
curve to the right from S0S0 to S1S1, providing the demand curve moves more than proportionally to
the labour demand curve. Taking point e as the starting point, the labour market would be moving
towards point g in Figure 2;
or,
c. the demand curve for labour has moved to the right at the same time as a less than
proportional move to the left of the labour supply curve in this sector.
In the services sector, therefore, the most important feature to stress is that for the stylised facts described to be explained on the basis of a labour supply and demand model, it is essential for the demand for labour curve to move to the right. Put another way, the value of the marginal productivity of labour must have increased throughout the period.
Given these possiblities, which combinations could have generated stylised facts in both sectors at the same time? The first possibility is that the industrial labour supply curve has moved to
the left (from S0S0 to S1S1) while that for the services sector has remained stable (at S0S0). At the
same time, the services sector labour demand curve has moved to the right (D0D0 in Figure 2) and
the industrial sector demand for labour curve has remained stable (at D0D0 in Figure 1). Combination
(a, a).
For this combination to be capable of explaining the behaviour of Brazil’s metropolitan labour market in the post-stabisation period, there should be a reduction in the proportion of the Population at Working Age in relation to the Economically Active Population. This is presuming that the supply of labour in the industrial sector has moved to the left and the supply of labour in the services sector has remained stable.
Table 2 shows the proportion of the labour force in Brazil’s metropolitan population between 1991 and 1996. As can be observed, there is no downward trend in this proportion in the 1994-1997 period. On the contrary, if any trend were visible it would be a slightly upward trend.
Table 2
Workforce Share Ratio 1991-1996
Year Share Ratio
1991 average 1992 average
1993 average 1994 average 1995 average 1996 average
58.74 59.26 59.27 59.56 Source: MLS/IBGE
Furthermore, in this combination, the productivity of labour in the industrial sector would have remained constant since the demand for labour curve would not have moved. As we shall see in the next section, there is strong evidence that this was not the case but rather that the productivity of labour in the industrial sector improved in this period. We can therefore discard combination (a,a) as a tenable explanation of the stylised facts described above.
However, if the industrial labour supply curve has moved leftwards (to S1S1) and the share
ratio has not diminished, the labour supply curve for the services sector must have moved to the right
(to S1S1). Put another way, the workers displaced from their jobs in the industrial sector instead of
seeking new jobs in the same sector, have begun to offer their labour in the services sector. Since industrial jobs have higher productivity and better wages, this displacement seems hard to explain, in principle.
The displacement of workers can be explained by technological changes and, consequently, changes in the qualifications industry has been demanding in the post-stabilisation period. Following the opening up of the economy and the rising value of the local currency, new, more modern machinery and equipment was installed in Brazil’s factories. This made many workers previously employed in industry “unqualified” or made their qualifications seem unsuitable. Incapable of retraining, the only alternative for many of these workers was to seek employment in the services sector, which demands fewer qualifications than industry and where technological change is less frequent and less drastic. Thus, a reasonable explanation for this behaviour is that a sizeable portion of the workers displaced from jobs in the industrial sector by new technologies have decided to seek employment in the services sector, moving the labour supply curve in this sector to the right.
A second explanation is related to the change in relative prices. Following the adoption of the exchange anchor, relative prices changed drastically in favour of non-tradeable goods, the price of services rising faster than industrial prices. As real wages incorporate the price of services, pressure on nominal wages is determined by these prices, whereas the price of industrial goods depends on the price of imported products. In other words, the real cost of labour began to outpace growth in real wages in industry.
Unable to raise their prices and, at the same time, unable to resist pressure from the workforce for nominal wage increases to offset the increased prices of services, employers were obliged to let the real cost of labour rise systematically throughout the period. Displacement of the labour supply curve merely reflected this disparity in the evolution of relative prices.
Nonetheless, if the (a,a) combination fails to explain the stylised facts satisfactorily and if the labour supply curve for the services sector moved to the right, any combination including
hypothesis c for the services sector must be ruled out. This leaves the (b,b) and (c,b) combinations
as feasible explanations for the facts. The (b,b) combination implies a leftward displacement of the
displacement of the same curve in the services sector (from S0S0 to S1S1 in Figure 2) in conjunction
with a move to the right in both sectors of the demand for labour curve (to D1D1 in both figures).
That indicates labour productivity gains in both sectors. In the case of combination (c,b), the movement of the labour supply curves would be the same and the demand for labour curve would
move to the left in the industrial sector (from D0D0 to D1D1 in Figure 1) and to the right in the
services sector (from D0D0 to D1D1 in Figure 2). In other words, labour productivity would improve
in the services sector and decline in the industrial sector. These are the possible choices. The decision as to which to choose is an empirical matter be analysed in the next section.
IV - Marginal Productivity versus Relative Prices
The displacements of the demand curve for labour in a particular sector may be related to the movement of two variables: variations in relative prices in the economy and/or variations in the marginal productivity of labour. To examine this, we must express the condition for a company to be maximising profits:
w = ps. Mgp
where: w = nominal wage
ps = sector price
Mgp = marginal productivity of labour in the sector
dividing both sides by the consumer price index, one obtains:
w/pc = ps/pc.Mgp
∆(w/p) = ∆(ps/pc) + ∆pmg
In other words, an increase (reduction) in the relative sector price in relation to the consumer price index will mean that, at the optimal point, the company will pay a higher (lower) real wage for the same marginal productivity of labour. Put another way, a change in relative prices in favour of (against) the sector implies a movement to the right (left) of the demand for labour curve.
A change in relative prices is a conjunctural factor that depends on the level of economic activity, on the one hand, and the exchange rate policy, on the other. As services sector prices are more flexible than industrial prices, an increase (reduction) in the level of activity tends to increase (reduce) the services sector’s relative prices in relation to the industrial sector. In this context, the displacement of the demand curve may be temporary owing to the reduced rate of economic growth.
Similarly, given the relative prices in the economy, the demand curve for labour will move if the marginal productivity of labour varies. Differently from relative prices, this is a structural factor associated with greater availability of physical and human capital in each branch of economic activity.
The demand curve for labour in the industrial sector or in the services sector may thus move to the right (left) for two reasons:
• a structural factor - the marginal productivity of labour in the sector increasing (diminishing).
To what extent each of these factors is responsible for the movement is an empirical matter to be examined in this section.
One of the effects of the stabilisation plan was a substantial change in relative prices favouring non-tradeable goods (especially in the services sector) to the detriment of tradeable goods (industrial goods in particular). Graphs 20 and 21 show the evolution of the relation between consumer prices and industrial prices (Graph 20) and between consumer prices and services prices (Graph 21) from January 1994 to August 1997.
The graphs show that between January and July 1994 consumer prices and industrial prices varied at approximately the same rate. Following the stabilisation of the economy in July 1994, industrial prices began to vary at a much slower pace than consumer prices in general until June 1996. During this span of time, consumer prices grew 23% more than industrial prices.
The opposite holds in the services sector. From January 1994 until August 1995 services sector prices rose above the average rate for prices in the economy. Between July 1994 and August 1995 the price of services rose 13% above the average for consumer prices.
Graph 20
Graph 21
IPC-Fipe (Retail Price Index)/IPA-Industry (Wholesale
Price Index)
(Base:Jan/94=100)
90
100
110
120
130
These two indicators suggest that the demand for labour curve moved to the right in the
services sector due to an increase in the relative prices for the sector (from D0D0 to D1D1 in Figure
2). That means workers’ wage gains in this sector were partly due to this change in relative prices.
On the other hand, the change in relative prices to the detriment of the industrial sector implies a movement to the left of the demand for labour curve. This is an effect that may be short lived since it is associated with the use of the exchange rate as an anchor to control the rate of inflation and with the surge in demand caused by stabilisation itself. Changes in the exchange rate policy and/or a less dynamic level of economic activity would reverse this effect.
The second factor that may have generated displacements in the demand curves for labour in these two sectors is variations in the marginal productivity of labour. Marginal productivity of labour indicators are difficult to obtain. However, based on the premise that a company will only hire a new worker if his productivity is equal to or greater than the cost of hiring him, the evolution of the starting wages paid to workers in each sector, deflated by the sector’s own price index, provides a proxy for gauging the marginal productivity of labour.
Statistics on starting wages are available for the formal segment of the Brazilian labour market based on data from Ministry of Labour Law 4,923. The evolution of these two variables shows that the hiring wage in both sectors follows a very similar pattern: a drop in the immediate aftermath of stabilisation, between July and December 1994, and a significant increase from then onward. The initial drop probably reflects the inability of workers in these sectors to capitalise on short-term productivity gains.
In the case of the services sector, the sharper reduction in the hiring wage deflated by the sector’s own price index likewise reflects the workers’ inability to appropriate the rise in the sector’s relative prices in the early phases of the stabilisation process. Note that this is precisely the period in which these relative prices rose most sharply.
Nonetheless, the systematic rise in hiring wages from the beginning of 1995 to the present day is convincing evidence of major marginal productivity gains in both the industrial and services sectors of the Brazilian economy. If we take July 1994 as the point of reference, these gains were 25% in the industrial sector and 5% in the services sector.
IPC-Fipe (Retail Price Index)/IPC Services (Services Price Index)
( B a s e : J a n / 9 4 = 1 0 0 )
8 0 8 5 9 0 9 5 1 0 0
In other words, the marginal productivity gains of labour in the industrial sector are more than sufficient to offset the change in relative prices that were detrimental to the sector. This implies a move to the right of the demand curve for labour in industry. Meanwhile, productivity gains in the services sector, in line with the change in relative prices, benefitting this sector suggest a move to the right also of the demand for labour curve in the services sector.
Table 3
Evolution of Workforce Qualifications
Year zero years of
schooling
0 to 4 years of schooling
4 to 8 years of schooling
8 to 12 years of schooling
12 plus years of schooling 1989 1990 1991 1992 1993 1994 1995 1996 8% 8% 7% 7% 7% 6% 6% 5% 30% 29% 29% 29% 28% 28% 27% 26% 20% 21% 20% 20% 20% 20% 21% 21% 31% 32% 32% 33% 34% 34% 35% 37% 11% 11% 11% 11% 11% 11% 12% 12% Source: MLS/IBGE
The table depicts a clear improvement between 1989 and 1996 in the level of schooling among the workforce employed in the Brazilian economy. The percentage of workers with less than four years of schooling fell from 38% in 1989 to 31% in 1996 while the percentage of the workforce with more than eight years of schooling rose from 42% to 49%.
Table 4 shows how this increase in schooling was distributed among the different sectors of the economy (industry, commerce and services).
As can be observed from the table, the proportion of workers with more than eight years of schooling has increased in all three sectors of economic activity, the opposite occurring with the proportion of less educated workers. The industrial sector displays the biggest percentage increase (eight percentage points) whereas in commerce and the services sector the increase was six percentage points in a seven-year period. There was thus a general increase in the level of qualification of the labour force in Brazil in the period examined, from which one can surmise labour productivity gains.
In conclusion, the analysis presented indicates that in the post-stabilisation period the labour supply curve moved to the left in industry and to the right in the services sector. At the same time, the demand curves for labour moved to the right in both sectors. Therefore, in terms of explaining the stylised facts described in section 2 of this chapter, the (b,b) combination appears to be the most plausible option.
The data also suggest that a positive productivity shock has been under way in both the industrial and the services sectors of the Brazilian economy in this period. In this respect, the gains are greater in industry than in the services sector.
wage gap between these sectors has actually diminished due to changes in relative prices benefitting the services sector - a conjunctural factor that may be reversed when the level of activity slumps.
Table 4
Workforce Qualifications by Economic Sector
Years of Schooling 1989 1993 1996
Industry
0 to 4 years 4 to 8 years 8 to 12 years 12 plus years
32% 24% 34% 10% 28% 24% 38% 10% 25% 24% 41% 11% Commerce
0 to 4 years 4 to 8 years 8 to 12 years 12 plus years
25% 23% 44% 8% 23% 22% 47% 8% 21% 22% 49% 9% Services
0 to 4 years 4 to 8 years 8 to 12 years 12 plus years
33% 21% 32% 14% 31% 21% 34% 14% 27% 22% 37% 15% Source: MLS/IBGE
Table 5
Dependent Variable: Unemployment
Variables (1) (2)
Unemploymentt-1 0.95 (25.02)** 0.97 (23.76)**
GDPt -9.77 (5.91)** -8.90 (5.52)**
GDPtt-1 -4.82 (3.17)** -6.10 (3.88)**
Dispersiont -0.005 (0.33) -
Dispersiont-1 0.04 (2.46)** -
Seasonal dummy 1 0.10 (0.40) 0.55 (2.50)**
Seasonal dummy 2 0.68 (2.38)** 0.87 (3.49)**
Seasonal dummy 3 -0.10 (0.30) 0.40 (1.48)
Seasonal dummy 4 -1.23 (4.54)** -0.88 (3.74)**
Trend 0.03 (1.95)* 0.03 (2.47)**
Observations 58[83:3-97:4] 60[83:3-98:2]
Jarque-Bera 1.11 2.87
R2 adjusted 0.94 0.93
R2 0.93 0.94
Notes: -t statistics are shown in brackets. (*) and (**) indicate that the coefficients are significant at 10% and 5%, respectively.
Equation (2) provides the results of including data for the first quarters of 1998 as a way of attempting to explain the leap in the rate of unemployment as from January 1998. The estimate excludes the dispersion rate owing to the lack of data for these quarters. It is worth noting that the sharp increase in the unemployment rate in 1998 makes the trend even more significant since services and commerce prove incapable of compensating the slump in industrial employment.
V - Implications for Professional Training and Unemployment
The behaviour of Brazil’s metropolitan labour market described in section three above has serious implications for professional training in the country and for the pattern of unemployment. Firstly, we should ask how the professional training system should adapt to the new qualification requirements demanded by industry. Secondly, given the availability of resources in the system, we should consider two options: on the one hand, training newcomers to the labour market to meet the demands of these new occupations; and on the other, developing a system of retraining and requalification of workers being displaced from the industrial sector who can no longer find employment in industry.
capacity to compete on an equal footing with young people entering the labour market once retraining and requalification have occurred. Young people have been made familiar throughout their education and training with new technologies without the drawback of having spent a large part of their professional lives using technologies that have since become obsolete.
Some analysts argue that it is extremely hard and expensive to retrain older workers. They have been qualified and trained in obsolete technologies and will have difficulty competing with newcomers in the labour market. If that is true, the professional training system should concentrate on qualifying those about to enter the labour market, using modern technology and new techniques for management and labour relations. That option, however, poses a serious problem of how to relocate older workers and avert an increase in the rate of structural unemployment in the economy.
A second important aspect is the reduction in the level of industrial employment. How should a labour qualification system treat a sector that has been shedding jobs in a drastic, systematic manner? How can one justify spending money to qualify workers for a sector that generates a marginal number of new jobs in a country where unemployment is becoming a serious bane? In this sense, it may be more efficient from the point of view of allocating resources to gear professional education institutions to training and qualifying workers for auxilliary services supporting industrial activity. Such services are vital to industry although the workers are not directly employed by industrial corporations.
The second conundrum raised by the results described above is how to deal with the problem of the rise in open unemployment in the Brazilian economy. Note that in other periods when open unemployment swelled it was in response to short-term cyclical movements. If the analysis presented is correct, the expansion of open unemployment in the current state of the Brazilian economy has a significant structural component. This is bound to lead to an increase in the rate of long-term unemployment. In other words, even when growth resumes, open unemployment will take longer to abate than in previous periods. This is already reflected in the average length of time in which workers remain unemployed (6 months in 1998 compared with 3.5 months in 1991) and in higher unemployment among heads of families.
This matter is directly related to the incentives Brazilian labour market regulations create for workers and companies. The crucial point to consider is that current legislation favours extremely short labour contracts discouraging cooperation between workers and corporations in the production process. Two factors should be considered.
First, when the economy is growing and the rate of unemployment is low, there is an incentive for workers to seek dismissal. This is because, should they be dismissed, workers receive compensation equivalent to one month’s wages plus 40% of a fund (FGTS) built up on their behalf by the employer’s company. For every year worked, the company deposits one month’s wages in the fund. This incentive is all the greater the lower the rate of unemployment and the easier it is to find a new job.
Courts once he has been dismissed. He refuses to do so while he is employed for fear of being dismissed in reprisal. Once he has been fired, he submits his claims to a Labour Tribunal where the process of conciliation between workers and employers is similar to an individual negotiation. This encourages employers to pay such rights solely in the Courts and workers to prefer dismissal so they can receive at least part of the money they are entitled to. Therein may lie one of the explanations for the percentage of wage earners hired under no legal contract (an illegal practice) being over 25% of the workforce and on the rise in Brazil.
The outcome is very short-lived labour relations (approximately 33% of workers in the formal labour market in Brazil change jobs every year) hampering incentives to invest in human capital. Responsibility for training and qualification of workers thus rests squarely on the shoulders of the State. Owing to fiscal constraints, the investment the State can afford is insufficient to solve the problem of the mismatch between the qualification structure provided and the demand generated by structural changes. On the other hand, as nobody understands their needs so well as companies themselves, the type of qualification the State provides does not necessarily match corporate needs.
In this context, the solution would be to eliminate benefits granted to workers when they are dismissed. Unemployment pay should be maintained as should the fine for dismissal. The fine, though, could be better used to finance unemployment pay as opposed to being appropriated individually by the dismissed worker, as is the case at present. Secondly, negotiations concerning workers’ rights should be transferred from Labour Tribunals to the shop floor by the Trades Unions. In that case, negotiations would precede dismissal. These two measures would increase the duration of labour contracts and encourage investment in specific training and qualification on the part of corporations and workers alike.
V - Conclusions
In this chapter we have examined the performance of Brazil’s metropolitan labour market in the 1990-1998 period. We have demonstrated that the level of employment has declined in industry and expanded in the commerce and services sectors. Higher employment in these two sectors, however, has been insufficient to offset the fall in industrial employment.
The results of estimates have shown that transformations affecting the structure of the economy at the beginning of the nineties produced an increase in unemployment in the early years of the decade because the labour market was slow to adjust, displacing workers from industry to services and commerce. Moreover, variations in output and reallocation shocks fail to explain the upsurge in unemployment following the stabilisation of the economy.
We have likewise shown that the data available register a major increase in the marginal productivity of labour in industry, which has been more than sufficient to compensate losses due to changes in relative prices emerging in the wake of economic stabilisation. The demand curve for labour in industry has thus also moved to the right. On the other hand, the marginal productivity of labour in the services sector has also grown remarkably throughout the period, though at a lower rate than in industry.
Another relevant aspect examined in this chapter is the trend for growth in the rate of open unemployment emerging in 1997. It stems from the failure of the commerce and services sectors fully to compensate the loss of jobs in industry. This development suggests a trend toward increased structural unemployment in the Brazilian economy. To prevent this from happening, the authors propose changes to legislation governing the operation of the Brazilian labour market. The aim is to ensure that incentives for training and qualification are more evenly distributed among the State, companies and workers.
Bibliography
Lilien, David (1982). Sectoral shifts and cyclical unemployment, Journal of Political Economy,
n.90
Reis, Maurício Cortez (1999). Choques setoriais e desemprego no Brasil. Rio de Janeiro: