A contribution for a global burned area map
J.M.N. Silva
Department of Forestry, Instituto Superior de Agronomia, Tapada da Ajuda, 1349-017 Lisboa, Portugal. Email: [email protected]
A.M.O. Sousa
Department of Rural Engineering, Universidade de Évora, Apartado 94, 7002-554 Évora, Portugal. Email: [email protected]
J.M.C. Pereira
Cartography Centre, Tropical Research Institute, Travessa do Conde da Ribeira 9, 1300-142 Lisboa, Portugal. Email: [email protected]
K. Tansey & J-M. Grégoire
EC-Joint Research Centre, Institute for Environment and Sustainability, Global Vegetation Monitoring Unit, TP 440, Via Fermi 1, I-21020 Ispra (VA), Italy. Email: [email protected];jean-marie.gregoire @jrc.it
Keywords: burnt area mapping, discriminant analysis, classification trees, SPOT-VEGETATION ABSTRACT: The goal of this work was to develop methodologies for burned area mapping at 1 km resolution using SPOT-VEGETATION (VGT) images from tropical (Southeastern Africa and Brazil), temperate (Iberian Peninsula) and boreal (Eastern Siberia / Northeastern China) re-gions. For each study area seven months of daily images were used in order to map the areas burned during the entire fire season. Linear discriminant analysis or classification trees were ap-plied, depending on the study area, to monthly composite images derived from the daily images, and monthly burned area maps were produced. The final VGT 1 km burned area maps were vali-dated with burned area maps derived from 30 m Landsat imagery, using linear regression. Twenty-four Landsat scenes were used in the validation of the maps produced for the four study areas. The accuracy of the VGT maps was variable, dependent on vegetation type and on the spatial pattern of the burned areas.
1 INTRODUCTION
Vegetation fires are a global phenomenon occurring in tropical, temperate and boreal regions. Biomass burning is a regular feature in the tropical forests of Brazil and Indonesia, the temperate forests of the United States and Europe, the boreal forests of Siberia, China and Canada, the tropi-cal savannas of Africa and the agricultural lands of the United Sates and Europe [Levine, 1996]. Vegetation fires have several ecological and environmental impacts. Biomass burning is a signifi-cant global source of atmospheric gases such as carbon dioxide (CO2) and methane (CH4), green-house gases that lead to global warming [Levine, 1996].
The estimation of the area burned in the different regions of the globe is a fundamental input to quantify the emissions of those gases. Satellites have an important role to play in detecting, moni-toring and characterizing fire. Satellite data have been used in the last decades and provide a unique source of spatial information for global change researchers [Justice and Korontzi, 2001]. The first burned area maps produced at continental level were the ones produced by Barbosa et al. [1999] for Africa. They relied on satellite imagery from the AVHRR, but at degraded spatial resolution of 5 km, rather than at the original 1.1 km pixel size. Silva et al. [2002] produced monthly maps of the
Forest Fire Research & Wildland Fire Safety, Viegas (ed.) © 2002 Millpress, Rotterdam, ISBN 90-77017-72-0
area burned in southern Africa using satellite imagery at 1 km spatial resolution. It was the first time that the area burned in the region is mapped at 1 km resolution, during an entire fire season
In this work we propose a methodology for burned area mapping at 1 km resolution using SPOT-VEGETATION (VGT) images in tropical (Southeastern Africa and Brazil), temperate (Ibe-rian Peninsula) and boreal (Eastern Siberia / Northeastern China) regions. The final burned area maps were validated with Landsat images. This work is a contribution for The Global Brunt Area 2000 Initiative (GBA 2000), coordinated by the Global Vegetation Monitoring (GVM) Unit of the Joint Research Centre (JRC) of the European Commission, whose objective is to produce monthly burned area maps at 1 km resolution at global scale for the year 2000, using VGT data.
2 THE GLOBAL BURNT AREA 2000 INITIATIVE
The GBA 2000 strategy involves a network approach, coordinated by the JCR, for the development and validation of a series of regional algorithms for processing the daily VGT imagery to burnt area maps [Grégoire et al., 2001]. National institutions from six countries (Australia, Canada, Italy, Por-tugal, Russia and UK) and two international institutions (JRC and UNEP-United Nations Environ-mental Program), are contributing to the project. The JRC has provided to each partner of the pro-ject a temporal and spatial subset, extracted from a global data set, which correspond to his specific region and fire season of interest and/or expertise. Test-sites area located in Canada, Mexico, Ibe-rian Peninsula, Northern Hemisphere Africa, Namibia, Botswana, Southeastern Africa, Australia, China, Russia and Brazil. These test-sites are representative of the boreal forest, tropical wet and dry woodland, tropical moist forest, Mediterranean and temperate regions. In addition to the VGT time series, a set of high resolution Landsat data has been acquired for the validation of the final maps. In the framework of GBA 2000, Brazil is the study area of the partner of Universidade de Évora. Iberian Peninsula, Southeastern Africa and China are the study areas of the partner of Insti-tuto Superior de Agronomia.
3 STUDY AREAS AND DATA
3.1 Study areas
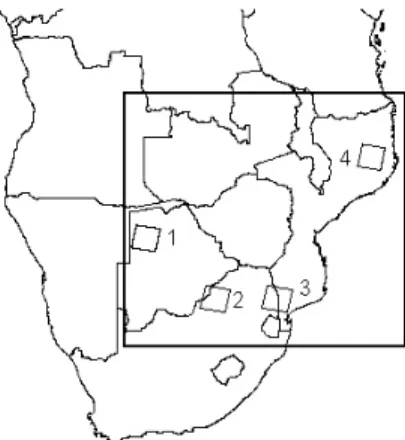
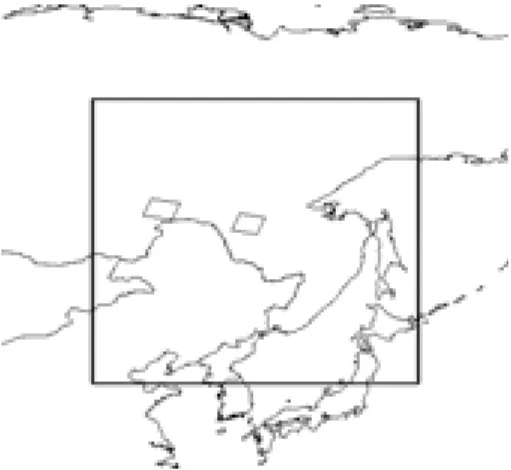
Four study areas were selected in different regions of the globe: two tropical study areas, in South-eastern Africa (22º to 42º E; 10º to 28º S) and Brazil (45º to 75º W; 5º N to 20º S), a temperate study area in the Iberian Peninsula (10º W to 4º E; 35.5º to 44º N) and a boreal study area in East-ern Siberia / NortheastEast-ern China (114º to 146º E; 38º to 65º N). The study area of SoutheastEast-ern Af-rica includes Mozambique, Zimbabwe, Botswana, Zambia, Malawi and Swaziland and parts of the Democratic Republic of Congo, Tanzania, Angola and South Africa. The study area of Brazil com-prises the Amazon region in Brazil and a significant part of Colombia, Peru, and Bolivia. The Ibe-rian Peninsula study area includes the entire area of Portugal and Spain. The Eastern Siberia / Northeastern China study area includes the Amur, Khabarovsk and Yakutia provinces of Siberia and the Heilongjing, Jilin, Liaoning and Inner Mongolia provinces of China. Figures 1 to 4 show the study areas and the location of the Landsat scenes used for validation.
The study area of Eastern Siberia / Northeastern China is characterized by three different ecore-gions with specific climate and vegetation types [Bailey, 1998]. The northern part, corresponding to Siberia, has a subartic climate that shows great seasonal range in temperature, being the winter the dominant season. The small amount of precipitation is concentrated in three warm months and permafrost prevails over large areas. The subartic climate zone coincides with a great belt of nee-dleleaf forest, often referred to as boreal forest, and open lichen woodland known as taiga. In burned-over areas, a mixture of deciduous trees and evergreen is characteristic during secondary succession. The southern part of the study area has a warm or hot continental climate depending on whether the summer is warm or hot. Winter is cool. Mixed boreal and deciduous forests grow
throughout the colder northern parts of this region. The western part of the study area, correspond-ing to Mongolia, is a region of temperate steppes that have semi-arid continental climatic regime in which, despite maximum rainfall, evaporation usually exceeds precipitation. These regions are dominated by grasslands.
The Iberian Peninsula has a mediterranean climate, which is characterized by alternated wet and dry seasons [Bailey, 1998]. This combination of wet winters with dry summers is unique and pro-duces a distinctive natural vegetation of hardleaved evergreen trees and shrubs called sclerophyll, scrub woodland. This type of vegetation reduces water loss with leaves that are small, thick, and stiff, with hard, leathery, and shiny surfaces. Some species are very adapted to fire. The northern coast of Iberian Peninsula has a marine climate, and receives abundant rainfall from maritime polar air masses.
The Southeastern Africa study area has a tropical wet-dry savanna climate, which has a wet sea-son controlled by moist, warm, maritime, tropical air masses and a dry seasea-son controlled by conti-nental tropical masses [Bailey, 1998]. Most of the area of this climate type is covered with wood-land savanna, characterized by open expanses of tall grasses, interspersed with hardy, drought-resistant shrubs and trees. In the dry season, grasses wither into straw and many tree species shed their leaves.
The study area of Brazil is characterised by two vegetation types: evergreen forest distributed by the northern and western areas; and savanna (Cerrado) more prevalent in the southern and eastern areas. The savanna climate is characterised by a long dry season, with high temperatures and low precipitation. The forest climate is more humid [Negreiros et al., 1996].
Figure 1. Study area of Southeastern Africa showing the location of the four Landsat scenes used for validation.
Figure 3. Study area of Eastern Siberia / Northeastern China showing the location of the two Landsat scenes used for validation.
Figure 4. Study area of Brazil showing the location of the ten Landsat scenes used for validation.
3.2 SPOT-VEGETATION data
The VEGETATION instrument, on board SPOT-4, has four spectral bands: Blue (0.43-0.47 µm), Red (0.61-0.68 µm), Near InfraRed (NIR, 0.78-0.89 µm) and Short Wave InfraRed (SWIR, 1.58-1.74 µm). The spatial resolution is 1 km at nadir. The 2200 km swath with allows daily imaging of about 90% of the equatorial regions, the remaining 10% being imaged the following day. At lati-tudes higher than 35º (North and South), all regions are observed daily.
The data used in this work are in the S1 daily synthesis format. S1 data are radiometrically cali-brated, precisely geo-located and corrected for atmospheric effects. Atmospheric corrections are performed using the Simplified Method for Atmospheric Corrections - SMAC [Rahman and Dedieu, 1994]. Multitemporal geo-location accuracy of the VGT data is particularly good [SPOT-VEGETATION Technical Information], and thus the data are well suited for change detection ap-plications, such as the one reported here.
For each study area seven months of daily images were used. The choice of the temporal cover-age of the imcover-agery was related with the temporal distribution of the fire activity. In the study area of Southeastern Africa the dataset covers the period from April to November 2000. In the study
ar-eas of Iberian Peninsula and Brazil the imagery covers the period from April to October 2000 and in the study area of Eastern Siberia / Northeastern China covers the period from March to Septem-ber 2000. In this way, the datasets start one month before the onset of the normal fire season, and extend one month after its end, allowing for the application of a monthly change detection proce-dure for the entire fire season.
3.3 Landsat data
Landsat images, with a spatial resolution of 30 m, were selected within the study areas and used for accuracy assessment. In the study area of Southeastern Africa four Landsat scenes were selected in validation sites with different types of land cover and different fire regimes. In the study area of Brazil, ten Landsat scenes were selected in areas of transition from rain forest to savanna or in ar-eas of deforestation. For the study area of Iberian Peninsula a complete coverage of Portugal was available. For the study area of Eastern Siberia / Northeastern China two Landsat scenes were available, both in forest areas. The path and row coordinates, the date and the sensor type of the Landsat images are given in Table 1 and their location is shown in Figures 1 to 4.
Burnt area maps were derived from each Landsat image, either by visual inspection and on-screen digitizing, or through digital processing using supervised or unsupervised classification. The maps were used as reference data for the accuracy assessment of the burnt area maps derived from the VGT data.
4 METHODS
4.1 Burned area mapping
Monthly image composites were produced for the study areas of Southeastern Africa, Eastern Sibe-ria / Northeastern China and IbeSibe-rian Peninsula, from daily VGT images using the minimum NIR criteria procedure developed by Stroppiana et al. [2002]. These composites were produced by the GVM Unit of JRC and a cloud and snow mask, a cloud shadow mask and a non-vegetated surface mask (exclusion of bare ground, urban areas and water) were applied to the daily images [Grégoire et al., 2001]. For the study area of Brazil monthly composites were produced from daily VGT data by selecting the third lowest NIR value of the month [Cabral et al., 2002].
The mapping of burned areas in the Southeastern Africa, Eastern Siberia / Northeastern China and Iberian Peninsula study areas was performed using the Linear Discriminant Analysis [Mardia et al., 1979; Volle, 1981]. Linear Discriminant Analysis is a multivariate statistical method that identifies a set of new variables that best discriminates between two or more groups or classes, i.e., maximizes the separability between groups. It’s an adequate technique to our problem since our main objective is the classification of VGT composite images into burnt or unburnt classes. The method was applied to the VGT monthly composites in a multitemporal change detection mode, being mapped in each month only the new burned areas that weren’t mapped in the previous months.
In the study area of Southeastern Africa the variables used were the NIR and SWIR bands of VGT and a spectral index defined as:
3
SWIR NIR RED
Albedo= + + .
In this equation RED, NIR and SWIR are the reflectance in the Red, Near InfraRed and Short Wave InfraRed bands of VGT.
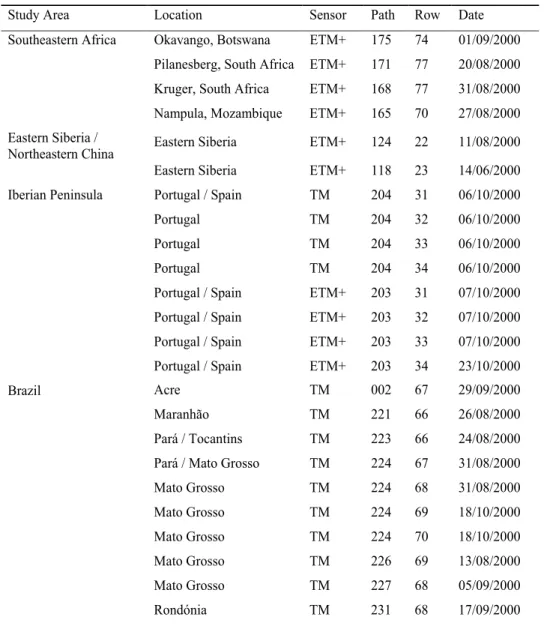
Table 1. Location, sensor type, path and row coordinates and date of the Landsat images used for accuracy assessment in each study area.
Study Area Location Sensor Path Row Date
Southeastern Africa Okavango, Botswana ETM+ 175 74 01/09/2000 Pilanesberg, South Africa ETM+ 171 77 20/08/2000 Kruger, South Africa ETM+ 168 77 31/08/2000
Nampula, Mozambique ETM+ 165 70 27/08/2000
Eastern Siberia /
Northeastern China Eastern Siberia ETM+ 124 22 11/08/2000
Eastern Siberia ETM+ 118 23 14/06/2000
Iberian Peninsula Portugal / Spain TM 204 31 06/10/2000
Portugal TM 204 32 06/10/2000
Portugal TM 204 33 06/10/2000
Portugal TM 204 34 06/10/2000
Portugal / Spain ETM+ 203 31 07/10/2000
Portugal / Spain ETM+ 203 32 07/10/2000
Portugal / Spain ETM+ 203 33 07/10/2000
Portugal / Spain ETM+ 203 34 23/10/2000
Brazil Acre TM 002 67 29/09/2000
Maranhão TM 221 66 26/08/2000
Pará / Tocantins TM 223 66 24/08/2000
Pará / Mato Grosso TM 224 67 31/08/2000
Mato Grosso TM 224 68 31/08/2000 Mato Grosso TM 224 69 18/10/2000 Mato Grosso TM 224 70 18/10/2000 Mato Grosso TM 226 69 13/08/2000 Mato Grosso TM 227 68 05/09/2000 Rondónia TM 231 68 17/09/2000
In the study area of Iberian Peninsula the variables used were the NIR spectral band and the NDVI (Normalized Difference Vegetation Index) and SWVI (Short Wave Vegetation Index) indices defined as: RED NIR RED NIR NDVI + − = and SWIR NIR SWIR NIR SWVI + − = .
In these equations RED, NIR and SWIR are the reflectance in the Red, Near InfraRed and Short Wave InfraRed bands of VGT.
In the study areas of Southeastern Africa and Iberian Peninsula, the predictor variables used to classify the burns that occurred in a particular month m, were the variables from month m and the temporal difference between the previous month (m-1) and month m. Using these post-fire and dif-ference variables, the classifier flags as burned areas the areas that show low values of the variables in the month under analysis and exhibit a strong decrease in the values of the variables when com-pared with the previous month.
In the study area of Brazil the burnt area mapping algorithm was developed using a supervised classification tree [Breiman et al., 1984]. Classification trees are a non-parametric method based on binary recursive partitioning and have been applied successfully to remotely sensed data. The pre-dictor variables used to classify the burns that occurred in month m, were:
REDm-1, NIR m-1, SWIR m-1, NIR m, SWIR m, SWIR m+1and NIR m – NIR m-1.
RED, NIR and SWIR are the reflectance in the Red, Near InfraRed and Short Wave InfraRed bands of VGT; m is the month in analysis, m-1 is the previous month, m+1 is the following month, NIRm – NIR m-1is the difference between the NIR reflectance values in the month in analysis and the previous month.
In all study areas a training data set was extracted from all the monthly composite images and pooled together to create a single classification applicable to the entire fire season.
4.2 Validation
The maps produced with low resolution remotely sensed data, such as the maps produced with VGT images, must be validated in order to document the limits of their reliability and applicability. The validation procedure implemented in this study followed the work of Boschetti et al. [2001]. The accuracy assessment of the final burned area map involves the use of independent map data, derived from the 30 m resolution Landsat imagery. Accuracy of the coarse resolution burned area maps produced with the VGT images was assessed through linear regression analysis between the proportion of area burned in 15 × 15 km windows located within each Landsat frame, according to a systematic sample grid. The main advantage of this approach is that quantifies the bias in burned area estimation present in the low resolution burned area maps, such as the VGT maps.
5 RESULTS
So far, the linear discriminant functions were derived for the Southeastern Africa and the Iberian Peninsula study areas. In the framework of the GBA 2000 project these discriminant functions were used to derive monthly burned area maps for Africa and Southern Europe, respectively. These maps were validated with the Landsat scenes available for each study area. The classifier for burned area mapping in Eastern Siberia / Northeastern China region is in development.
For the study area of Brazil was developed the burned area mapping algorithm based on the classification trees theory and produced a monthly burned area map.
5.1 Burned area maps
Figure 5 shows the area burned monthly from May to November 2000, derived for Southern Africa with the linear discriminant function developed with the VGT data from the Southeastern Africa study area.
Figure 6 shows the area burned monthly from June to October 2000, derived for Brazil and Bo-livia with the classification trees algorithm.
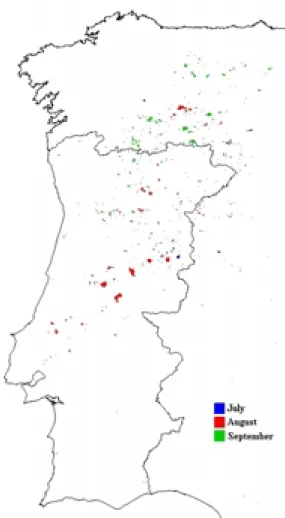
Figure 7 shows the area burned monthly from July to September 2000, in Portugal and Western Spain, where the fire activity was more relevant in the Iberian Peninsula.
Figure 5. Monthly burned area in Southern Africa from May to November 2000.
Figure 7. Monthly burned area in Portugal and Western Spain from July to September 2000.
5.2 Validation
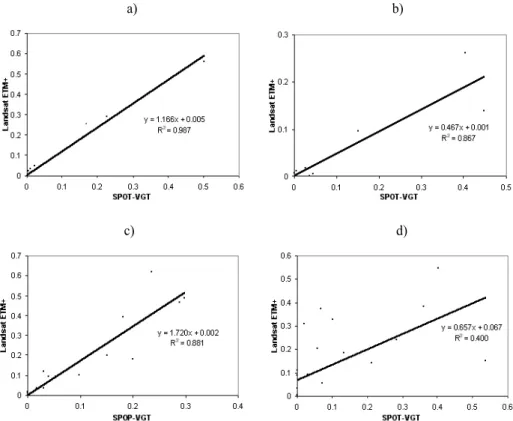
In the validation of the burned area map produced for the Southern Africa, four Landsat ETM+ im-ages were used, and a linear regression analysis was performed for each Landsat scene separately since the fire regime is different in the different validation sites. For example, in the validation site of Kruger, South Africa the burned areas are large and isolated while in the validation site of Nam-pula, Mozambique are small and burn continuously the area through the fire season. Figure 8 shows the individual linear regressions for the validation sites of Okavango, Botswana; Pilanes-berg, South Africa; Kruger, South Africa and Nampula, Mozambique.
In the validation of the VGT burned area map produced for the study area of Iberian Peninsula, was used a 30 m resolution burned area map derived for the entire territory of Portugal from eight Landsat TM and ETM+ images. Since the Landsat scenes were adjacent and the fire regime is the same in the territory of Portugal, consisting in isolated fires in a nonburned matrix, a single linear regression analysis was performed. Figure 9 shows the overall linear regression fitted with the data from the eight Landsat images covering Portugal.
a) b)
c) d)
Figure 8. Linear regression analysis between the burned area estimates derived from the Landsat ETM+ data and the VGT data for the validation sites of Southeastern Africa, corresponding to the Landsat scenes of: a) Okavango, Botswana; b) Pilanesberg, South Africa; c) Kruger, South Africa; d) Nampula, Mozambique.
Figure 9. Linear regression analysis between the burned area estimates derived from the Landsat data and the VGT data for Portugal, using eight Landsat scenes.
5.3 GBA 2000 Internet Map Server
Since the objective of GBA 2000 is to provide the research community working with emissions from biomass burning, a global burnt area map of known accuracy, an Internet Map Server (IMS) was developed by UNEP/DEWA/GRID-Geneve center (United Nations Environmental Program, Division of Early Warning and Assessement) and the JRC, in order to make available the
informa-tion produced [Grégoire et al., 2001]. The GBA 2000 products can be accessed via the IMS im-plemented at UNEP-Geneva: http://www.grid.unep.ch/activities/earlywarning/preview/ims/gba/ or via the GVM/JRC web site: http://www.gvm.sai.jrc.it/fire/gba2000_website/index.htm.
The VGT burned area maps and other cartographic information, such as land cover maps, coun-tries and protect areas, are available for the region of interest selected by the user. Statistical infor-mation, such as annual statistics of area burned per country, seasonality of burning, seasonality per vegetation type and burning in protect areas, is also available.
6 DISCUSSION AND CONCLUSIONS
Monthly burned area maps were produced for Southern Africa, for the northern section of South America and for the Iberian Peninsula. In the Southern Africa, as shown in Figure 5, fire incidence is higher in the northern part of the area, especially in Angola and the Democratic Republic of Congo. Fire incidence is lower in the southeastern section and very low in the semi-desert and de-sert areas of the southwest. In the northwest most burning took place during June through August, while in the eastern section burning was concentrated in July through September. July was the peak month of the year 2000 fire season. Figure 5 displays clear variations in the spatial pattern of burn-ing. In the northern part of the study region, especially in northeastern Angola and southern De-mocratic Republic of Congo, by the end of the fire season vast areas are continuously burnt as a re-sult of the coalescence of numerous separate burning events. In the drier South, fire scars more often occur as large patches, in a predominantly unburnt landscape matrix, a pattern that is evident in Namibia, Botswana, and along the border between South Africa and Mozambique. The spatio-temporal pattern of fire occurrence we observed corresponds very well to the findings of Dwyer et al. [2000], based on the analysis of one-year of active fires data from the AVHRR, and also to the results of Barbosa et al. [1999]. Is also similar with the pattern of the map, derived from VGT im-ages with classification trees, produced by Silva et al. [2002] for Southern Africa.
The burned area map derived with the classification trees for the study area of Brazil (Figure 6) shows that the fire incidence is higher in Brazil and Bolivia. The states of Brazil with higher fire activity are Mato Grosso, Pará, Tocantins, Maranhão, Piauí, Bahia, Goiás, Minas Gerais and Mato Grosso do Sul. The vegetation type affect by fire in Brazil is mainly the savanna type called Cer-rado. Most burning took place during June through August In Bolivia fire in concentrated in the regions of grasslands of Llanos de Mojos. In Bolivia most burning took place during July through September.
In the Iberian Peninsula the months with highest fire activity were August and September, as shown in Figure 7. The other months are not shown in Figure 7, due to the small number of fires detected. The area burned in Portugal in July, August and September account for almost 85% of the total burned area in the year 2000, as reported by Direcção-Geral das Florestas [2001]. The spatial pattern of the burned areas in the map derived from VGT images is very similar with the spatial pattern of the map produced for Portugal with a mosaic of eight Landsat images. In Portugal, fire incidence is higher in the central and the northern regions, in the districts of Vila Real, Viseu, Guarda, Coimbra, Castelo Branco and Santarém. In Spain fire incidence is higher in the provinces of Galicia and Castilla Y León. The distribution of the burned areas in Spain in the VGT map is in agreement with reports by from Ministerio de Medio Ambiente [2001].
The validation of the 1 km burned area maps produced with VGT images with the maps derived from 30 m resolution Landsat images, revealed high agreement between the two maps in all valida-tion sites, with the excepvalida-tion of the validavalida-tion site of Northern Mozambique. Concerning the vali-dation of the burned area map produced for Southern Africa (Figure 8), good correspondence was observed between the estimates of area burned derived from the Landsat data and the VGT data at Okavango (Botswana), Pilanesberg (South Africa) and Kruger (South Africa) validation sites, with R2values of 0.987, 0.867 and 0.881, respectively. VGT data overestimated the area burned at Pi-lanesberg and underestimated at Okavango and Kruger. In the Nampula validation site the agree-ment between Landsat and VGT estimates was poorer, as evidenced by the lower R2 value (0.400).
Eva and Lambin [1998] in a comparison of burns detected with ATSR imagery and two Landsat scenes over the Central African Republic used a map accuracy assessment procedure similar to ours. The R2 values they obtained range from 0.58 to 0.73, which is better than our R2 value for Nampula validation site, but lower than the values for the other three validation sites. The study area of Eva and Lambin [1998] was much smaller than our study area of Southern Africa.
The agreement between the estimates of area burned derived from the Landsat data and the VGT for Portugal (Figure 9) is good, given the small size of the burned areas in Portugal. The es-timates derived from VGT are unbiased since the slope of the regression is close to 1 and the inter-cept is close to 0.
The qualitative and quantitative assessment of the spatial and temporal accuracy of the burned area maps produced for the Southern Africa, Brazil and Iberian Peninsula is promising that these maps and others that will be produced in the framework of the GBA 2000 project, will be reliable and useful for several applications and research groups, such as the research community working with emissions from biomass burning.
ACKNOWLEDGMENTS
SPOT - VEGETATION images and Landsat images for Siberia were made available in the frame-work of the Global Burnt Area 2000 – GBA2000 project (http://www.gvm.sai.jrc.it/fire/gba2000_ website/index.htm) of the Joint Research Centre of the European Commission. Landsat images for Portugal were made available by Direcção-Geral das Florestas, Ministry of Agriculture, Portugal. Landsat images for Southeastern Africa were supplied under the framework of SAFARI 2000 pro-ject (http://safari.gecp.virginia.edu/index.asp).
JMNS was funded by the Foundation for Science and Technology, Ministry for Science and Technology, Portugal, through doctoral grant SFRH/BD/1026/2000.
The authors would like to thank Ana Sá, Bernardo Mota, Teresa Santos and Rita Magalhães, Department of Forestry, Instituto Superior de Agronomia, Lisboa, Portugal, and Dmitry Ershov, In-ternational Forest Institute, Russia, for the effort in deriving the burned area maps from the Landsat images.
REFERENCES
Bailey, R. G. (1998). Ecoregions. The Ecosystem Geography of Oceans and Continents. Springer, New York. Barbosa, P. M., D. Stroppiana, J.-M. Grégoire and J. M. C. Pereira (1999). An assessment of vegetation fire in Africa (1981-1991): burned areas, burned biomass, and atmospheric emissions, Global Biogeochemical
Cycles, 13(4), 933-950.
Boschetti, L., S. Flasse, S. Trigg, P. A. Brivio and M. Maggi (2001). A methodology for the validation of low resolution remotely sensed data products, paper presented at 4th ASITA Conference, October 9-12, Rimini,
Italy.
Breiman, L., J. H. Friedman, R. A. Olshen and C. J. Stone (1984). Classification and Regression Trees, Wadsworth & Brooks, California.
Cabral, A., M. J. P. Vasconcelos, J. M. C. Pereira and E. Bartholomé (2002). Multitemporal compositing ap-proaches for SPOT4-VEGETATION data, Submitted to the International Journal of Remote Sensing. Direcção-Geral das Florestas (2001). Incêndios Florestais. Portugal – 2000. Direcção-Geral das Florestas,
Ministério da Agricultura, do Desenvolvimento Rural e das Pescas, Lisbon, Portugal.
Dwyer, E., S. Pinnock, J.-M. Grégoire and J. M. C. Pereira (2000). Global spatial and temporal distribution of vegetation fire as determined from satellite observations, International Journal of Remote Sensing, 21(6), 1289-1302.
Eva, H. and E. F. Lambin (1998). Remote sensing of biomass burning in tropical regions: sampling issues and multisensor approach, Remote Sensing of Environment, 64, 292-315.
Grégoire, J-M., K. Tansey, I. Marengo, D. Stroppiana and S. Fritz (2001). The Global Burnt Area 2000
Ini-tiative: GBA-2000. Mapping the areas burnt globally during the year 2000. Project status. Joint Research
Centre, European Commission, Technical Note No. I.01.117.
Justice, C. O. and S. Korontzi (2001). A review of the status of satellite fire monitoring and the requirements for global environmental change research. In Global and Regional Vegetation Fire Monitoring from
Space: Planning a Coordinated International Effort. F. J. Ahern, J. G. Goldammer and C. O. Justice
(eds.), SPB Academic Publishing bv, The Hague, The Netherlands.
Levine, J. S. (1996). FireSat and the global monitoring of biomass burning. In Biomass Burning and Global
Change. Volume 1. J. S. Levine (ed.), The MIT Press, Cambridge, Massachusetts: pp. 107-132.
Mardia, K. V., J. T. Kent and J. M. Bibby (1979). Multivariate Analysis. Academic Press.
Ministerio de Medio Ambiente (2001). Los Incendios Forestales en España Durante el Año 2000. Secretaria General de Medio Ambiente, Ministerio de Medio Ambiente, Madrid, Spain.
Negreiros, G. H., D. Stanberg, E. Alvarado, T. Hinckley, D. C. Nepstad and M. Pereira (1996). Fire in the transition between the Amazon forest and Cerrado ecosystems, 13th Conference on the Fire and Forest
Meteorology, October 27-31, Lorne, Australia.
Rahman, H. and G. Dedieu (1994). SMAC: a simplified method for the atmospheric correction of satellite measurements in the solar spectrum, International Journal of Remote Sensing, 15(1), 123-143.
Silva, J. M. N., J. M. C. Pereira, A. I. Cabral, A. C. L. Sá, M. J. P. Vasconcelos, B. Mota and J-M Grégoire (2002). The area burned in southern Africa during the 2000 dry season, Submitted to the Journal of
Geo-physical Research.
SPOT-VEGETATION Technical Information, available at http://vegetation.cnes.fr.
Stroppiana, D., S. Pinnock and J. M. C. Pereira (2002). Radiometric analysis of SPOT-VEGETATION im-ages for burnt area detection in Northern Australia, Remote Sensing of Environment, accepted.