REM WORKING PAPER SERIES
Reforms and External Balances in Southern Europe and Ireland Luís A. V. Catão
REM Working Paper 027-2018 February 2018
REM – Research in Economics and Mathematics
Rua Miguel Lúpi 20, 1249-078 Lisboa,
Portugal
ISSN 2184-108X
Any opinions expressed are those of the authors and not those of REM. Short, up to two paragraphs can be cited provided that full credit is given to the authors.
1 Reforms and External Balances in Southern Europe and Ireland Luís A. V. Catão1 Department of Economics UECE & Research in Economics and Mathematics (REM) Lisbon School of Economics and Management (ISEG) University of Lisbon Abstract
High external deficits in Greece, Ireland, Portugal and Spain are widely regarded as culprits of the post-2008 financial crises in the eurozone. This paper examines the main drivers of those imbalances and discusses how the mix of macroeconomic adjustment and structural reforms implemented in the last few years has affected the evolution of those countries’ external positions. The analysis combines modern theories of the current account and of the real exchange rate with panel data regressions to shed light on the standing of those economies’ external “competitiveness” broadly defined.
1 Paper prepared for the volume entitled Economic Crisis and Structural Reform in Southern Europe, edited by Paolo Manasse and Dimitris Katsikas, and published by Routledge. Much of the work was done while the author was at the Research Department of the International Monetary Fund (IMF). All the opinions expressed here, however, are those of the author and do not necessarily represent those of the IMF. I thank, without implicating, Antonio Bassanetti, John Bluedorn, Oya Celasun, Enrique Flores, Alessandro Giustiniani, Daniela Enriquez, Alvar Kangur, Dimitri Katsikas, Subir Lall, Inês Lopes, Paolo Manasse, Michalis Psalidopoulos, Natalia Novikova, Jorge Salas, Johannes Wiegang, and Aleksandra Zdzienicka for detailed comments on earlier drafts.
2
1.Introduction
A key macroeconomic development leading to the financial crises of 2009-12 in Europe was the emergence of very large deficits in the external current accounts (CAs) of Greece, Ireland, Portugal, and Spain. In particular, the three southern countries posted CA deficits that exceeded 10% of GDP in the run-up to the crises. Not only were such deficits rather sizeable relative to those countries’ own historical record since World War II, but also large relative to those typically observed in external financial crises in emerging markets – where “sudden stops” in capital inflows hit when the CA deficit rises above 4 to 5% of GDP (Catão and Milesi-Ferretti, 2014).
To be sure, crisis-free countries with CA deficits of the order of 10% or so of GDP are not unheard of historically. Some of today’s advanced
economies such as Australia, Canada and some of the Scandinavian
economies, experienced deficits approaching such magnitudes between the late 19th century and early 20th century, as swift growth of labor and capital inputs together with rising total factor productivity (TFP henceforth) and persistent improvement in the price of their exports relative to the domestic cost of producing them, assured investors that those deficits would be
eventually reversed and the large accumulation of external liabilities be fully repaid.
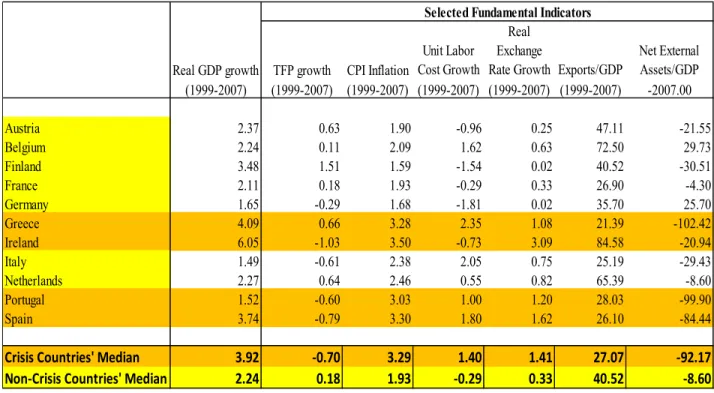
Those conditions were not apparent in some of Eurozone by the eve of the 2009-12 financial crises. Table 1 shows that despite higher real GDP growth than the median of other non-crisis EU countries (3.9% vs. 2.2%) since the
3
onset of the euro, key macroeconomic fundamentals were generally weaker – and some of them significantly so -- in the four crisis countries. In
particular, TFP growth was negative in three of the four countries; unit labor costs (measured as the ratio of the average wage to labor productivity) were also rising relative to the EU average in all four countries, implying that domestic production was getting costlier; and so was consumer goods’ price inflation, implying an appreciation of the real exchange rate (the price of domestic vs. foreign goods expressed in the common currency) again pointing to a loss of external competitiveness. Finally and no less
importantly, net foreign assets (NFA) – which is equal to the accumulation of current account balances plus valuation effects – were highly negative in Greece, Portugal and Spain at close to 100% of GDP. Furthermore, because openness to international trade (as measured by the ratio of exports of goods and services to GDP) was lower than the EU average – with the exception of Ireland, the ratio of net foreign assets to exports was even higher. This is an important indicator of the sustainability of external balances because, in the absence of valuation effects, the present value of net external liabilities has to be ultimately paid with net exports.
4
Table 1. Real GDP growth and Relative Country Fundamentals in the EU, 1999-2007
Selected Fundamental Indicators
Real GDP growth TFP growth CPI Inflation
Unit Labor Cost Growth
Real Exchange
Rate Growth Exports/GDP
Net External Assets/GDP (1999-2007) (1999-2007) (1999-2007) (1999-2007) (1999-2007) (1999-2007) -2007.00 Austria 2.37 0.63 1.90 -0.96 0.25 47.11 -21.55 Belgium 2.24 0.11 2.09 1.62 0.63 72.50 29.73 Finland 3.48 1.51 1.59 -1.54 0.02 40.52 -30.51 France 2.11 0.18 1.93 -0.29 0.33 26.90 -4.30 Germany 1.65 -0.29 1.68 -1.81 0.02 35.70 25.70 Greece 4.09 0.66 3.28 2.35 1.08 21.39 -102.42 Ireland 6.05 -1.03 3.50 -0.73 3.09 84.58 -20.94 Italy 1.49 -0.61 2.38 2.05 0.75 25.19 -29.43 Netherlands 2.27 0.64 2.46 0.55 0.82 65.39 -8.60 Portugal 1.52 -0.60 3.03 1.00 1.20 28.03 -99.90 Spain 3.74 -0.79 3.30 1.80 1.62 26.10 -84.44 Crisis Countries' Median 3.92 -0.70 3.29 1.40 1.41 27.07 -92.17 Non-Crisis Countries' Median 2.24 0.18 1.93 -0.29 0.33 40.52 -8.60 Sources: International Financial Statistics and IMF/WEO databases, and Penn World Table 9.0.
The upshot is that weaker macroeconomic fundamentals made those four countries externally more “fragile” relative to other Eurozone peers. In those circumstances, as observed many times in macroeconomic crises in
emerging markets in the past, a large external shock – such as that triggered by the financial panic in the US in the summer of 2008, can rapidly unravel high external deficits.2 Figure 1 shows that the turnaround of current
account balances was massive in all four countries from 2008 onwards.3
2 This unraveling may not be immediate, however, and one might arguably expect it to be lengthier in advanced countries than in emerging markets. One reason is that the deeper international financial integration of advanced countries grants them access to a wider range of financing instruments. Another reason is greater policy credibility. Knowing that policy authorities can credibly commit to do “whatever it takes” to save a currency or a monetary regime, helps rule out extreme risk scenarios and thus aid the effectiveness of policy interventions. These factors help explain some of the lag between the financial crisis in the US and those in the Eurozone. 3 In many external crises of the past, the turnaround in the trade balance (which is typically the main component of the current account, equaling the latter minus net income from abroad and net current transfers) has been even larger of that of the current account. However, a current account reversal in
5
Figure 1. Current Account Balances in the Eurozone, 1999-2015 (in percent of GDP)
Data source: IMF World Economic Outlook database, April 2016.
The fact that this was so notwithstanding the large injection of external multilateral financing by the European Central Bank, the International Monetary Fund (through adjustment programs in Greece, Ireland, and Portugal) and (from 2012) by the European Financial Stability Facility (EFSF) and European Stability Mechanism (ESM), gives an idea of the exceptional nature of the external adjustment that southern Europe and Ireland underwent between 2009 and 2015. Figure 1 also indicates that
major macroeconomic crises can be larger than that of the trade balance. This happens, for instance, if residents cut down their payments to foreigners (as in defaults or debt re-scheduling arrangements that reduce current interest payments, or if domestic investors buy back national debt held by foreigners reducing the overall stock of foreign debt). In the four countries analyzed in this chapter, only Greece renegotiated its debt. Yet, a slightly larger turnaround of the current account relative to the trade balance was also observed in Portugal and Spain between 2007 and 2015. This chapter focuses on the current account since it is a broader indicator of external balances and a direct measure of the difference between two key macroeconomic variables (domestic saving and domestic investment). Yet, much of the analysis carries over to the trade balance. Sharp turnarounds in trade or current account balances, triggered by the pull-out of foreign investors from a country’s assets are usually dubbed in the literature on international macroeconomics as “sudden stops”. -15 -13 -11 -9 -7 -5 -3 -1 1 3 5 Greece Ireland Italy Portugal Spain EU "Core" (Median)
6
swings in current account surpluses in the north of the Eurozone (here
defined as Austria, Belgium, Finland, France, Germany and the Netherlands) have been the flip side of the external adjustment in the South.
Against this background, this chapter seeks to answer three related questions:
• To what extent have the current account adjustments since 2008 in Greece, Ireland, Portugal, and Spain responded to
macroeconomic adjustments?
• To which extent structural reforms helped current account adjustment and in making these economies more “competitive” going forward?
• In light of recent developments in relative competitiveness and reforms, what could one expect regarding the path of their external balances going forward?
2. Current Account Determinants in the Eurozone
The view that the size of the current account should matter for
macroeconomic performance is controversial among macroeconomists (see Obstfeld 2012, for a broad discussion and references). After all, the current account is the net balance between gross financial flows in and out of a country, and international financial integration implies that both inflows and outflows can (and arguably should) be very large as a share of GDP. Thus, it is natural that non-trivial gaps between such inflows and outflows may
7
sometime arise in the course of the economic cycle; hence the CA may experience temporary large deficits. Such imbalances should be even more expected and possibly longer lasting in a currency union where non-trivial differences in economic structures across member countries remain and exchange rate flexibility is no longer present to speed up the adjustment in the relative price of domestic- vs. foreign-produced goods to
macroeconomic shocks.
Yet, even in a currency union where exchange rate risk is removed and common central bank policies may greatly help reduce country-specific risk, large CA deficits lasting several years may also be problematic. For
instance, such deficits may call into question a member country’s incentive to restore fiscal discipline and repay the accumulated net foreign liabilities when they grow large, thereby raising investors’ concerns about what economists call the “inter-temporal solvency constraint”. Since outright default and/or “hair-cuts” of the contractual value of those liabilities is one way to satisfy that constraint, investors may seek to limit the country’s indebtedness relative to its income (i.e. the ratio of external liabilities to GDP). A market mechanism through which this is accomplished is the rise in a positive interest “premium” charged by investors to lend to indebted governments.4 Once this financing constraint begins to hit, external borrowing can become very expensive to the point that net foreign
4 In the limit, there is a point where no additional lending is forthcoming at any interest rate, so the borrowing limit becomes strict rationing as in many models of sovereign debt (see Eaton and Fernandez 1995, for a classical survey). The reason for such a “rationing” is that, as interest rates keep rising, the attendant rise in repayment costs increases the borrower’s incentive to default, up to the point where no further rise in interest rates compensates investors for the extra risk of additional lending. At this point, investors will stop lending altogether at any level of interest rate.
8
borrowing cannot remain large, i.e., the country’s current account balance has to adjust to that reality. A well-known gauge of this situation is the spread in the interest rate of government bonds denominated in the same currency – in this case the euro – between countries. Such an interest spread began to widen rapidly for South European government bonds starting in the summer of 2008. While the spike in government bond spread was far from homogeneous across countries (in Spain for instance it started only in 2011-12), they do suggest that debt sustainability was becoming a growing cause of investors’ concern under a less favorable global economic outlook. Since a non-trivial portion of those bonds were sold to foreigners, they were a clear counterpart of CA flows and thus a manifestation of concerns about the sustainability of these countries’ own CA deficits which persisted and grew even larger for several years (as illustrated in Figure 1). As often witnessed in history, current account and sovereign debt crises go hand in hand.
Figure 2. Eurozone: 10-year Interest Yields on Government Bonds Source: IMF’s International Financial Statistics 0 5 10 15 20 25 30 1997M 2 1997M 9 1998M 4 19 98 M1 1 1999M 6 2000M 1 2000M 8 2001M 3 20 01 M1 0 2002M 5 20 02 M1 2 2003M 7 2004M 2 2004M 9 2005M 4 20 05 M1 1 2006M 6 2007M 1 2007M 8 2008M 3 20 08 M1 0 2009M 5 20 09 M1 2 2010M 7 2011M 2 2011M 9 2012M 4 20 12 M1 1 2013M 6 2014M 1 2014M 8 2015M 3 20 15 M1 0 in % Belgium France Germany Greece Ireland Italy Portugal Spain Netherlands
9
The key question is then what makes a CA deficit “sustainable” in the sense that such a constraint on further external indebtedness does not emerge. Learning about which variables make CA position “sustainable” is clearly important for policy makers to design a system of measures – of both a conjectural and a structural nature - to mitigate the risk of abrupt reversals in the flow of external financing which can take a long-lasting toll on output and employment.
Theoretical and empirical research over the past two decades has highlighted a number of critical variables in this connection. These are listed in Table 2.5 Since basic national income accounting says that the CA is what a country’s residents save minus what they invest, it is useful to break down CA
determinants between drivers of domestic saving and investment, in addition to external influences that are not directly under the country’s control (what is called in the table “External Financing Shifters”), but which may
nevertheless affect both domestic saving and investment, and hence the CA.
5 See Obstfeld and Rogoff (1996) for the foundations of the inter-temporal CA model and Chinn and Prasad (2003), Lee et al. (2008), Ca’Zorzie et al. (2012), Philips et al. (2013), Catão and Milesi-Ferretti (2014) for empirical applications and extensions of that work-horse model.
10
Table 2. Theoretical Determinants of Current Account Balances
_____________________________________________________________
Domestic Saving shifters
Domestic Investment Shifters
External Financing Shifters
Initial NFA
TFP growth
Global Risk Aversion (VIX)
Per capita income
Output Gap
Cross-Border Capital Controls
Age dependency ratio
Domestic credit growth
Population growth
Domestic credit growth
Fiscal balance
Commodity TOT growth
_____________________________________________________________Table 3 shows how these variables affect CAs across the Eurozone. It does that by regressing the ratio of the overall current account to GDP (CA/GDP) of each of the original twelve members (Austria, Belgium, Finland, France, Germany, Greece, Ireland, Italy, Luxembourg, the Netherlands, Portugal and Spain) on the variables above starting in the year following the introduction of the Exchange Rate mechanism (1980) through 2015.6 As standard in the
6 Other CA models featuring in the recent literature, which include some vintages of the IMF external balance assessment (EBA) methodology, contain a number of extra variables, such as the oil trade balance, GDP growth forecasting, public health expenditure to GDP, and institutional quality indicators. None of them, however, proved to be statistically significant in the intra-Eurozone regression and so do not feature in the present discussion. Such a lack of significance is not surprising since most of the explanatory power of those variables comes from cross-sectional differences in a broader panel of countries, which include emerging markets and large commodity exporters. Such cross-sectional differences are relatively unimportant in the Eurozone. One advantage of restricting the country sample to the Eurozone is to keep the specification reasonably parsimonious while allowing for the possibility of Eurozone-specific coefficients. Since the bulk of the CA imbalances at stake are intra-EU imbalances, such a cross-sectional truncation
11
analysis of cross-country CA regressions, fixed effects are omitted and all right-hand side variables are measured relative to the foreign country counterparts, in this case the EU12 (GDP weighted) average.7 To
corroborate the robustness of the estimates to the potential reversed causality from the CA to variables like the output gap, the fiscal balance, and credit growth, an instrumental variable (IV) estimator is also reported, with very similar results.8
Table 3 shows that a relatively parsimonious model can explain about 60 percent of intra Eurozone imbalances. This is respectful explanatory power given how difficult it is to explain well CA variations over time and across countries. Scrolling down the list of explanatory variables from the top, the positive effect on NFA reflects the counter-point of two effects at play. On the one hand, a very negative net foreign asset position (like those in
Southern Europe) creates a negative wealth effect and calls for a positive trade balance so that net liabilities are eventually paid off and the inter-temporal budget constraint is satisfied. On the other hand, more negative
sample is appropriate for the task at hand. Also, limiting the estimation to the second half of the sample, i.e., from 1996 to 2015, does not change the thrust of the results, nor does the introduction of fixed country effects. 7 See Phillips et al. (2013) for a discussion of the underlying model and various estimation issues. In particular, not including country fixed effects ensure that the global adding up constraint, i.e., the worldwide sum of CAs is zero, is met (short of the usual global measurement discrepancies). In the case of the Eurozone, because its CA imbalance with the rest of the world has been small, imposing such a quasi-zero adding-up constraint is also broadly warranted. Unlike in Phillips et al. (2013) growth expectations was not a significant variable in the regression in the presence of the output gap indicator owing to strong collinearity. 8 As often in the literature, the selection of instruments relies on one and two period lags of real GDP growth, and one-period lags of the primary fiscal balance and credit growth. In an alternative specification, lagged credit growth was also replaced with the lag ratio of bank credit to bank capital with very similar results and a slightly higher R-squared (0.62). A discussion of the relationship between credit growth and that bank leverage indicator is provided in section 3.
12
NFA implies greater flow of interest payments abroad which depresses the CA. On balance, the latter effect typically dominates in broad cross-country regressions spanning advanced and emerging market economies (see Phillips et al. 2013). Table 3 shows that this is also the case for the Eurozone. The effect is economically large: a country that has a net foreign liability of 60-80 percentage points above the EU12 average (which is roughly what Greece, Portugal and Spain had before the 2008-12 financial crisis), should be expected to run a CA deficit of 1.5 to 2% of GDP, all else constant. As the general empirical literature on current account determinants has also found (see Phillips et al., 2013), differences in per capita income are also significant determinants of intra Eurozone CA imbalances. The sign of the estimates coefficient accord with a central prediction of the neo-classical model that richer countries (which are typically more capital abundant) should export capital and hence run current account surpluses on average. The attendant point estimate in Table 3 indicates that every US$ 5,000 increase in per-capita income relative to the EU12 weighted average improves the CA by 1 percentage point of GDP. So, the fact that Southern Eurozone members are a few thousand euros poorer (in per capita income terms) than Northern Eurozone members, together with having a 60-80% more negative NFA/GDP ratio, already puts their current accounts into substantively negative territory, of the order of 3 to 4 GDP percentage points, holding all other (particularly cyclical) considerations constant. The following triplet of demographic variables (population growth, current dependency ratios, and the speed of its future evolution) have the expected signs and also hold significant explanatory power together, though the net
13
effect is smaller than those of the above two variables and more disparate across countries.9 This is both because intra-Eurozone differences in those variables are smaller and also because some of the crisis-hit countries
(notably Ireland) have higher population growth and dependency ratios well below the EU12 average, whereas some of them (like Greece) have
dependency ratios which are non-trivially above the EU12 average. In particular, the much lower dependency ratio of Ireland (about 11% below EU12 average) coupled with an estimated coefficient of about -0.25 does help account by nearly half (2.5 percentage points) of its CA/GDP gap
vis-à-vis the Southern peers on the eve of Eurozone financial crisis.
9 The sign of old dependency ratio (the ratio of population outside the working age to total population) is negative, because a lower share of individuals in the employment age lowers savings and hence reduces the CA. Conversely, a higher rate of population ageing means that the share of working-age population will need to save more today to finance the retirement of a higher number of individuals in the future; hence higher values for the “ageing speed” have a positive effect on the CA. While governments can have only a modest control over deeper demographic trends that shape the evolution of those variables, other policies (including reforms in pension systems and the overall fiscal stance) can help offset the effects of demographic trends on a country’s external sustainability.
14
Table 3. Determinants of CA Balances in EU 12 countries Pooled OLS IV Method Net Foreign Assets/GDP, lag 0.0255* 0.0263*
(0.0138) (0.0136) Per Capita GDP, lag 2.61e-06** 2.55e-06**
(9.60e-07) (9.26e-07) Population Growth -1.714*** -1.690*** (0.453) (0.457) Old Dependency Ratio -0.247* -0.254* (0.121) (0.120)
Aging Speed 0.144** 0.143**
(0.0536) (0.0541) Capital Controls -0.0455* -0.0476* (0.0241) (0.0232) Primary Fiscal Balance 0.270** 0.278** (0.0888) (0.0915) Output Gap -0.534*** -0.545***
(0.145) (0.144) VIX * EU core -0.00535 -0.00519
(0.00356) (0.00342) Terms of Trade Growth -0.0427 -0.0444
(0.0656) (0.0694) TFP Growth 0.274** 0.259** (0.0977) (0.0999) Change in Credit/GDP -0.145** -0.146** (0.0590) (0.0588) Constant -0.00171 -0.00175 (0.00349) (0.00341) Observations 437 432 R-squared 0.599 0.601
Robust standard errors in parentheses *** p<0.01, ** p<0.05, * p<0.1 Source: Author’s calculations
15
The above results also reject changes in the countries’ Terms of Trade growth and in global risk aversion – as measured by an index of implied stock market volatility (the so-called VIX index) as drivers of
intra-European imbalances. This lack of significance is not surprising: terms of trade changes tend to be correlated with the output variables included in the regression and risk aversion (as captured by the VIX) only matters if it affects countries differently (so that its effect on exports and imports are different).10 In the case of capital controls (measured as in Phillips et al., 2013), the coefficient is statistically significant only at a 10% level and is economically small. This is not surprising since the bulk of capital account restrictions in Europe have been lifted in the 1990s and, in the sample of countries considered, were re-introduced only in Greece in 2015.
Yet, the regression results point to three remaining variables as key to explain both how pre-crisis “excess” imbalances arose and how the post-2008 reforms may impact future external balances in the four crisis-hit countries.11
The first is the general government balance - here entered net of interest expenses to capture the component of fiscal policy that is more closely under control of national governments and which is more exogenous to the current account. As mentioned above and widely documented elsewhere, fiscal imbalances (on both the positive and negative side) have been an important driver of external imbalances in the Eurozone. The highly significant – both
10 The level of the terms of trade does not show up as significant either.
11 Also insignificant is the effect of stock price growth and 5-year ahead expected growth – the latter variable found to be significant in prior cross-country work (Phillips et al. 2013). Both were dropped from the regressions reported in Table 3.
16
statistically and economically – coefficient of 0.27 on the primary fiscal balance shown in Table 3 suggests that saving-investment decisions are not neutral to fiscal policy, implying that the so-called “Ricardian equivalence” does not hold: the attendant point estimate says a 10 percentage point
improvement in the general government primary balance (a magnitude which is not too much off the mark for crisis-hit countries between 2009 and 2015) translates into a nearly 3 percentage point improvement in the
CA/GDP ratio. So, these regression results clearly indicate that reform efforts which impart a significant and sustained improvement in fiscal balances should have far-reaching effects on Southern Europe’s external positions.
The second key variable is the gap between real GDP and its “potential” or trend level (measured as in Phillips et al., 2013 by the HP filter), i.e., the so-called “output gap”. The significant negative sign of that variable indicates that when demand outpaces domestic supply (i.e., the economy is
“overheated” in popular parlance), such an excess is met by a rise in imports relative to exports, thus implying that the CA balance declines.
The high-demand effect associated with a positive output gap may be counter-balanced by what happens to total factor productivity (TFP). As shown in Table 3, higher TFP growth relative to EU partners tends to
improve the CA. This positive effect is not obvious in theory because higher TFP can boost investment (insofar as it raises firms’ profits) and lower savings (insofar as households anticipate higher income growth resulting from higher TFP, and increase their consumption relative to present income). Yet, a positive effect of higher TFP on the CA can also be
17
rationalized. For one thing, a higher TFP (implying a more productive use of domestic production factors) also reduces inefficient capital, thus lowering actual investment for a given unit of output. In addition, to the extent that a higher TFP signals greater investment opportunities in the future that firms may choose to finance out of current earnings, firms may choose to
distribute fewer dividends, thereby raising corporate savings. More
generally, a higher TFP implies that the country can produce at lower cost and hence at lower prices than abroad. Hence, the trade balance and the CA will tend to improve with TFP growth. This interpretation is supported by the fact that TOT growth is not significant in the regression as some of its effects are already captured by TFP growth. It follows from this that structural reforms that boost TFP should also help improve the CA. The links between structural reforms and TFP will be discussed below. Last but not least, faster growth of domestic bank credit relative to GDP shows up as major negative influence on the CA: a 10 percent rise in the ratio of credit to GDP (relative to Eurozone wide averages) leads to a CA deterioration of about 1.5% of GDP. Since the regressions in Table 3 already control for the output gap (and through it for the effects of lower real interest rates in the home country), such a strong effect of credit growth on the CA accords well with both modern theories of financial amplification, according to which credit expansion fuels aggregate demand (and often by more than it effects aggregate supply). Such a strong effect of changes in credit/GDP ratios on the CA also accords well with widespread commentary on
“excessive” private sector leveraging and the importance of the bank credit channel in driving capital flows across the Eurozone (see, e.g. Lane and McQuade 2013). As will be discussed below, since credit growth in excess
18
of GDP is highly correlated with increases in bank sector leverage, the
econometric evidence of Table 3 does provide a case for an important role of regulatory frameworks in affecting intra-EU imbalances.
Overall, what does this econometric model tell us about seemingly “excessive” external imbalances? Figure 3 plots the gaps between actual CA/GDP ratios and those predicted (in-sample) by the model. Two “model-fit” lines are plotted: one that does not correct for the size of the cyclical expansions/contractions, and the other that does. Neither should be seen as
Figure 3. CA/GDP in Crisis-Hit Countries: Actual and Model Fit Greece Sources: IMF World Economic Outlook database, April 2016 and author’s calculations. -16% -14% -12% -10% -8% -6% -4% -2% 0% 2% Actual Model Fit Without Cyclical Adjustment Model Fit with Cyclical Adjustment
19 Ireland Sources: IMF World Economic Outlook database, April 2016 and author’s calculations. Portugal Sources: IMF World Economic Outlook database, April 2016 and author’s calculation -15% -10% -5% 0% 5% 10% Actual Model Fit Without Cyclical Adjustment Model Fit with Cyclical Adjustment -16% -14% -12% -10% -8% -6% -4% -2% 0% 2% Actual Model Fit Without Cyclical Adjustment Model Fit with Cyclical Adjustment
20
Spain
Sources: IMF World Economic Outlook database, April 2016 and author’s calculation
“desirable” CA/GDP levels, but rather those that are broadly consistent with typical historical responses of the CA to its macroeconomic determinants listed in Table 2. Moreover, because shifts in private sector expectations (in the direction of either excessive “pessimism” or over-optimism over the repayment capacity of borrowers) are hard to measure and are deemed to have been important particularly in Ireland and Spain, this is another source of residual discrepancy between model prediction and actual CA values.12 12 Another potential sources of discrepancy are heterogeneous output composition (for instance, the higher weight of the ICT service in Ireland) and tax policies which in turn can make the “elasticity” of the current account to output and relative prices to differ. Accurately modeling and estimating those effects is, however, hard and remain an open field for future research on current account modeling. -12% -10% -8% -6% -4% -2% 0% 2% 4% Actual Model Fit Without Cyclical Adjustment Model Fit with Cyclical Adjustment
21 These charts highlight four developments. One is that prior to the crises, all four countries had current accounts more negative than what the model would predict. In fact, even adjusting for the large cyclical booms (which only in Portugal was muted), the actual CA/GDP (plotted in black line) was below the model fit adjusted for the cycle (dotted blue line). In other words, on the basis of average model elasticities and even correcting for state of the business cycle (as measured by the output gap), the CA deficit appears to have been “excessive” by the eve of the crises. Second, these charts also indicate that imbalances grew especially large in Greece and Portugal in the 2000s. Third, the off-shooting in the direction of larger deficits during crisis turned into an overshooting in the surplus direction since 2009 in Greece, Portugal and Spain -- but not in Ireland. That is, even controlling for the harshness of the post-2008 output contraction and fiscal adjustment (as done in the regressions of Table 3 via the output gap and the primary fiscal balance) the CAs in the Greece and Portugal, (and to a much lesser extent also in Spain) have improved by more than anticipated on the basis of the model and much more so than in past recessions in Greece and Portugal – including the harsh downturns of the early 1980s and early 1990s. This suggests that developments specific of those two countries (and to a lesser extent to Spain) played a role. The next section elaborates on this point and discusses what effects structural reforms may have had in this connection
22 3. Macroeconomic Adjustment and External Pay-offs of Reforms In terms of their effects on external balances, the structural reforms that Southern Europe and Ireland embarked upon and which are documented in this book can be divided into four broad categories: i) Product market deregulation; ii) Reforms to increase labor market flexibility; iii) Fiscal sector streamlining aimed at promoting a path of fiscal spending consistent with economy’s long-term growth potential;13 iv) Tighter financial sector regulation and bank capitalization. Regarding (i) and (ii), their effects on the current account are more easily seen by focusing on developments in the consumer price index (CPI) - based real exchange rate (the ratio of the domestic to the trade-weighted average of foreign CPIs expressed in the same currency) and unit labor costs (the wage cost of producing one unit of a good in the country vs. abroad, i.e. the wage adjusted for differences in labor productivity). 14 Specifically, one should expect product market deregulation to improve the allocation of resources across sectors, 13 Here, as elsewhere in this volume, short- to medium-term fiscal contraction dictated by an adjustment to meager external financing is not considered to be a reform. Yet, any potential effect of structural reforms on the long-term path of public expenditure is relevant for the CA going forward, insofar as it lowers the cyclically adjusted fiscal balance on a permanent basis, facilitating CA sustainability. 14 Indeed, in the inter-temporal canonical model of the current account, looking at the quantity flows is theoretically isomorphic to looking at the relevant relative price – the real exchange rate (see Philips et al. 2013; and Catão and Milesi-Ferretti 2014, appendix 1).
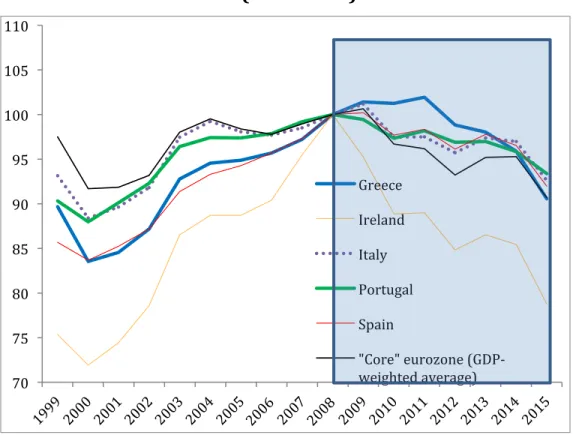
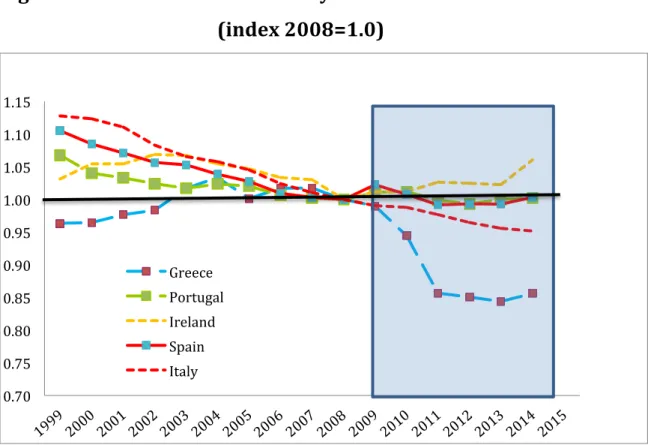
23 reduce rents, and raise TFP. As discussed in the previous sections, higher TFP tends to depreciate the real exchange rate and hence improve the CA. Put it differently, to the extent that structural reforms reduce the degrees of product and labor market “frictions” that get in the way of the efficient allocation of economic resources in any given economy, they should be expected to allow such economies to deliver quality-equivalent output at lower prices in world markets – in short, to be more “competitive”, thereby strengthening their current accounts. Taking the so-called Eurozone “core” (Austria, Belgium, Finland, France, Germany, and the Netherlands) as benchmark, Figure 4 plots the respective ratio of consumer price indices (CPIs). The figure shows that all four crisis countries had CPI inflation running lower than in the core Eurozone since 2009, implying that the average consumer basket got cheaper in the reform countries. Such a deflation partly reflects the depth of the recession, i.e., the widening output gap pushing down the price of non-tradable consumer goods. An indication of this demand-based effect is that, the reductions in relative producer price index (PPI) have been more modest, with the exception of Ireland, which experienced a 9% deflation relative to the Eurozone core between 2009 and 2014. But the fact that PPI inflation has also been held back in other reform countries too, suggests that some supply-factor effects may be at play, beyond the slack in the demand for domestic non-tradable goods.
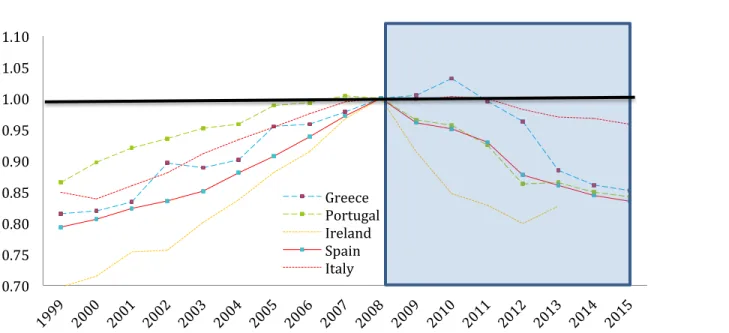
24 Figure 4. Consumer Price Index Relative to Eurozone “Core” (2008=1.00) Data Source: IMF, International Financial Statistics Because Eurozone countries differ considerably in terms of their external exposure to non-Eurozone countries, it is important to consider a real exchange rate index that reflects this effective exposure by individual countries. Figure 5 plots the IMF’s CPI based index of the real effective exchange rate (REER) which weighs relative price indices (denominated in the same currency) by the share of trade with distinct partners. When this is done, it is clear that the crisis-hit countries benefitted from the weakness of the euro through a real depreciation relative to non-euro trading partners, particularly from 2014, implying that gains in external competitiveness have been a lot more sizeable 0.70 0.75 0.80 0.85 0.90 0.95 1.00 1.05 1.10 Greece Portugal Ireland Spain Italy
25 than implied solely by intra Eurozone relative prices. Yet, those gains were even higher for the core Eurozone. Figure 5. Real Effective Exchange Rates Based on Consumer Prices (2008=100) Data Source: IMF, International Financial Statistics Such indices based on prices to the final consumer can however underestimate – or only reflect with a long lag - the effects of reforms on production costs, notably those of labor reforms, on external balances.15 This is not only because changes in taxation – such as higher VAT rates – 15 In general, the literature finds that there is no single universally superior price deflator to gauge changes in export performance or external “competitiveness” broadly speaking (see Chinn, 2006; and Giordano and Zollino, 2016). Hence it is standard practice to look at alternative price indicator, as is the analysis that follows. 70 75 80 85 90 95 100 105 110 Greece Ireland Italy Portugal Spain "Core" eurozone (GDP-weighted average)
26 affect consumer prices, but also because reforms in the retail/distribution sector have not been as far-reaching as labor reforms. In addition, as shown in Cacciatore et al. (2016), the effects of some labor market reforms on costs are typically more immediate than reforms in product markets, insofar as the latter works mainly through firm entry/exit, which is typically slower. That said, even labor market reforms themselves may take some time to have a fuller impact on final product prices and hence on the trade balance. This may not only be due to the slower erosion of monopolistic competition in some sectors (with labor costs reductions being compensated by a higher mark-up), but also to other offsetting (conjectural) factors discussed elsewhere in this volume (financial sector disruptions being one). Because these factors are hard to quantify, they are bound to show up in the regression residual - which during the adjustment period are mostly negative, consistent with this conjecture. A closer cost-based gauge of the effects of such reforms is the evolution of unit labor costs. Comparing the post-2008 path of unit labor costs in Figure 6 with that of CPI in Figure 4, it is clear that producers’ cost fell by far more than is apparent from trends in consumer prices between the crisis-hit countries and the so-called “core” countries in the Eurozone.16 Once again the fall was steepest for Ireland – the country which, as we have seen, experienced the largest turnaround in the current account. A comparison with Italy, where the size of imbalances to be corrected were much smaller and where some reforms were 16 One caveat about the index is that it covers the manufacturing sector only.
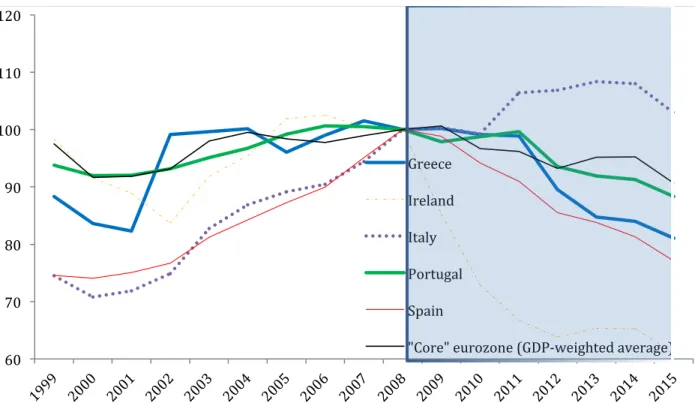
27 introduced but only more recently (implying that the effects of which cannot be yet been seen in the data), is also suggestive of how structural reforms can help lower production costs and fuel a large turnaround in the current account. Broadening the coverage of the index to reflect changes in unit labor costs viz a broad set of trading partners – as can be seen from the so-called ULC-based real exchange rate index plotted in Figure 7 – reinforces the point. Figure 6. Unit Labor Cost Relative to Eurozone “Core” (Index 2008=1.00) Data Source: IMF, World Economic Outlook Database, April 2016 0.70 0.75 0.80 0.85 0.90 0.95 1.00 1.05 1.10 Greece Portugal Ireland Spain Italy
28 Figure 7. Real Effective Exchange Rates Based on Unit Labor Costs (index 2008=100) Data Source: IMF, World Economic Outlook Database, April 2016 The bottom-line is that structural reforms in product and particularly labor markets since 2009/10 have been associated with non-trivial reductions in unit labor costs, but only with modest gains so far, on the international relative price of final goods. Thus, much of the very sizeable adjustments in the CAs documented above should be mostly ascribed to variables other than a depreciation of the CPI-based real effective exchange rate, as we highlight below. Such meager gains in the CPI-based real exchange rate correlate with likewise modest gains in relative TFP except in the case of Greece where TFP dropped sharply during the large output contraction of 2010-12. On 60 70 80 90 100 110 120 Greece Ireland Italy Portugal Spain "Core" eurozone (GDP-weighted average)
29 the plus side, Portugal and Spain managed to bring to a halt the declining path of TFP relative to the Eurozone peers between 1999 and 2007 (see also Table 1). In light of the positive coefficient on TFP in the CA regressions of Table, relative TFP growth no longer came to have a negative impact on CAs, but the contribution has been relatively small, at least up to 2014 (last observation available). The contribution has been more significantly positive for Ireland, as TFP rose (both in absolute terms and relative to core Eurozone peers) between 2008 and 2014, but also significantly negative for Greece. While such TFP estimates – even though coming from a classical source - must be viewed with some care, due to measurement difficulties that do not plague other macroeconomic indicators, they do paint a picture that is consistent with relative price developments in Ireland, Portugal and Spain.17 In the case of Greece, they show, however, far less benign developments in external competitiveness than suggested by real exchange rates and unit labor cost indices. 17 Such difficulties in measuring TFP growth accurately may be greater for some countries. In the case of Ireland, for instance, those difficulties are exacerbated by the extensive presence of multinationals with offshoring trade activity, which distorts productivity measurement.
30 Figure 8. Total Factor Productivity Relative to Eurozone Core (index 2008=1.0) Data Source: Penn World Table, version 9.0 One the fiscal side, as also documented elsewhere in this volume, an important segment of structural reforms in southern countries has taken the form of public sector streamlining. To the extent that the effects on general government balances are expected to be long-lasting and the so-called Ricardian equivalence does not hold, one might expect that effects on savings and hence on the current account be readily felt. Figure 9 shows that the upward trend in general government primary spending (deflated by CPI inflation) since the onset of the euro has been clearly reversed in the crisis-hit countries since 2009. While some of this reversal in public spending trends have been dictated by cyclical adjustments to falling external financing (and to an extent that is still 0.70 0.75 0.80 0.85 0.90 0.95 1.00 1.05 1.10 1.15 Greece Portugal Ireland Spain Italy
31 much debated in policy circles), longer-term considerations of attaining fiscal sustainability and increasing the productivity of public sector have also been present. To the extent that the latter are not reversed once cyclical adjustment is over and the supply of external financing returns to “normal”, these countries’ CAs should not be expected to return to the large deficits of the pre-2008 period. Figure 9. Real General Government Primary Expenditure (CPI deflated, index 2007=100) Data Source: IMF, World Economic Outlook Database, April 2016 Turning to the financial sector side, Table 3 has established that credit growth in excess of GDP growth has gone hand-in-hand with CA imbalances in the Eurozone in general (i.e., during “good” and “bad” times and on average across countries). Figure 10 further indicates that much of the CA adjustment in 2010-15 reflects the dramatic contraction 40 60 80 100 120 140 160 Greece Portugal Ireland Spain Core EZ
32 of bank credit to the private sector in all four countries. The magnitude of decline was far larger than that of real income in Ireland, Portugal, and Spain and about pari passu with income in Greece – where output contraction has been the most severe of all. Figure 10. Bank Credit to the Private Sector (in percent of GDP) Data Source: World Bank and Bank for International Settlements This sharp curtailment in credit to households and business exacerbated the downward adjustment in consumption, hence inducing a rise in household saving ratios. Insofar as it also contributed to the decline in business investment, the gap between aggregate saving and 40 60 80 100 120 140 160 180 200 220 240 Greece Ireland Italy Portugal Spain "Core" eurozone (GDP-weighted average)
33 investment thus fell. Hence the contraction in bank credit was one main factor in the elimination of large CA deficits. While the sharp declining in bank credit during 2010-13 reflects the drying up of external financing and the negative effect of falling prices of sovereign bonds on banks’ balance sheets (as public bonds were widely held on banks’ balance sheets – see, e.g., Popov, A., and N. Van Horen 2015), it also reflected reform efforts to strengthen domestic bank systems through the closing of insolvent banks, a reduction in leverage and equity building in the surviving institutions, as well as tighter prudential regulations. To the extent that these efforts continue at the distinct national levels as well as under the transnational umbrella of the European banking union going forward, they should help cap CA imbalances and mitigate the risk of a return to the high imbalances of the 2000-07 period. 4. Concluding Remarks The dramatic current account reversals in Greece, Ireland, Portugal, and Spain after 2008 reflect a mix of retrenchment of external private financing, major fiscal adjustments, and bank sector distress associated with highly leverage positions on the eve of the Eurozone sovereign debt crises of 2010-13. However, it also appears to reflect - even if more subtly – some of the reform effort in recent years through a reduction in unit labor costs relative to trading partners and some growth of total factor productivity - even if quite uneven across those four countries.
34 There are distinct reasons for some opacity is seeing through the effects of reforms on external balances. One is that the pay-off of important reforms in labor and product markets, as well in public sector, may take time, for the reasons already discussed in other chapters of this book . A second, and important reason, is that macroeconomic performance reflects a combination of the supply-side reform effects and current demand conditions; the latter can obfuscate the positive effects of the former on growth and external competitiveness. For instance, export growth may not respond to concomitant improvements in TFP and unit labor costs because credit to exporters have not fully recovered from its crisis set-backs; conversely, the CA balance may look more positive than warranted by the reforms just because aggregate demand is yet to return to its potential growth. Moreover, as also documented in Gerali et al. (2015) and OECD (2016), labor market reforms can exacerbate the contractionary effects of credit crunches and fiscal consolidations in the short-run, before their positive pay-offs on competitiveness and output growth kick in. Third, structural reforms by their own nature create some uncertainty about their own success and duration. Thus, insofar as agents are forward-looking, the effects of reforms on the CA include not only actual developments and policies but also effects associated with uncertainty about the future. Classic manifestations of those include higher private saving for precautionary reasons , a slower-than-warranted recovery of business investment and efforts to reduce corporate leverage via higher corporate savings (see European Commission, 2013 for a discussion of the latter) – all of which lead to a
35 higher CA. Because those “second-order” effects may take long to dissipate, CA balances may overshoot the new post-reform “normal”. At the same time, one cannot discard the possibility that consumers and business learn from major crisis experiences and become more prudent or “risk-averse”. This possibility is certainly consistent (but not necessarily the only cause) of the persistent nature of CA turn-around in many countries that experience major financial crises in the 1990s and early 2000s, such as Malaysia, Korea, Mexico, Thailand and Sweden. On balance, the weight of the evidence suggests that high the CA deficits of the 2000-07 period are unlikely to return. It remains open to discussion, however, how much of the recent improvements in CA balances reflect permanent competitiveness gains due to reform efforts and more prudent macroeconomic management. As discussed in this chapter, this discussion is all the more complicated, because some different indicators of external competitiveness do not paint a congruent picture. For instance, data on international relative prices suggest very limited progress in lowering the price of domestic goods relative to that of trading partners, but a far greater effect on relative costs which may, eventually, percolate through lower prices. Yet, more in line with relative final price indicators, TFP data point to modest gains in three of the four countries and non-trivial losses in aggregate productivity in Greece. In light of the econometric results presented in section 2, recent TFP gains in Ireland, Portugal, and Spain, should warrant some improvements in their CAs, but likely of modest magnitudes by themselves. Focusing on a broader definition of
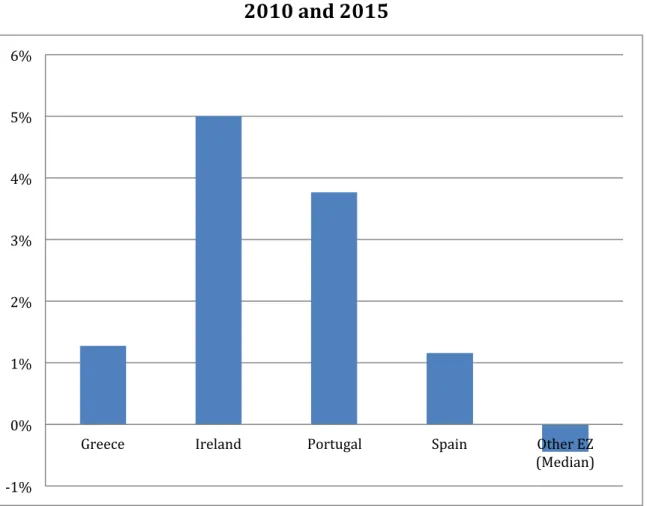
36 “competitiveness”, the well-known World Economic Forum index of global competitiveness – which in turn summarizes a wide range of indicators pertaining to product and labor market efficiency, governance, fiscal discipline, and the strength of the domestic financial sector - indicates that reforms have generally contributed to CA strengthening particularly so in the case of Ireland and Portugal (see Figure 11). Figure 11. Changes in the Overall Competitiveness between 2010 and 2015 Data Source: World Economic Forum, Global Competitiveness Index. -1% 0% 1% 2% 3% 4% 5% 6%
Greece Ireland Portugal Spain Other EZ
37 Altogether, these elements suggest a generally positive gradient running from structural reforms to improved external balances; yet, finer measures of the “pure” effect of structural reforms on the CAs of those countries will require further research and reliance on forthcoming data. Be that as it may, some general practical implications seem warranted on the basis of the evidence presented in this chapter - namely: • Fiscal adjustment (some of it stemming from reforms aiming at enhancing public sector efficiency and sustainability of public finances), financial sector de-leveraging, and generally tighter credit market conditions played key roles in the massive CA rebalancing within the Eurozone between 2008 and 2015. Thus, smaller fiscal deficits and a more capitalized and less leveraged banking sector appear to be clearly important in mitigating the risk of a return to large imbalances of the past, once output returns to potential. • Reforms tend to improve external balances to the extent that they improve the growth of total factor productivity (TFP) relative to that of trading partners. So, if reducing external vulnerability is one of the main goals of structural reforms and if the positive supply-side effect of higher TFP on current account dominates (as in the above econometric analysis), policy makers should give some prominence to reforms that are likely to have tangible effects on TFP.
38 • CA improvements have been more associated with a reduction of unit labor costs than with improvements in consumer prices relative to trading partners. Prima-facie, such a decoupling not only suggests that reforms in product markets have lagged behind those in labor markets, but possibly also that the effects of the latter on the prices of final goods are still working themselves out. Given that estimates of the elasticity of exports to changes in unit labor costs appear to be substantial (IMF, 2017), even the modest reduction in those costs can have a non-trivial effect, so they appear to be accounting for some of the improvement in the trade balance and the CA. • It thus follow that, to the extent that adjustment programs under the ESM and IMF stimulated reforms as part of their conditionality, those adjustment programs facilitated a reduction of external imbalances and improved “competitiveness”, broadly defined. • It must be acknowledged, however, that even correcting for the harshness of the recession, a non-trivial part of the CA adjustment remains unexplained on the basis of historical relationships between macro fundamentals and the CA. This suggests that expectational factors and difficulties in measuring current and prospective effects of the reforms on aggregate savings and investment are at play. Thus, to minimize the risk of a repeat of large imbalances of the past, policy should err, if anything, on the
39 side of caution in assessing the effects of stronger macroeconomic fundamentals on the evolution of external positions. This in turn, suggests that further strengthening of macroeconomic fundamentals and a consolidation of the reform agenda are important to minimize the risk of large external imbalances of the past. Such a cautionary stance may be all the more appropriate once the economic recovery gathers momentum and private sector’s confidence returns to pre-crisis levels.
40 References Bassanini, A., and Cingano, F., 2016, Short-term Labour Market Effects of Structural Reforms: Pain Before the Gain? In: OECD Employment Outlook 2016, Chapter 2, Paris, OECD Publishing. Cacciatore, M., R.Duval, G. Fiori, and F. Ghironi, 2016, “Short-Term Pain for Long-term Gains: Market Deregulation and Monetary Policy in Small Open Economies”, Journal of International Money and Finance, 68, pp. 358-85. Catão, L.A.V. and G.M. Milesi-Ferretti, 2014, “External Liabilities and Crises”, Journal of International Economics, 94(1), pp.18-32. Catão, L.A.V., A. Fostel, and R. Rancière, 2017, “Fiscal Surprises and Yield Decouplings”, IMF Economic Review, Forthcoming.. Ca’Zorzi, M., Chudik, A., and Dieppe, A. (2012) Thousands of Models, One Story: Current Account Imbalances in the Global Economy. Working paper 1441, European Central Bank. Chinn, M., and E. Prasad, 2003, “Medium-term determinants of current accounts in industrial and developing countries: an empirical Exploration”, Journal of International Economics, 59(1), pp. 47-76. Chinn, M., 2006, “A Primer on Real Effective Exchange Rates:
41 Determinants, Overvaluation, Trade Flows and Competitive Devaluation”, Open Economies Review, 17(1), pp. 115-142. Eaton, J., and Fernandez, R., 1995, Sovereign Debt. In Grossman, G. and Rogoff, K. (eds.) Handbook of International Economics vol. 3., Amsterdam, The Netherlands, North Holland. European Commission, 2013, “Assessing the impact of uncertainty on consumption and investment”, Quarterly Report on the Euro Area, 12(2): 7–16. Gerali, A., A Notarpietro, and M. Pisani, 2016, “Macroeconomic Effects of Simultaneous Implementation of Reforms, International Finance 19:1, pp.42-65 Giordano, Claire and Francesco Zollino, 2016, “ Shedding Light on Price- and Non-price-competitiveness Determinants of Foreign Trade in the Four Largest Euro-area Countries”, Review of International Economics, 24 (3), pp. 604–34 International Monetary Fund, 2017, “Spain: Selected Issues”, IMF country report 17/24. Lane, P., 2011, “The Dynamics of Ireland’s Net External Position”, Trinity College, mimeo.
42 Lane, P., and P. McQuade, 2013, “Domestic Credit Growth and International Capital Flows”, Scandinavian Journal of Economics, 116, pp. 218-52. Lee, J., Ostry, J. D., Prati, A., Ricci, A. L., and Milesi-Ferretti, G. M. (2008) Exchange Rate Assessments: CEGR Methodologies, Washington, DC, International Monetary Fund. Manasse, P., 2015, “What went wrong in Greece and how to fix it: Lessons for Europe from the Greek Crisis”, VOX-EU, June, 12th, 2015 Obstfeld, M., 2012, "Does the Current Account Still Matter?" American Economic Review, 102(3): 1-23. Obstfeld, M., and Rogoff, K., 1996, Foundations of International Macroeconomics, Cambridge, MA, MIT Press. Organization for Economic Cooperation and Development, 2016, “Short-term labor market effects of structural reforms: Pain before the gain?”, OECD Employment Outlook, Paris. Popov, A. & N. Van Horen, 2015. “Exporting Sovereign Stress: Evidence From Syndicated Bank Lending during the Euro Area Sovereign Debt Crisis, Review of Finance, 19(5), pp 1825-1866.
Phillips, S., L. Catão, L. A. Ricci, R. Bems, M. Das, J. Di Giovanni, F. Unsal,
43
Assessment (EBA) Methodology," IMF Working Papers 13/272,