A Work Project, presented as part of the requirements for the Award of a Masters Degree in Management from the NOVA – School of Business and Economics
THE VALUATION OF PROJECT “BYD ELECTRIC VEHICLES PLANT IN WUHAN CITY, CHINA”
Youquan Di – No. 24814
A Project carried out on the Master in Management Program, under the supervision of: Professor João Pedro Pereira
Abstract
Since the global climate has changed increasingly and oil crisis concern became the primary importance, the automobile industry has to seek for alternative fuels, which is the high priority for governments and vehicle manufacturers all over the world. In this circumstance, BYD decided to build an electric vehicle plant in Wuhan 2010. However, this project was not carried out. Recently, the cost of battery decreases and the market demand increases, therefore, this article valued this project by building a valuation modeling and a sensitivity analysis based on today’s horizon, which demonstrated the possibility of being profitable under today’s situation.
CONTENTS
1. Introduction ... 3
1.1 Objective ... 3
1.2 Structure and Methodology ... 3
1.3 Data Collection ... 4
1.4 Project Overview ... 5
1.5 Market Overview ... 6
2. Project Valuation ... 7
2.1 Building the Financial Modeling ... 7
2.1.1 Forecasting Earnings ... 8
2.1.2 Working Capital Calculation ... 9
2.1.3 Forecasting Free Cash Flow ... 11
2.2 Estimating the Cost of Capital (WACC) ... 12
2.3 Valuing the Investment ... 13
2.3.1 Estimating Continuation Value ... 13
2.3.2 NPV of the Project ... 15
2.3.3 Other Techniques – IRR and Payback Period ... 16
2.4 Sensitivity Analysis ... 16
3. Recommendations ... 18
3.1 Reducing the Cost of Raw Materials ... 19
3.2 Increasing the Proportion of the Buses Sold ... 19
4. Conclusion ... 20
5. References ... 22
1. Introduction 1.1 Objective
With the global warming and oil resources exhaustion, the development of new energy has gained more attention of many countries. As one of the biggest greenhouse gas emissions and oil consumption countries, China is laying ever more stress on the development of new energy field, among which the electric vehicles industry has been developed dramatically since 2009. BYD, a Chinese listed company who principally engaged in IT industry mainly related to rechargeable battery business and automobile business, planned to invest 13.9 billion in constructing an electric vehicle manufactory in Wuhan, China in 2010 (Feasibility Report of Wuhan BYD Project, 2010, p. 4). But until the moment of writing this thesis, this project has not been implemented. There must be some reasons that the project did not take place. This thesis reinforced the understanding of the investment analysis of the project and try to make sense why the project did not take place in 2010. However, as the global electric vehicle market has been changing dynamically, which would consist of lower cost of battery, massive increase in market demand and new subsidy policies, the project would perform differently if implemented today. Thus, the main objective of this thesis is to value the project under today’s situation and try to figure out whether it is practical.
1.2 Structure and Methodology
The structure of this paper can be divided into four parts.
The first part stated the overall introduction, which briefly introduced the objective and significance of this thesis, methodology, project overview and the electric vehicle market
overview.
The second part, core section of the paper, can be divided into four steps suggested by Berk and DeMarzo (2014). In the first step, we build a financial model assuming that the project will be implemented at the start of 2017, and will operate at least eleven years. We begin by projecting the project’s future earnings, and then consider its working capital and investment needs and estimate its free cash flow (FCF). Additionally, the weighted average cost of capital (WACC) is identified in the second step. Valuing investment, as the third step, involves determining the continuation value and discounting the free cash flows to determine the net present values (NPV). Another analytical method applied in this section was Payback Investment Rule recommended by Berk and DeMarzo (2014).
Lastly, sensitive analysis is concluded. According to Damodaran (2007), it is necessary to perform a sensitivity analysis in order to see how the estimated value of the project changes under different input parameters. Koller et al., (2010) and Brealey and Myers et al., (2009) suggested performing a sensitivity analysis which shows how the NPV varies as the underlying assumptions change.
Aiming at the problems mentioned before, the third part suggested some specific recommendations for BYD to implement this project today.
The final part is the conclusion of the paper, summarizing the analysis results and concluding the recommended final decision for BYD.
1.3 Data Collection
papers, internet or books and reports are publically available. The main source of financial information about the project is from the Feasibility Report of Wuhan BYD Project (2010) and BYD’s annual report 2015. In terms of the forecasted input parameters, such as the sales of electric vehicles and the cost of materials are estimated based on the market historical performance.
1.4 Project Overview
At the beginning of 2010, BYD planned to invest in constructing an electric vehicle manufacture plant in Wuhan, China. The plant was supposed to be set up in the Economic Development Zone in Wuhan, with occupied area of one million square meters. The total investment was 13,893,060,000 CNY, in which the private capital from BYD was 4,167,920,000 and the rest part was borrowed from Bank of China (Feasibility Report of Wuhan BYD Project, 2010).
However, as mentioned before, this project has not been carried out until now. In this case, we revalue the project as if it would be implemented at the beginning of 2017. The construction of the plant was expected to be concluded in two years. For the first year, there will be no production. The plant will start to produce electric cars “BYD e6” and electric buses “BYD k8” in 2018 under a sixty percent of fully operational condition. Then, it will be officially put into fully operation from 2019, after the conclusion of the whole construction.
BYD showed off its representative product e6, which has a driving range of 320 km on a single charge according to Ayre (Dec, 2016). He also stated that the outstanding driving range made e6 a head above most of its would-be competitors, though not the Chevy Bolt EV or any of
Tesla’s offerings. This driving range will make e6 meet the expectations of most of the consumers. The e6 has three versions, including Luxury, Elite, Honor. The prices for each corresponding version are 309,800 CNY, 330,000 CNY and 369,800 CNY based on BYD’s official website (2016). For convenience, we computed the average price of 336,000 CNY. For the electric buses, BYD has its representative product k8, whose price is around 1,700,000 CNY (BYD Official Website, 2016).
1.5 Market Overview
In recent years, with the continuous development of electric industry and related policies support, China’s electric vehicle industry has achieved considerable progress. In 2015, the production and sales of electric vehicles in China reached 254,633 units and 247,482 units, increasing 4.2 times and 4.5 times year on year (CAAM, 2016).
The production and sales curve of the new vehicle industry can be seen as a growing curve, since the main trend of the industry is to further develop the new energy, not only because it is economically profitable, but also because of the in depth significance of eco-friendly moves to help preserve our planet. The China Association of Automobile Manufacturers (2016) and the Electric Drive Transportation Association (2016) all indicate that sales of electric cars in China surpassed those in the US in 2015, making China the largest electric vehicles market for the first time.
From 2008 to present, the Chinese government has adopted a series of policies to encourage the development of NEVs, and has paid great attention to the development of this industry, which created a stable and prosper development. In order to promote the electric vehicles, the
government provided purchase subsidies of 35,000 to 60,000 CNY for consumers according to Ministry of Finance of the People’s Republic of China (2015). Other incentives, such as free parking, no need to run a lottery earning car ownership, and no restriction of the End-number License Plate Policy (Feng & Li, 2013). With the support from the government, the electric vehicle industry will be further developed and the related projects will be well conducted and valued.
Figure 1 Production and Sales of Electric Battery Vehicles. Source: China Auto Industry Information, (2016).
2. Project Valuation
2.1 Building the Financial Modeling
To simplify our problem, we built a financial modeling suggested by Berk and DeMarzo (2014). In terms of the length and details of the model, we developed an explicit eleven-year forecast and then value the remaining value of the project. We divided this process into three steps. First, we begin by forecasting earnings in order to estimate the cash flows of this project, we will obtain the eleven-year pro forma income statement in this step. Then forecast the project’s
5,655 11,241 14,243 48,605 254,633 5,579 11,375 14,604 45,048 247,482 - 50,000 100,000 150,000 200,000 250,000 300,000 2011 2012 2013 2014 2015
Production and Sales of Electric Vehicles (in units)
working capital needs and achieve the net working capital (NWC). At last, with the data we forecasted and calculated, we combine these items to determine the free cash flow (FCF). 2.1.1 Forecasting Earnings
The value of the project arises from the future cash flows it will gain. We build a pro forma income statement to figure out the future cash flow estimated. To achieve the income statement, we have to estimate some of its input components, such as sales of the plant per year, cost of materials. Some other key parameters are inferred from BYD’s annual report 2015, like the depreciation of the production equipment (BYD’s annual report 2015, p. 56) and the average wages of employers (BYD’s annual report 2015, p. 74).
In terms of the scale and production of the plant, we compared the plant with another BYD’s automobile manufacture, Tianjin BYD, whose scale is half of Wuhan BYD. Under a full operation, the Tianjin manufacture can produce 10,000 units of electric cars and 2,000 units of buses (BYD Tianjin, 2015). We assumed that the manufactory would output 20,000 electric cars and 4,000 electric buses per year under a fully operational efficiency. As already discussed before, each unit of e6 will be priced at 336,000 CNY, while k9 will be priced at 1,700,000 CNY. In the first year 2017, the plant will not be able to operate, so there was no sale during that period. For the year 2018, the yield would be three fifths of the full operational state, which means 12,000 units of e6 and 2,400 units of k8. From 2019, the manufactory would be able to produce vehicles in fully operational condition consists of 20,000 units of e6 and 4,000 units of k8.
construction buildings and equipment. The annual depreciation rate of these items was 9.5% and the residual rate was 5% (BYD’s annual report 2015, p139). According to the official document from Chinese Ministry of Finance (2008), to encourage the development of new energy industry, the income tax of electric vehicles company was 15%, which was obviously lower than other normal industry’s income tax of 25%.
Finally, we arrived at the net incomes from 2017 to 2027 listed in Appendix A. 2.1.2 Working Capital Calculation
In this section, the project’s net working capital was computed as the difference between the forecasted current assets and current liabilities stated by Berk and DeMarzo (2014, p. 26). Increases in the net working capital represent the cost to the project. There are many cost drivers in the production of an automobile, among which the raw materials contribute around 47% to the cost of an electric vehicle (Kallstrom, 2015). So compared with other drivers, the materials must have a significant influence on the revenue.
Figure 2 Cost Components in the production and sales of electric vehicles Source: Market Realist, (2015).
As we all know, electric vehicle has the battery as its only source of energy. Most of the batteries are Lithium-ion battery (LIB) cells (Miller, 2015). The cost of lithium-ion battery contributes about 50% to the cost of materials (Report of Market Prospects and Investment Forecast Planning on Global Electric Vehicle Industry (2017-2020), 2016). Therefore, to reduce the cost of battery, many lithium-ion battery manufactures devoted themselves to creating advanced batteries. Recently, breakthrough technology delivers high power and energy density combined with excellent safety performance and extensive cycle life. High quality automotive battery meets the demanding performance requirements of electric vehicles. According to Colin (2016), battery prices fell 65% since 2010, and 35% just in 2015, reaching US$ 350 per kWh (Bloomberg, 2016). Without a doubt, the continuing reductions in battery prices will save the total cost of electric vehicles.
Figure 3 Cost for Lithium-ion Battery Trend Source: Bloomberg. (2016).
(Annual report 2015, p.74), each employer can gain 63,000 CNY per year. As analyzed before, there are around 3000 employers in Tianjin BYD (BYD Tianjin, 2015). Wuhan BYD is estimated to have 6,000 employers which would be twice of Tianjin’s. We determined the total wages which to be listed in the current liabilities. Lastly, we estimated the other account payables to obtain the total current liabilities. From the second year on, the plant will be put into partly operation and start to produce products, the production will be 60 percent of complete operation; from the third year, 2019, the plant begins to operate completely. Based on the assumption before, we calculated the increase in NWC per year presented in Appendix B. From the achievement we have got, we can see that for year2018 and 2019, the NWC increases as the production increases. For year 2020 and beyond, the NWC equals to zero because the assumed yield is constant since then.
2.1.3 Forecasting Free Cash Flow
The value of the project comes from its future cash flows it will generate. To determine cash flow, we started with the net income which already has been calculated before. First, we adjust net income by adding back the after-tax interest payment.
After-tax interest expense = (1 – Tax Rate) * (Interest on Debt – Interest on Excess Cash) We assume that the project has no excess cash, so its after-tax interest expense in 2018 is (1 – 15%) * Interest Payments (Berk & DeMarzo, 2014, p. 638) in 2018. By this step we achieved the unlevered net income by plus the after-tax interest expense. Adding back depreciation and deducting capital expenditures and increases in net working capital, we got free cash flow from 2017 to 2027 illustrated in Appendix C. This FCF represents the cash flow the project will
generate for BYD Company (the equity investor) and the bank (the debt holder). At the first two years, BYD will invest a large amount of money into the manufactory’s initial construction and equipment, and there will be not production for the first year, 2017. In year 2018, the plant will operate at 60 percent of the full production efficiency, so that the inputs and outputs are estimated to be approximately at 60 percent of those under the fully condition. The plant will peak out its highest production and the free cash flow will be roughly constant which is evaluated of 5,508,140,000 CNY since year 2020 shown in Appendix C.
The free cash flow includes two parts, one is FCF to BYD and debt lender, and the other is FCF to BYD only. Since BYD Company is the only equity investor to this project, we should focus on the cash flow that BYD will receive, which means evaluating the project in the perspective of BYD. So, in Appendix C, we restated the FCF statement by removing the cash flow to debt holder and approached to Free Cash Flow to Equity (Berk & DeMarzo, 2014, p. 636).
2.2 Estimating the Cost of Capital (WACC)
We assume that the project will maintain a relatively stable debt-to-value ratio. In such cases, to value the project by using discounted cash flow, we discount our forecast of free cash flow at the weighted average cost of capital (WACC). In the case of a firm’s equity or debt, we estimate the cost of capital on its history data. Because a new project does not have history data to estimate, we assume that the market risk of the project is expected to be similar to that for BYD’s other lines of business. In the end of 2016, the ten-year China government bond rates was approximately 3.18% (Wall Street Journal, 29-12-2016) (Trading Economics, 2016), we use this rate for the risk-free interest rate. We approached the BYD’s equity cost of capital was
𝑟" = 11.4% (Yahoo Finance, 2016) while the debt interest rate 𝑟# = 4.90% (Bank of China, 2015). We can estimate the equity cost of capital for the project by using BYD’s (Berk & DeMarzo, 2014, p. 640). And we also got the tax rate is 15% according to Chinese Ministry of Finance (2008). Total equity and total debt were 4,167,920,000 (E) and 8,385,389,000 (D).
Sources: Berk, J. & DeMarzo, P., (2014). Corporate Finance (3rd ed.). Pearson Educational Limited. With calculation we can know that the weighted average cost of capital equals to 6.57%. This estimation might contain a large amount of uncertainty. Thus, Koller et al., (2010) and Brealey and Myers et al., (2009) suggested that there is necessary to conclude sensitivity analysis in section 2.4 later.
2.3 Valuing the Investment
2.3.1 Estimating Continuation Value
So far, we have explicitly forecasted and calculated eleven years of cash flows from Wuhan BYD project, and we have estimated the weighted average cost of capital of the project. However, at the end of 2027, this project will still have value beyond our forecast horizon. We called it continuation value.
As we all know, the global electric vehicle market has undergone rapid development over the past ten years. China, as the largest automobile production country, still has a great potential development in electric vehicle market. In this case, we assumed that the sales grow at a nominal rate 2% per year. If the operating expenses remain a fixed percentage of sales, then its unlevered net income will also grow at rate 2%. Similarly, the receivables, payables, and other
elements of net working capital will grow at rate 2% (Berk & DeMarzo, 2014). Continuation Value in Year 2027 = PV (Sum of FCF in Year 2028 and Beyond)
= $%$&'&(
*+,--./
According to Berk & DeMarzo (2014. p. 694),
the 𝐹𝐶𝐹2324 = 𝑈𝑛𝑙𝑒𝑣𝑒𝑟𝑒𝑑 𝑁𝑒𝑡 𝐼𝑛𝑐𝑜𝑚𝑒2324 + 𝐷𝑒𝑝𝑟𝑒𝑐𝑖𝑎𝑡𝑖𝑜𝑛2324 – 𝐼𝑛𝑐𝑟𝑒𝑎𝑠𝑒 𝑖𝑛 𝑁𝑊𝐶2324 – 𝐶𝑎𝑝𝑖𝑡𝑎𝑙 𝐸𝑥𝑝𝑒𝑛𝑑𝑖𝑡𝑢𝑟𝑒𝑠2324 ,
where the 𝐶𝑎𝑝𝑖𝑡𝑎𝑙 𝐸𝑥𝑝𝑒𝑛𝑑𝑖𝑡𝑢𝑟𝑒𝑠2324 = 𝐷𝑒𝑝𝑟𝑒𝑐𝑖𝑎𝑡𝑖𝑜𝑛2324 + g * 𝐹𝑖𝑥𝑒𝑑 𝐴𝑠𝑠𝑒𝑡𝑠232K.
We obtained the fixed assets in 2027 equals to 9,386,006,000 CNY which consists of land, buildings, equipment, etc based on the Feasibility Report of Wuhan BYD Project (2010, pp. 126 - 130).
By the year 2027, all the debt will be paid off, thus, this project will be all-equity operated, so the weighted average cost of capital 𝑟LMNN = 𝑟" = 11.4%. Under assumption of constant growth which is 2%. There is one thing should be mentioned is that we considered the continuation capital expenditures and other possible operating and financial activities also have a growth rate at 2% in the future. For example, the equipment and workshops ages over time, the facilities and installation will be replaced by new ones, all these activities need reinvestment to the project. Here, we The wages of workers may go up with domestic inflation. However, the prices of electric cars and buses will vary from the market environment. However, we could not predict that many factors, so we just assumed the main factors of the electric vehicles development and set up one project model. Thus, the continuation value of year 2028 and beyond as a multiple of the project’s final free cash flow listed under the year 2027.
Continuation Value in Year 2027 Horizon = 46,785,556,000 CNY. 2.3.2 NPV of the Project
When making an investment decision, financial managers must focus on whether investing in a certain project makes economic sense. The net present value investment rule (NPV) is the most common concept applied today. In this case, we used NPV rule to see whether the project will gain money or not.
In the previous sections, we have already calculated the free cash flows for 2017 to 2027, the continuation value for 2028 and beyond, and the weighted average cost of capital. And we know that at the beginning of the project in 2017, BYD Company had 4,167,920,000 for initial investment, but it is not enough to start the project, so the company had to borrow money from Bank of China. The amount of debt is 8,385,389,000 CNY at the debt interest of 4.90%(Bank of China, 2015).
First, we applied discounted cash flow analysis (DCF) to calculate the present value of the future cash flows at weighted average cost of capital. Then sum up each year’s discounted value. At last, taking into account the initial investment, in the Appendix D, we got the NPV of the project which equals to 44,364,414,000 CNY.
The NPV of project reflects the total value to all capital providers, both of BYD Company and the debt provider. From the result we can see, the project will generate money for BYD (equity holder) and Bank of China (debt holder).
However, we can not judge the project will be profitable or not in BYD’s perspective. Thus, we restated the FCF to Equity (FCFE) by removing the After-Tax Interest Expense from FCF to
Project (Berk & DeMarzo, 2014, p. 638). Finally, we recalculated the NPV of equity which equals to 31,425,703,000 CNY shown in Appendix D.
2.3.3 Other Techniques – IRR and Payback Period
Besides the NPV investment rule, other methods such as the internal rate of return rule (IRR) and payback period rule were used in the real world.
To compute the IRR, we already have the FCF to project and FCF to equity. IRR can be easily computed by function in excel. Lastly, we got the project IRR is 34%, while the equity IRR is 66% presented in Appendix E. The return on equity is really high so that BYD would gain much from the project.
For the investor, Wuhan BYD project should only be accepted if its cash flows pay back its initial investment within an acceptable period (Berk & DeMarzo, 2014, p. 214). It is easy to see that the sum of present value of future cash flows turns positive until 2023. So, we can infer that the cash flows will payback its initial investment during the year 2022. Then, by assuming the cash flow to be gained linearly during that year, we computed the payback period is 5.98 years. The calculation and numbers can be found in detail in Appendix F. Obviously, by implementing the Wuhan project, BYD could regain its initial investment in less than 6 years. 2.4 Sensitivity Analysis
We have estimated the free cash flow and cost of capital of the project, and roughly calculated its NPV and Payback Period to value the project. In terms of all the assumptions, we assumed the project keeps its capital structure constant at a target ratio of debt to equity, and keeps its financial and operating activities constant in an ideal market.
Valuation requires a forecast, but the future can take many paths. In terms of the electric vehicle market, government policies might have a great impact on it. Also, a revolution of the battery could enhance the performance of electric vehicles, thus affect the whole electric vehicle industry. In the real world, things always change. Thus, the above estimations are often subject to significant uncertainty. Therefore, before concluding our valuation, it is important to assess the uncertainty of our estimates. Sensitivity analysis is generally applied. It is important in determining whether or not to make this project.
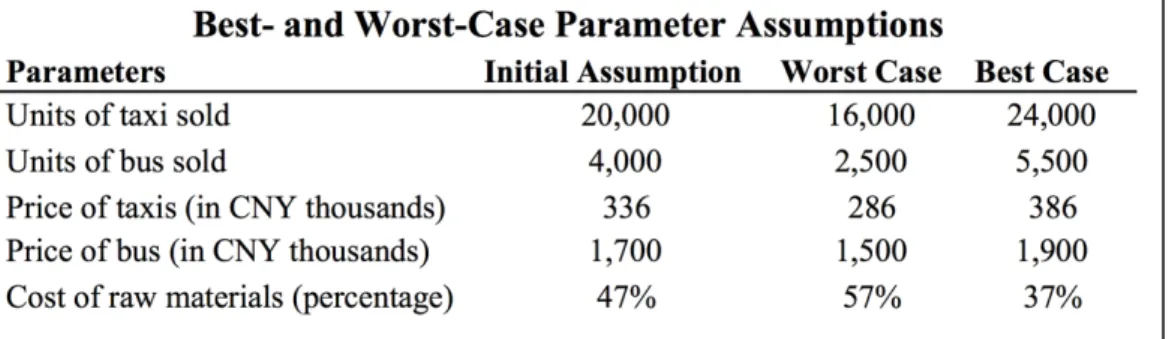
In this part, we performed a sensitivity analysis to determine the impact of changes in different parameters on the project’s value. To assessing the impact of individual drivers, we broke the NPV calculation into its component assumptions and tested each input one at a time to see which has the largest impact on the project’s valuation. We recalculated the NPV of the project under the best- and worst-case assumptions for each parameter. So we can see how the NPV varies as the underlying assumptions change. We listed the most important drivers of the project’s value, these factors deserve close attention when managing the project. Three scenarios – called a base case, a worst case, and a best case – based on input parameters mirroring less or more optimistic future expectations are calculated.
Figure 4 Best- and Worst-Case Parameter Assumptions Source: Own work, based on Berk & DeMarzo (2014)
Figure 5 NPV varies from each single parameter changes.
Source: Own work, based on Berk & DeMarzo (2014)
The two figures above show the change in NPV under the best- and worst-case assumptions for each parameter. Differences between worst-case and best-case are the range of NPV under each parameter assumption. Among the factors presented, one percentage point reduction in cost of raw materials has the greatest effect on the project’s NPV, and the effect from the units of bus sold ranks at the second place. Thus, we can infer that the cost of raw materials and units of bus sold are the two main drivers of the NPV. They have more significant influence on the NPV than other components.
3. Recommendations
Through the analysis above, we know that the BYD’s project is practicable. The reasons are obvious: the NPV to the project equals to 44,364,414,000 CNY and this means it will generate significant revenue for both BYD and Bank of China, it will only take at 5.98 years to payback the initial investment if there will not be significant changes in the market.
By analyzing the project through sensitivity analysis, we find out two important components are effective significantly to the project’s NPV, one is the cost of raw materials and the other one is the units of bus sold.
Based on the foregoing findings of the study, the following methods are recommended for enhancement of the project.
3.1 Reducing the cost of raw materials
According to our estimation and calculation, a permanent one percentage point reduction in cost of raw materials will increase 1,174,151,500 CNY on the project’s NPV. Thus, managers have to pay attention to reduce the cost of raw materials. BYD should take the advantage of its whole production chain, which means producing all components of a car totally by itself. This will cut a large amount of cost of raw materials by lessening the tax expenses and transportation expenses.
What’s more, the cost of lithium-ion battery contributes about 50% to the cost of materials (Report of Market Prospects and Investment Forecast Planning on Global Electric Vehicle Industry (2017-2020), 2016). Therefore, to enhance the electric vehicle’s competitiveness, BYD should pay effort to creating low-cost high-performance batteries. One option for BYD is introducing advanced technology from Tesla, BMW or other outstanding electric vehicle companies.
3.2 Increasing the proportion of the buses sold
As we can see, the units of buses sold has a significantly effect on the NPV. Each hundred units of buses sold will add 623,833,800 CNY to the project’s NPV. Therefore, in the case of fixed initial investment, BYD should extend the proportion of its bus production line to have more buses sold.
4. Conclusion
This thesis aims to value BYD’s Wuhan project if implemented at the first of 2017, and to figure out whether the project is profitable or not. To achieve that goal, it is essential to make a valuation of the project. The valuation process consists four steps.
First, we followed the standard template suggested by Berk & DeMarzo (2014) to build an eleven-year financial model of the project. We forecasted key parameters by analyzing the China’s electric vehicle market, such as initial investment, prices and units sold of electric cars and buses, cost of the raw materials and so on. Then with calculation, we got the pro forma income statement, change in NWC, and FCF statement. The project will have negative free cash flows at its first two years because of the large amount of investment at the initial period. From year 2019, it will generate money.
Second, we estimated the weighted average cost of capital (WACC). The WACC method consists of two components: cost of equity and cost of debt. We used the capital asset pricing model to estimate the firm’s cost of equity of 11.4% and used the interest rate of debt to estimated the cost of debt at 4.90%. Then we got the WACC equals to 6.57%.
Third, we computed the NPV of the project by discounting the free cash flow using the WACC. However, we all know that the manufactory will apparently be operating more than eleven years. So we have to estimate the continuation value at the end of our eleven-year forecast horizon. Combining these data, we then estimated the net present value of the project in 2017. Besides the NPV rule, we also applied other techniques to measure the project. The payback period rule also evaluated the project in different perspectives. With estimation and calculation, we got the
results: NPV of project = 44,364,414,000 CNY, project IRR = 34%, while NPV(FCFE) = 31,425,703,000 CNY, equity IRR = 66%, and Payback Period = 5.98 years. It will take less than 6 years to payback its initial investment. Above all, this project is profit for both of the equity holder BYD and the debt lender Bank of China.
At last, as we all know, some uncertainty can be related to the future risk. Thus, in the fourth step, the valuation is followed by a sensitivity analysis. A best- and worst-case was applied in the sensitivity analysis which focused on five sensitivity parameters, units of car sold, units of bus sold, price of car, price of bus and cost of raw materials. It is clear that according to the sensitivity analysis, the valuation is more sensitive towards the change in two parameters -- cost of raw materials and units of bus sold.
Consequently, the BYD’s managers can implement the Wuhan BYD project. Also, wanting to gain more through the project, BYD should attach great importance to the two key components and take action to lessen the cost of raw materials and increase the units of bus sold.
As we all know, Tesla is leading in the technology, but BYD is leading in sales thanks to a strong electric vehicle market in China. Demand for electric vehicles has grown tremendously over the past 5 years, most notably in 2015 according to China Auto Industry Information (2016). According to Colin (2016), battery prices fell 65% since 2010, and 35% just in 2015, reaching US$ 350 per kWh (Bloomberg, 2016). The lower battery cost has reduced the price of electric vehicles to be acceptable by more consumers. Longer battery travel range has improved the performance of electric vehicles. BYD should grip the chance to devote to technology area as well as expending production scale to occupy the China’s market, even the global market.
5. References
Ayre, James. (Dec 21st, 2016). “EPA-rated range for 2016 BYD e6 electric taxi is 187 miles per full charge”. Glean Technica. Retrieved from
https://cleantechnica.com/2016/12/21/epa-rated-range-2016-byd-e6-electric-taxi-187-miles-per-full-charge/
Bank of China. (2015). Interest Rate of Debt. Retrieved from
http://www.bankofchina.com/fimarkets/lilv/fd32/201510/t20151023_5824975.html Berk, J. & DeMarzo, P., (2014). Corporate Finance (3rd ed.). Pearson Educational Limited.
Chapter 19. & pp.628 - 638. & pp. 693 - 697.
Brealey, R. A., Myers, S. C., & Marcus, A. J. (2009). Fundamentals of corporate finance (6th ed.), McGraw Hill.
BYD Co. Ltd. (2016). Annual report 2015. p. 139.
BYD Co. Ltd. (2016). Price List for BYD Automobiles. Retrieved from http://www.bydauto.com.cn/car-show-e6.html
BYD Tianjin Co. (2015). Introduction of BYD Tianjin Company. Retrieved from http://jy.bhcyzb.com/pin/6929.html
Bloomberg. (2016). Electric vehicles to be 35% of global new car sales by 2040. Retrieved from http://www.prnewswire.com/news-releases/electric-vehicles-to-be-35-of-global-new-car-sales-by-2040-300225689.html
CAAM. (2016). New energy vehicles enjoyed a high-speed growth. Retrieved from http://www.caam.org.cn/AutomotivesStatistics/20160120/1305184260.html China Auto Industry Information. (2016). “Analysis of China’s All Electric Battery
Vehicles Development”. Retrieved from
http://www.chyxx.com/industry/201601/375664.html
Damodaran, A. (2007). Strategic risk taking: a framework for risk management. Pearson Prentice Hall.
Feasibility Report of Wuhan BYD Project, (2010). p. 4 & pp. 126 - 130
Kallstrom, H. (2015). Raw materials - the biggest cost driver in the auto industry. Market Realist, part 8. Retrieved from http://marketrealist.com/2015/02/raw-materials-biggest-cost-driver-auto-industry/
Koller, T., Goedhart, M., & Wessels, D. (2010). Valuation: measuring and managing the
value of companies (5th ed.). John Wiley & Sons, Inc.
Miller. P. (2015). Automotive Lithium-lon Batteries. Johnson Matthey Technol. Rev., 2015, 59, (1). pp. 4-13. Retrieved from http://www.technology.matthey.com/article/59/1/4-13/ Ministry of Commerce of the People’s Republic of China. (2008). Tax rate of high-tech
industry. Retrieved from
http://www.mofcom.gov.cn/aarticle/bh/200805/20080505534363.html
Ministry of Finance of the People’s Republic of China. (2015). Policies of promoting electric vehicles. Retrieved from
http://jjs.mof.gov.cn/zhengwuxinxi/zhengcefagui/201504/t20150429_1224515.html Randall, T. (2016). Here’s how electric cars will cause the next oil crisis. Bloomberg.
Retrieved from https://www.bloomberg.com/features/2016-ev-oil-crisis/
Report of Market Prospects and Investment Forecast Planning on Global Electric Vehicle Industry (2017-2020). (2016). Chapter 5.2.5 Cost and Revenue of EV Analysis The Wall Street Journal. (2016). “China 10-year government bond”. Retrieved from
http://quotes.wsj.com/bond/BX/AMBMKRM-10Y
Trading Economics. (2016). “China government bond 10y”. Retrieved from http://www.tradingeconomics.com/china/government-bond-yield
Yahoo Finance Statistics. (2016). Retrieved from
6. Appendices
Appendix A - Pro Forma Income Statement
Appendix B - Net Working
Appendix D - NPV
Appendix E – Project IRR and Equity IRR