UNIVERSIDADE DE LISBOA FACULDADE DE CIÊNCIAS DEPARTMENTO DE INFORMÁTICA
SESAME: CLUSTERING WITH SEMANTIC
SIMILARITY BASED ON MULTIPLE ONTOLOGIES
Carlos Alexandre Lourenço dos Santos
MESTRADO EM ENGENHARIA INFORMÁTICA
Especialização em Sistemas de Informação
Dissertação Orientada por:
Professora Doutora Cátia Luísa Santana Calisto Pesquita
Acknowledgments
I am much obliged to professor Cátia Pesquita for her assertive supervising, broad knowledge and cooperative spirit. These characteristics provided valuable confidence in achieving a successful and appreciated work contributing to the feeling that the effort was worthwhile. I would also like to thank my colleague João Rebelo who selflessly helped to collect useful data for results’ analysis. Finally, this work benefited of the help obtained, in crucial moments, by email from Sébastien Harispe – author of the Semantic Measures Library – Eibe Frank – author of the Waikato Environment for Knowledge Analysis – and the Universal Protein Resource’s helpdesk.
Resumo
Muitas das técnicas de prospecção de dados actualmente utilizadas funcionam de um modo “cego”, limitando-se ao que pode ser extraído directamente a partir dos dados, sem compreender o seu significado e, de um modo geral, deixando a interpretação dos resul-tados para peritos humanos. É, no entanto, amplamente reconhecido que codificar um maior número de relações entre objectos melhora o desempenho de abordagens de pros-pecção de dados. Isto, tipicamente, envolve a feitura de regras que sejam capazes de expressar conhecimento relativamente à forma como objectos de dados se relacionam en-tre si, mas o surgimento de tecnologias de Semantic Web e a sua aplicação em domínios diversificados como as ciências da vida, a astronomia ou a geografia, está a disponibilizar uma grande quantidade de dados enriquecidos com conhecimento de domínio na forma de múltiplas ontologias. Este cenário apresenta oportunidades únicas para a combinação do poder de abordagens de prospecção de dados e aprendizagem máquina com o conheci-mento codificado em ontologias. O presente trabalho tem por objectivo abordar o desafio apresentado por esta mudança de paradigma através do desenvolvimento de novas abor-dagens para a descoberta de conhecimento alavancadas em tecnologias de Semantic Web e na abundância de conhecimento tornado disponível por intermédio das mesmas. Neste contexto, a semelhança semântica surge como um possível caminho para fazer a ponte entre os dois mundos, uma vez que pode ser usada para produzir uma medida de distância entre dois conceitos de uma ontologia ou entre duas entidades anotadas com conjuntos de conceitos de uma ontologia. Tendo em consideração que a distância é uma pedra angular de um número considerável de abordagens de aprendizagem máquina, incluindo diversas abordagens de segmentação (como, por exemplo, k-Means e Farthest First), a integração de semelhança semântica em algoritmos representativos do estado da arte da aprendiza-gem máquina disponibiliza uma forma de explorar dados usando o conhecimento contido em ontologias.
Tendo em vista atingir os objectivos descritos, foi implementada uma estrutura que utiliza duas bibliotecas de software do mais alto nível de desenvolvimento: a Biblioteca de Medidas Semânticas (SML) para o cálculo de semelhança semântica e o Ambiente Waikato para Análise de Conhecimento (WEKA) para algoritmos de aprendizagem má-quina. A SML foi ainda estendida tendo em vista permitir a computação de semelhança semântica usando múltiplas ontologias. Pela disponibilização de informação acrescida
relativamente a relações entre entidades, o recurso a referências semânticas provenien-tes de mais do que uma ontologia representa uma oportunidade para reforçar a qualidade potencial de processos de segmentação. Lidar com a integração de múltiplas ontologias numa única medida de semelhança semântica é um desafio conhecido. Neste trabalho fo-ram usadas duas abordagens simples: Híper-grafo e Média Ponderada. Para se obter um híper-grafo na SML, é necessário levar a efeito um processo de redefinição de raízes em que uma raiz virtual é criada para ligar os grafos carregados com cada uma das ontologias envolvidas. A abordagem de média ponderada combina os valores de semelhança semân-tica pela ponderação dos contributos de cada ontologia. No que diz respeito ao interface com o utilizador, para além de uma opção simples baseada em texto e da possibilidade de execução com especificação de parâmetros em linha de comando foi feita a integração das novas opções no explorador gráfico do WEKA e desenvolvido um ambiente gráfico próprio. Os resultados de cada execução são disponibilizados num ficheiro cujo con-teúdo visa essencialmente disponibilizar toda a informação relativa a essa execução com o máximo de clareza incluindo, nomeadamente, uma designada matriz de confusão iden-tificando o número de instâncias de cada classe de dados afetado a cada segmento.
O conjunto de dados usado na avaliação da aplicação de segmentação desenvolvida foi obtido a partir de caminhos metabólicos presentes no repositório Reactome que dis-ponibiliza uma lista de proteínas envolvidas para cada um dos caminhos metabólicos. A avaliação foi focada em três tipos de conjuntos de caminhos metabólicos humanos com anotações na ontologia de genes (GO) e/ou na ontologia de entidades químicas de interesse biológico (ChEBI): (1) Sem Ligação, ou seja, grupos distantes de caminhos me-tabólicos, sem qualquer ligação entre si; (2) Com Ligação, ou seja, diferentes grupos de caminhos metabólicos com uma ligação entre si e (3) Mesmo Grupo, ou seja, caminhos metabólicos pertences a um mesmo grupo de caminhos. Para cada conjunto foram efec-tuados oito testes, cada um deles com dezasseis tarefas de segmentação, com tamanhos de dados e números de segmentos alvo diversificados. A aplicação inclui dois algoritmos de segmentação, SimplekMeans e Farthest First, e foi testada com duas bem conhecidas medidas de semelhança semântica, a medida semântica de comparação directa de grupos de anotações por cada duas entidades SimGIC e a medida semântica de comparação indi-recta de grupos de anotações por cada duas entidades baseada na medida de comparação de pares de conceitos Lin com uma estratégia de agregação Média de Melhores Corres-pondências. Uma linha de base – referência para os resultados de segmentação tendo em vista capturar a influência da utilização de distâncias semânticas em contraponto às distâncias convencionalmente usadas em segmentação – foi estabelecida cujas anotações foram tratadas como palavras usando filtro disponibilizado pelo WEKA que converte um atributo de cadeia de caracteres num vector representativo das frequências de ocorrência de palavras. Tendo em conta o tipo (dos três atrás descritos) de conjunto de caminhos metabólico, o uso de semelhança semântica é claramente benéfico tanto para o tipo Sem
Ligação como para o tipo Com Ligação, com aumentos de desempenho que vão desde +3% a +11%. No que diz respeito ao conjunto Mesmo Grupo, a linha de base tem um desempenho em média melhor do que as abordagens baseadas em semelhança semântica. Os resultados usando ambas as ontologias ou apenas a GO revelam desempenhos muito semelhantes para as mesmas abordagens de segmentação e semelhança semântica, o que não acontece quando é usada unicamente a ontologia ChEBI. Uma pequena parte das proteínas usadas nos conjuntos de dados são anotadas com conceitos da ontologia ChEBI (apenas cerca de 5 a 10%) e a estrutura daquela ontologia é maioritariamente plana, com uma grande proporção de nodos folhas, o que se confirmou diminuir o impacto da utiliza-ção de medidas de semelhança semântica. Foi possível confirmar a conhecida tendência em algoritmos de segmentação baseados no k-Means para uma diminuição do desempe-nho da segmentação associada ao aumento do número alvo de segmentos e ainda, verificar que essa tendência se agrava consideravelmente se, com um elevado número de segmen-tos alvo, se conjugar um muito elevado número de instâncias a segmentar. Mostrou-se também que esta conjugação se revela, como seria de esperar, causadora de piores tem-pos de execução com a curiosidade de tal se verificar quando é usado o SimplekMeans mas não com o Farthest First. O primeiro foi, nas mesmas condições de teste, sempre mais lento que o segundo assim como a medida SimGIC foi sempre mais rápida do que a baseada na medida Lin.
Foi então possível demonstrar que a utilidade de empregar semelhança semântica de-pende não só da diversidade e qualidade das anotações existentes nos conjuntos de dados, mas também da estrutura das ontologia usadas e do grau em que as mesmas são capa-zes de acrescentar informação útil para identificar instâncias semelhantes. O presente trabalho constitui-se como um primeiro contributo que abre caminho a esforços futuros complementares em frentes diversas como, por exemplo: (1) Avaliar melhor as suas po-tencialidades com testes adicionais com diferentes combinações e números de ontologias usadas bem como diferentes fontes de dados; (2) Explorar algoritmos de segmentação, incluindo métodos de inicialização de centróides, alternativos; (3) Considerar medidas de semelhança semântica mais complexas e (4) Investigar aspectos relacionados com a efi-ciência computacional no uso de múltiplas ontologias. Em última análise, a abordagem proposta pode vir a ser usada para analisar conjuntos de dados diversos compostos tanto por anotações semânticas como por valores numéricos, através da sua combinação com as abordagens convencionais já disponíveis.
Palavras-chave: ontologia, semelhança semântica, segmentação, prospecção de dados.
Abstract
Many of the currently employed data mining techniques work in a blind mode, limit-ing themselves to what can be extracted directly from the data, without understandlimit-ing its meaning. It is, however, widely recognized that encoding more relations between objects increases the performance of data mining approaches. This typically involves the hand-crafting of rules that are able to express knowledge about how data objects relate to each other, but the emergence of semantic web technologies and their application in diverse domains is providing a wealth of data that is enriched with domain knowledge in the form of multiple ontologies.
The present work aims at addressing the challenge presented by this paradigm shift by integrating semantic similarity into machine learning algorithms to explore data using the knowledge contained in ontologies. A software application was developed that uti-lizes two state of the art libraries: The Semantic Measures Library (SML) for semantic similarity calculations and The Waikato Environment for Knowledge Analysis (WEKA) for machine learning algorithms. SML was further extended to allow the computation of semantic similarity using multiple ontologies.
The data-set used in the application’s evaluation was derived from the metabolic ways present in Reactome, which provides a list of involved proteins for each of the path-ways. The evaluation focused on three types of sets of human pathways with annotations to GO and ChEBI: (1) No Link, not linked pathways’ groups; (2) Link, pathways’ groups with one link and (3) Same Group, pathways in the same group. It was shown that the usefulness of employing semantic similarity depends not only on the diversity and quality of the data-sets annotations, but also on the structure of the ontologies employed, and the degree to which they are able to impart useful information to identify similar instances. Ultimately, the proposed approach can be used to analyze diverse data-sets composed of both semantic annotations and numerical values, by combining it with the conventional approaches already available.
Keywords: ontology, semantic similarity, clustering, knowledge discovery from data.
Contents
List of Figures xiii
List of Tables xv 1 Introduction 1 1.1 Motivation . . . 1 1.2 Goals . . . 3 1.3 Contributions . . . 3 1.4 Document Structure . . . 4
2 Related Work and State of the Art 5 2.1 Data Mining . . . 5
2.1.1 Clustering . . . 7
2.1.1.1 k-Means, a Centroid-Based Technique . . . 7
2.2 Machine Learning . . . 9
2.2.1 Data Mining Tools with Machine Learning Algorithms . . . 10
2.3 Semantic Web . . . 11
2.3.1 Semantic Similarity . . . 12
2.3.1.1 Software Tools for Calculating Semantic Similarity . . 15
2.4 Clustering with Ontologies . . . 15
3 Clustering with Semantic Based Distances 17 3.1 SESAME . . . 18
3.1.1 Semantic Data and Inputs . . . 19
3.1.2 Preprocessing . . . 20
3.1.3 SESAME’s GUI . . . 20
3.1.3.1 Alternative User Interface Options . . . 22
3.1.4 SESAME’s Core . . . 23
3.1.5 Clustering Algorithms . . . 24
3.1.5.1 Integrating SML into WEKA . . . 25
3.1.6 Semantic Distance . . . 25
3.1.7 Output . . . 26 xi
4 Semantic Similarity with Multiple Ontologies 29
4.1 Handling Multiple Ontologies in SESAME . . . 30
4.2 Extending SML to handle multiple ontologies . . . 31
5 Evaluation 33 5.1 Chosen Data Sources . . . 33
5.1.1 Gene Ontology . . . 34
5.1.2 Chemical Entities of Biological Interest Ontology . . . 37
5.2 Baseline . . . 38
5.3 Setup . . . 39
5.4 Results and Discussion . . . 41
5.4.1 Annotations Completeness . . . 47 5.4.2 Case Study . . . 50 6 Conclusions 53 6.1 Future Work . . . 54 Acronyms 55 Bibliography 57 xii
List of Figures
1 Data mining as a step in the process of knowledge discovery . . . 6
2 The k-means partitioning algorithm . . . 8
3 Clustering of a set of objects using the k-means method . . . 9
4 Schematic representation of the software solution’s global framework . . 17
5 SESAME’s components . . . 18
6 SESAME’s GUI . . . 21
7 GenericPropertiesCreator.propsfile’s lines including SESAME’s packages 23 8 SESAME’s source code excerpt . . . 24
9 SESAME’s code lines defining the ontology and annotation formats and loading them to a graph . . . 30
10 Root and first layer of hyper-graph containing GO and ChEBI graphs . . . 31
11 Part of GO graph including protein Q6A162 annotations . . . 36
12 Fragment of ChEBI Ontology . . . 38
13 Correctly clustered instances per number of clusters . . . 42
14 Correctly clustered instances per number of proteins . . . 43
15 Correctly clustered instances per pathways set tests . . . 44
16 Clustering time per clusterer plus semantic measure configurations sepa-rated by tested numbers of target clusters . . . 45
17 Average percentage of correctly clustered instances and average number of protein annotations to GO per tests by pathways set . . . 47
18 Average percentage of correctly clustered instances and average number of protein annotations to ChEBI per tests by pathways set . . . 48
19 GO and ChEBI contributions . . . 49
20 Percentage of correctly clustered instances for all the tasks of the two SESAME’s tests characterized in table 9 . . . 51
List of Tables
1 Summary of term semantic similarity measures . . . 13
2 Example of an input file’s content, instances to cluster . . . 19
3 Example of output confusion matrix . . . 27
4 Example of a summary table . . . 27
5 Example of ChEBI protein annotations obtained from UniProt provided protein’s Cofactor annotations . . . 34
6 Example of a baseline input file’s content . . . 39
7 Tests characteristics . . . 40
8 Overview of clustering results using the two ontologies . . . 41
9 Characteristics of two tests with substantially different average percent-age of correctly clustered instances results for similar number of proteins and the same number of target clusters . . . 50
Chapter 1
Introduction
During the past three decades the techniques to process and analyze data have been a subject of intense research and development. Their improvement during this period has been amazing and motivated by several factors among which two must be underlined:
• The increasing acknowledgment of data harnessing importance in all sectors, from leisure to economics passing through management, sciences, defense or even poli-tics;
• The necessity to effectively and efficiently analyze huge volumes of data accumu-lated in emerging internet-based global information such as the world wide web and various kinds of interconnected, heterogeneous databases.
The present work is part of the mentioned research efforts in this case driven by the intention to contribute to the improvement of data mining techniques particularly those concerning the semantic web. The project specifically aims to explore concepts and enti-ties’ semantic similarity calculation as support to the data mining technique of clustering instances according to their degree of similarity.
1.1
Motivation
Although phenomenally successful in terms of size and number of users, a world wide web which content consists mainly of distributed hypertext and hypermedia accessed via a combination of keyword based search and link navigation is fundamentally a relatively simple artifact. This simplicity has been one of its great strengths favoring popularity and growth since even naive users are able to use it and can even create their own content. However, the explosion in both the range and quantity of web content has highlighted some serious shortcomings in the hypertext paradigm: the required content becomes increasingly difficult to locate using search and browse and answering more complex queries – along with more general information retrieval, integration, sharing and pro-cessing – can be difficult or even impossible [1]. Nowadays, a paradigm-shift is being
Chapter 1. Introduction 2
witnessed. With the ultimate goal of allowing data to be shared effectively by wider com-munities and to be processed automatically by tools as well as manually, semantic web and its technologies are empowering the access to background knowledge – once scarce and difficult to explore – in the form of ontologies and more and more data are being released as linked data.
The computer science field of data mining – the process of discovering interesting pat-terns and knowledge from large amounts of data – is inseparable from these developments, particularly web content, structure and usages mining [2]. Similar relevance is assumed by machine learning, a branch of artificial intelligence in which, using computing, sys-tems are designed that can learn from data in a manner of being trained. These syssys-tems may learn and improve with experience, and with time, refine a model that can be used to predict outcomes of questions based on the previous learning [3]. A recent leap in data mining and machine learning has been the emergence of deep learning [4]. These tech-niques have greatly improved performance on a number of unsupervised learning tasks, however, as many of the previous techniques they work in a blind mode, limiting them-selves to what can be extracted directly from the data, without understanding its meaning, mostly leaving interpretation of the results to human experts [5].
It is widely recognized that encoding more relations between objects increases the performance of data mining approaches [6]. This typically involves the handcrafting of rules that are able to express knowledge about how data objects relate to each other, but the emergence of semantic web technologies and their application in diverse domains such as life sciences, astronomy or geography, is providing multiple ontologies with data that is enriched with domain knowledge. This panorama presents unique opportunities in combining the power of data mining and machine learning approaches with the knowl-edge encoded in ontologies. In particular, data-sets annotated with multiple ontologies are becoming increasingly common, for instance, proteins whose function is described using the Gene Ontology (GO) [7], ligands using the ontology for Chemical Entities of Biological Interest (ChEBI) [8] and phenotypic effects using the Human Phenotype On-tology [9] or electronic health records which use different terminologies and ontologies to describe diagnostics, symptoms and medical procedures.
The present work aims at addressing the challenge presented by the aforementioned paradigm shift by developing novel approaches for knowledge discovery that leverage on semantic web technologies and the abundance of knowledge made available through them. Semantics enriched data can be explored by the design and development of data mining algorithms that are able to make use of the background knowledge expressed in data ontology annotations in tandem with the information imparted by the data val-ues. In this context semantic similarity emerges as a possible avenue to bridge the two worlds, since it can be used to produce a measure of distance between two ontology con-cepts or two entities annotated with ontology concept sets. Considering that distance is
Chapter 1. Introduction 3
a cornerstone of a number of machine learning approaches, including several clustering approaches (e.g., k-means, farthest-first, etc.) where only semantics unaware distance measures like Euclidean, Manhattan or Chebyshev keep on being used, the integration of semantic similarity into state of the art machine learning algorithms provides a way to explore data using the knowledge contained in ontologies. Despite its unquestionable usefulness, robust measurement of semantic similarity aiming for automatically assess-ing a numerical score between a pair of terms accordassess-ing to the semantic evidence ob-served in knowledge sources (used as semantic background) remains a challenging and motivating task [10]. Particularly in the case of using multiple ontologies as semantics’ sources because these approaches provide complementary views of reality so that the in-completeness, errors and subjective interpretations, usual in single ontology approaches, are mitigated [11]. Numerous communities like, for instance, bioinformatics, natural lan-guage processing or artificial intelligence are involved in the study of semantic similarity measures.
This work’s final purpose is to, more than harnessing the power of the semantic web in a data mining context, to do so in a manner that can be easily used by other researchers or analysts to extract valuable knowledge from their data. A popular machine learning suite was integrated with a state of the art library for semantic similarity, which has been ex-tended to handle multiple ontologies. The integrated system has been subject to a primary evaluation using a data-set of proteins annotated with multiple ontologies.
1.2
Goals
This research project’s global goals are:
1. Develop new clustering strategies based on the exploration of the semantic space making use of semantic similarity measures;
2. Implement those strategies in integration with a data mining library; 3. Assessment of those strategies using real data.
1.3
Contributions
1. Integration of semantic similarity measures into the popular data mining framework WEKA;
2. Extension of state of the art semantic measures library to handle multiple ontolo-gies;
3. Providing preliminary test’s results of the developed software solution for clustering with semantic similarity based on multiple ontologies;
Chapter 1. Introduction 4
4. Release of the implemented software on github.
1.4
Document Structure
This document is organized in the following way:
• Chapter 1, Introduction, where the motivation, goals and contributions are outlined; • Chapter 2, Related Work and State of the Art, introduces some of the most rele-vant documented work concerning the context of continuous scientific research and development in the areas of data mining, machine learning and semantic similarity; • Chapter 3, Clustering with Semantic Based Distances, describes the requirements, design and implementation strategies undertaken to achieve the integration of se-mantic similarity distance into clustering algorithms.
• Chapter 4, Semantic Similarity with Multiple Ontologies, characterizes the pos-sible scenarios to compute semantic similarity using multiple ontologies, and the specificities of their exploration in the developed software solution;
• Chapter 5, Evaluation, provides a detailed description of the procedures adopted to test the developed application and discussion of those tests main results;
• Chapter 6, Conclusion, presents the major conclusions and possible directions for future work.
Chapter 2
Related Work and State of the Art
This work involved three important information technology research fields associated to the process of Knowledge Discovery from Data (KDD), ie, the automated or con-venient extraction of patterns representing knowledge implicitly stored or captured in large databases, data warehouses, the web, other massive information repositories or data streams [12]: data mining, machine learning and semantic similarity. All of these ar-eas are continuously suffering scientific research and development which constitutes a favorable context and contribute to new achievements in data mining based on semantic similarity itself. In this chapter some of the most relevant documented work concerning the aforementioned context is identified.
2.1
Data Mining
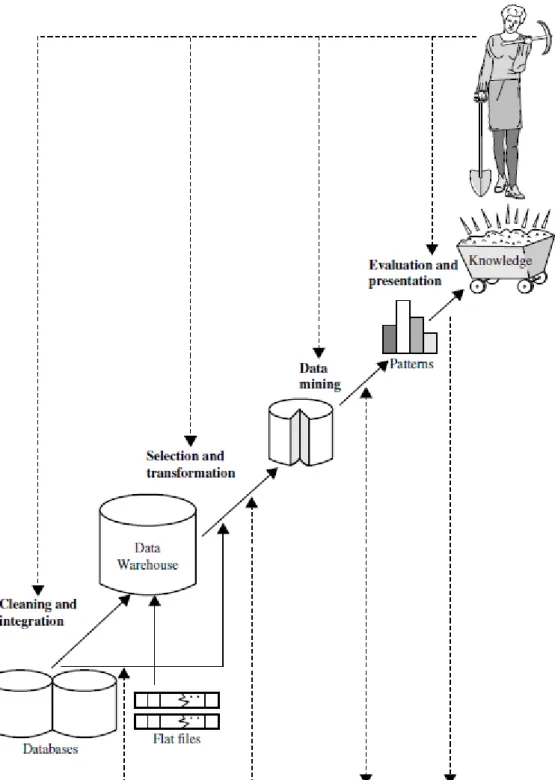
Being a truly interdisciplinary subject, data mining can be defined in many different ways, figure 1, for instance, illustrates it as a step in the process of KDD shown as an iterative sequence of [12]:
1. Data cleaning – to remove noise and inconsistent data;
2. Data integration – where multiple data sources may be combined;
3. Data selection – where data relevant to the analysis task are retrieved from the database;
4. Data transformation – where data are transformed and consolidated into forms ap-propriate for mining by performing summary or aggregation operations;
5. Data mining – an essential process where intelligent methods are applied to extract data patterns;
6. Pattern evaluation – to identify the truly interesting patterns representing knowledge based on interestingness measures;
Chapter 2. Related Work and State of the Art 6
Figure 1: Data mining as a step in the process of knowledge discovery.
7. Knowledge presentation – where visualization and knowledge representation tech-niques are used to present mined knowledge to users.
However, in industry, in media and in the research milieu, the designation data mining is often used to refer to the entire knowledge discovery process (perhaps because it is shorter than KDD). Therefore, it seems appropriate to adopt a broad view of data mining
Chapter 2. Related Work and State of the Art 7
functionality defining it as the process of discovering interesting patterns and knowledge from large amounts of data.
2.1.1
Clustering
In this work clustering analysis was the main data mining functionality adopted and was applied to ontology data. It is a fundamental technique in unsupervised learning, since it is able to discover the natural groupings of a set of unlabelled objects. It can be applied to a number of tasks including natural classification (of objects into classes), understand-ing the underlyunderstand-ing structure of data, to support for instance anomaly detection, and as a method for compressing and summarizing data [13].
The clustering method k-means is the base of the clustering algorithms used in the present work. It is one of the most well-known and commonly used methods of the simplest and most fundamental version of cluster analysis, partitioning. These methods organize the objects of a set into several exclusive groups or clusters being the number of target clusters – starting point parameter for partitioning methods – given.
Formally, given a data-set, D, of n objects, and k, the number of clusters to form, a partitioning algorithm organizes the objects into k partitions (k ≤ n), where each par-tition represents a cluster. The clusters are formed to optimize an objective parpar-titioning criterion, such as a dissimilarity function based on distance, so that the objects within a cluster are "similar" to one another and "dissimilar" to objects in other clusters in terms of the data-set attributes [12].
2.1.1.1 k-Means, a Centroid-Based Technique
This is a centroid-based partitioning technique. It uses the centroid of a cluster, Ci, to
represent that cluster. Conceptually, the centroid of a cluster is its center point. The centroid can be defined in various ways such as by the mean or medoid of the objects (or points) assigned to the cluster. The difference between an object p ∈ Ci and ci, the
representative of the cluster, is measured by dist(p, ci), where dist(x, y) is the Euclidean
distance between two points x and y. The quality of cluster Ci can be measured by the
within-cluster variation, which is the sum of squared error between all objects in Ci and
the centroid ci, defined as
E = k X i=1 X p∈Ci dist(p, ci)2
where E is the sum of the squared error for all objects in the data set. In other words, for each object in each cluster, the distance from the object to its cluster center is squared, and the distances are summed. This objective function tries to make the resulting k clusters as compact and as separate as possible.
Chapter 2. Related Work and State of the Art 8
Optimizing the within-cluster variation is computationally challenging. In the worst case, it would be necessary to enumerate a number of possible partitionings that are ex-ponential to the number of clusters, and check the within-cluster variation values. It has been shown that the problem is NP-hard in general Euclidean space even for two clusters (i.e., k = 2). Moreover, the problem is NP-hard for a general number of clusters k even in the 2-D Euclidean space. If the number of clusters k and the dimensionality of the space d are fixed, the problem can be solved in time O(ndk+1log n), where n is the number of objects. To overcome the prohibitive computational cost for the exact solution, greedy approaches are often used in practice. A prime example is the k-means algorithm, which is simple and commonly used.
Figure 2: The k-means partitioning algorithm.
The k-means algorithm defines the centroid of a cluster as the mean value of the points within the cluster. It proceeds as follows. First, it randomly selects k of the objects in data set D, each of which initially represents a cluster mean or center. For each of the remain-ing objects, an object is assigned to the cluster to which it is the most similar, based on the Euclidean distance between the object and the cluster mean. The k-means algorithm then iteratively improves the within-cluster variation. For each cluster, it computes the new mean using the objects assigned to the cluster in the previous iteration. All the objects are then reassigned using the updated means as the new cluster centers. The iterations continue until the assignment is stable, that is, the clusters formed in the current round are the same as those formed in the previous round. The k-means procedure is summarized in figure 2 [12].
Chapter 2. Related Work and State of the Art 9
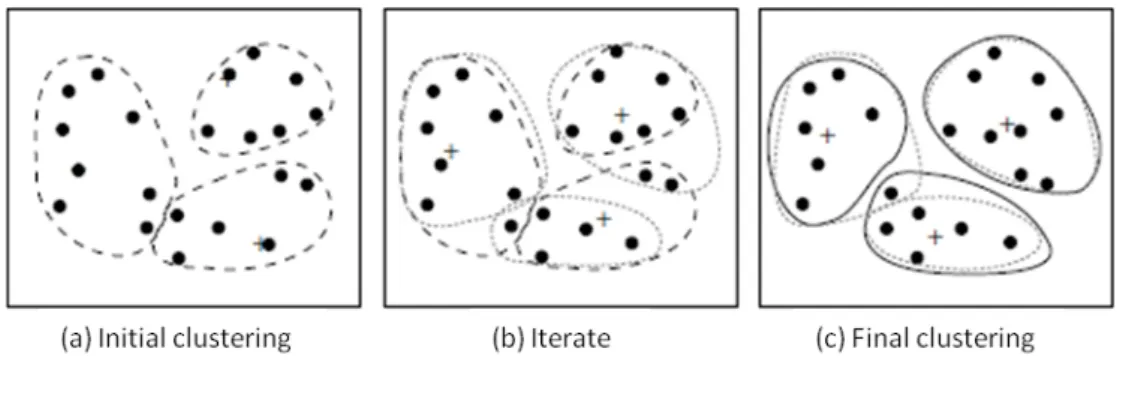
Example of Clustering by k-Means Partitioning Considering a set of objects located in 2-D space, as depicted in figure 3(a). Let k = 3, that is, the user would like the objects to be partitioned into three clusters.
According to the algorithm in figure 2, we arbitrarily choose three objects as the three initial cluster centers, where cluster centers are marked by a +. Each object is assigned to a cluster based on the cluster center to which it is the nearest. Such a distribution forms silhouettes encircled by dotted curves, as shown in figure 3(a).
Figure 3: Clustering of a set of objects using the k-means method; for (b) update cluster centers and reassign objects accordingly (the mean of each cluster is marked by a +).
Next, the cluster centers are updated. That is, the mean value of each cluster is re-calculated based on the current objects in the cluster. Using the new cluster centers, the objects are redistributed to the clusters based on which cluster center is the nearest. Such a redistribution forms new silhouettes encircled by dashed curves, as shown in figure 3(b). This process iterates, leading to figure 3(c). The process of iteratively reassigning objects to clusters to improve the partitioning is referred to as iterative relocation. Even-tually, no reassignment of the objects in any cluster occurs and so the process terminates. The resulting clusters are returned by the clustering process [12].
2.2
Machine Learning
How can we build computer systems that automatically improve with experience, and what are the fundamental laws that govern all learning processes [14]? Tom M. Mitchell defines this as the central question studied by machine learning. Since 1985, when there were almost no commercial applications, until now a huge progress is said to have oc-curred in machine learning and that it can be measured by its significant real-world appli-cations which include: speech recognition, computer vision, bio-surveillance and robot control. The field’s methods are identified as being the best available for developing par-ticular types of software, namely where the application: is too complex for people to manually design the algorithm or requires that the software customize to its operational environment after it is fielded. Another role of machine learning is stressed by the author,
Chapter 2. Related Work and State of the Art 10
its potential to reshape the way Computer Science is viewed by shifting the question from how to program computers to how to allow them to program themselves emphasizing the design of self monitoring systems that self-diagnose and self-repair, and approaches that model their users and take advantage of the steady stream of data flowing through the program rather than simply processing it. Substantial progress is suggested to have already been made in the development of machine learning algorithms and their under-lying theory. For instance, there are a variety of algorithms for supervised learning of classification and regression functions, i.e., for learning some initially unknown function f : X → Y given a set of labeled training examples {(xi, yi)} of inputs xi and outputs
yi = f (xi). There are, of course, many other types of learning problems and associated
algorithms like the one most relevant to the present work, unsupervised clustering (e.g., cluster genes based on their time series expression patterns), and others like anomaly detection, reinforcement learning or data modeling.
Machine learning algorithms play a very important role in data mining processes since these require techniques for finding and describing structural patterns in data, as a tool for helping to explain that data and make predictions from it [15].
2.2.1
Data Mining Tools with Machine Learning Algorithms
In a recent poll regarding the use of data mining tools in real projects, it is interesting to observe that in the top five there is only one commercial tool: Excel. The domination of free tools probably stems from the maturity and availability of a large number of machine learning algorithm implementations [16]. The most popular freely available data mining tools that have grown more efficient and useful over the years, some even comparable or better in certain aspects than their commercial counterparts, include:
• Waikato Environment for Knowledge Analysis (WEKA) – Java based, open source data mining platform developed at the University of Waikato, New Zealand. Has had mostly stable popularity over the years, which is mainly due to its user friend-liness and the availability of a large number of implemented algorithms. It is still not as popular as other tools, both in business and academic circles, mostly be-cause of some slow and more resource demanding implementations of data mining algorithms. It is still quite powerful and versatile [17].
• R – This open-source tool and programming language of choice for statisticians is also a strong option for data mining tasks. The source code is written in C++, For-tran, and in R itself. It is an interpreted language and is mostly optimized for matrix based calculations, comparable in performance to commercially available Matlab. Offers very fast implementations of many machine learning algorithms, compara-ble in number to WEKA (from which a large number of algorithms is borrowed), and also the full prospect of statistical data visualization methods [18].
Chapter 2. Related Work and State of the Art 11
• Konstanz Information Miner (KNIME) – A general purpose tool based on the Eclipse platform. It is open-source, though commercial licenses exist for com-panies requiring professional technical support. According to the official website, it is used by over three thousand organizations in more than sixty countries, and there seems to be a considerable community support. One of the greatest strengths of KNIME is the integration with WEKA and R. Although extensions have to be installed to enable the integration, the installation itself is trivial [19].
• scikit-learn – A free package in Python that extends the functionality of NumPy and SciPy packages with numerous data mining algorithms. It also uses the mat-plotlib package for plotting charts. The package keeps improving by accepting valuable contributions from many contributors. One of its main strong points is a well written online documentation for all of the implemented algorithms. Well written documentation is a requirement for any contributor and is valued more than a lot of poorly documented algorithm implementations [20].
2.3
Semantic Web
Nowadays the availability of electronic resources is permanently increasing making their organization and efficient access difficult. The semantic web initiative is precisely about adding formal structures and semantics (meta-data and knowledge) to web content for easy management and access. To make resources machine-understandable, it proposes in particular to enrich them with descriptions called annotations [21]. The concept anno-tation is defined in the oxford dictionary as "a note by way of explanation or comment added to a text or diagram". Besides this basic meaning, a semantic annotation (also called conceptual annotation) has two more important features: machines can read and process it and contains a set of formal and shared terms for a certain domain. A semantic annotation provides formal meaning to the data object, in a machine readable format, typ-ically in the form of an attribution of a class Internationalized Resource Identifier (IRI) to an entity [22]. For instance, the human protein for hemoglobin can be described as having the molecular function "oxygen binding" (http://purl.obolibrary.org/obo/GO_0019825).
Semantic annotations use formal knowledge to capture annotator’s knowledge and then act as a knowledge carrier to enrich annotated object’s semantics [22]. The used formal knowledge may assume the form of an ontology which, in its classical sense is a philosophical discipline, a branch of philosophy that deals with the nature and the orga-nization of being, but in computer science it refers to an engineering artifact, describing a formal, shared conceptualization of a particular domain of interest [23]. The three main components of an ontology are:
• Classes (or concepts) – Provide the abstraction mechanism for grouping resources with similar characteristics. Classes have an intentional meaning (their underlying
Chapter 2. Related Work and State of the Art 12
concept) which is related but not equal to their extension (the instances that com-pose the class). Classes are typically identified by a unique code in the form of an IRI;
• Relations – An ontology relation is a binary relation established between classes (or concepts) like, for instance, class-subclass or part-whole;
• Instances (or individuals) – Are individual objects, each pertaining to a domain. Ontologies are usually represented by labeled graphs where nodes represent the classes and edges the relations between them [24].
2.3.1
Semantic Similarity
As mentioned before, every data mining functionality depends on some kind of dis-tance/similarity measuring between data instances. This work focused on exploring data semantics using semantic similarity measures so the following definitions of commonly used expressions are important:
• Semantic relatedness – Strength of the semantic interactions between two elements without restriction regarding the types of semantic links considered;
• Semantic similarity – Specializes the notion of semantic relatedness, by only con-sidering taxonomical relationships in the evaluation of the semantic strength be-tween two elements;
• Semantic distance – Generally considered as the inverse of semantic relatedness, all semantic interactions between the compared elements are considered.
In other words, semantic similarity measures compare elements regarding the properties they share and the properties which are specific to them [25]. Table 1 shows a quite up-dated summary of term semantic similarity measures — information content (IC), max-imum informative common ancestor (MICA), all common ancestors (ACA) and vector space models (VSM) are used acronyms. It was extracted from an important work where an updated overview of term semantic similarity measures as well as their assessment and comparison is made.
Pairwise measures are those quantifying the similarity of two terms, whereas measures able to describe the relatedness of two sets of terms, yielding a global similarity of sets, are referred to as groupwise measures [57]. Lin [45] is an example of a pairwise node-based semantic similarity measure, it measures the similarity between two terms c1 and
c2 as:
simLin(c1, c2) =
2 × IC(cM ICA)
Chapter 2. Related Work and State of the Art 13
Type Name Ref. Term
IC
MICA ACA Path Length
Term Depth
VSM
Groupwise
Ali and Deane [26] 5 3 5 5 5 5
Cho [27] 3 3 5 5 5 5 Cosine [28] 5 5 5 5 5 3 Czekanowski-Dice [29] 5 5 3 5 5 5 Dice [28] 5 5 3 5 5 5 FMS [30] 3 5 5 5 5 5 IntelliGO [31] 3 3 5 3 3 3 Jaccard [28] 5 5 3 5 5 5 Kappa statistics [32] 5 5 3 5 5 5 NTO [33] 5 5 3 5 5 5 PL [34] 5 5 5 3 5 5 simGIC [35] 3 5 3 5 5 5 simLP [36] 5 3 5 5 3 5 simNLP [37] 5 3 5 5 3 5 simUI [36] 5 5 3 5 5 5
SSA [38] 3 3 Depends on measure used
TO [39] 5 5 3 5 5 5 TAS [40] 5 3 5 5 5 5 Weighted cosine [41] 3 5 5 5 5 3 WJ [28] 3 5 3 5 5 5 Pairwise Annotation cosine [42] 5 5 5 5 5 3 G-SESAME [32] 5 5 3 3 5 5 GraSM [43] 3 3 5 5 5 5
Jiang and Conrath [44] 3 3 5 5 5 5
Lin [45] 3 3 5 5 5 5 Othman [46] 3 3 5 3 3 5 PS or PK-TS [47] 5 3 5 3 3 5 Resnik [48] 3 3 5 5 5 5 RSS [49] 5 3 5 3 3 5 SB-TS [50] 5 5 5 5 3 5 simIC [51] 3 3 5 5 5 5 simRel [52] 3 3 5 5 5 5 SSM [53] 3 3 5 3 3 5 TCSS [54] 3 3 5 5 5 5 Wu [30] 5 5 3 5 5 5 Wu-Palmer [55] 5 3 5 3 3 5
XOA [56] Depends on measure used 3
Columns Term IC, Some common ancestors (MICA), All common ancestors, Path length, Term depth and VSM refer to the features of the measures described in the text. NTO, normalized term overlap; PL, path length; PS or PK-TS, pekar-staab term similarity; SSA, semantic similarity of annotations; TO, term overlap; TAS, total ancestry similarity; WJ, weighted Jaccard; XOA, cross ontological analysis.
Chapter 2. Related Work and State of the Art 14
On the other hand, simGIC (GIC standing for graph information content) [35] is an example of a groupwise graph-based semantic similarity measure in which each term is weighted by its IC. It was developed to explore gene ontology (for annotating gene products) terms, being A and B two proteins with terms t, it is given by:
simGIC(A, B) = P
t∈A∩BIC(t)
P
t∈A∪BIC(t)
The IC of a concept provides an estimation of its degree of generality/concreteness, a dimension which enables a better understanding of concept’s semantics. As a result, IC has been successfully applied to the automatic assessment of the semantic similarity between concepts. Sánchez [58] proposed a new intrinsic IC computational model where the IC of a concept c is defined as:
IC(c) = −log
|leaves(c)| |subsumers(c)| + 1
max_leaves + 1 !
Where leaves(c) and subsumers(c) contain, respectively, the taxonomical concepts above and bellow the concept c and max_leaves represents the number of leaves corresponding to the root node of the hierarchy.
Semantic similarity measures can be used to compute the similarity between data annotated with ontologies [59]. These measures are able to compare ontology classes or entities annotated with ontology classes and return a numerical value reflecting their closeness in meaning. Many measures make use of the concept of information content, which describes how meaningful an ontology class is either based on structural properties, corpora usage or a combination of both.
Several semantic similarity measures have been proposed in the last decade, and more recently there have been efforts in extending these measures to work for entities annotated with multiple ontologies. The exploitation of multiple ontologies provides additional knowledge that can improve the similarity estimation and solve cases in which terms are not represented in an individual ontology. This is especially interesting in domains such as the biomedical one, in which several big and detailed ontologies are available, offering overlapping and complementary knowledge about the same topics [60].
While presenting semantic similarity calculation improvement opportunities the use of multiple ontologies also poses new issues. For instance, some concepts related to a concept in a given ontology may not be seen in that ontology however, these related concepts exist in other ontologies. The issue that stands out here is that the ontologies have different granularity degrees, and so, each ontology reflects a different similarity scale. For measuring cross-ontology similarity of concepts, variables like the granularity of ontologies must be taken into account [61].
Chapter 2. Related Work and State of the Art 15
2.3.1.1 Software Tools for Calculating Semantic Similarity
A natural demand in research is the development of software tools that implement avail-able methods for calculating semantic similarity of terms in an ontology and that of enti-ties annotated with an ontology. So far, there have been quite a few such software tools available, with examples including, among many others:
• SimPack – A framework of similarity measures adapted to the use in ontologies. It offers a variety of different semantic similarity measures, is generic, i.e., it can be applied to different data structures given the existence of appropriate data assessors and, it is implemented in Java, thus portable [62];
• seGOsa – User-friendly cross-platform system to support large-scale assessment of GO driven similarity among gene products. Using information-theoretic ap-proaches, the system exploits both topological features of the GO and statistical features of the model organism databases annotated to GO to assess semantic simi-larity among gene products [63];
• DOSim – R-based software package to compute the similarity between diseases and to measure the similarity between human genes in terms of diseases. It incor-porates an enrichment analysis function based on the disease ontology and uses this function to explore the disease feature of an independent gene set [63];
• Semantic Measures Library (SML) – To date the most complete on this area. It is a generic (i.e., not domain-specific) and open source Java library and command line software dedicated to the computation and analysis of knowledge-based semantic measures. It can be used to compare a pair of concepts or two groups of concepts defined in a semantic graph and supports various types of formats and languages used to express knowledge representations, e.g., Resource Description Framework (RDF), Open Biomedical Ontologies (OBO) and Web Ontology Language (OWL) [25].
2.4
Clustering with Ontologies
Several clustering techniques rely on the definition of a distance metric, which is used by the clustering algorithms to find the best possible groupings. Typical distance metrics operate over numerical data (e.g. Euclidian, Manhattan) or categorical data (e.g., Maha-lanobis), but are unable to handle the semantic content of data objects to perceive their similarity. For instance, imagine the following scenario, where there are three patients (A, B and C):
Chapter 2. Related Work and State of the Art 16
• B with insulin resistance; • C with estrogen resistance.
Each patient is thus described by their diagnosis. Using a typical categorical distance, all patients are equally distant. Using a string similarity based distance, B and C are more closely related. However, medically speaking, A and B are actually much more similar, since insulin resistance is a precursor to the development of Type II diabetes. This kind of similarity can be captured by using ontologies, since they model the concepts and relations in a given domain.
Some existing works employ ontology-based clustering. Maedche et al. [23] pro-posed an approach based on hierarchical clustering using similarities between ontology instances along three dimensions: taxonomy, relation and attribute similarity. The authors carried out an empirical evaluation due to the lack of ontological background knowledge. Another relevant related work presents a complementary approach to pure hierarchical clustering making use of the classification hierarchy common to ontologies. Ontologies encoded in an extended form of RDF/RDFS are combined with an established hierarchi-cal clustering system to achieve results that, on one hand hold promise for applications of dictionary-based ontologies in information retrieval tasks and, on the other hand, raise an important question: how to quantify the significance of ontological clustering beyond the similar effects of the meta-word search? The results establish a baseline in which hi-erarchical clustering using ontologies is at least as good as meta-word search [64]. More recently, an approach that combines semantic similarity of variables with hierarchical clustering has been shown to produce good results on a set of linguistic benchmarks [65]. These works all share two limitations, they provide tailored semantic similarity measures, preventing their easy adaptation to other domains that may well necessitate a different metric, and moreover, they only work using a single ontology.
Chapter 3
Clustering with Semantic Based
Distances
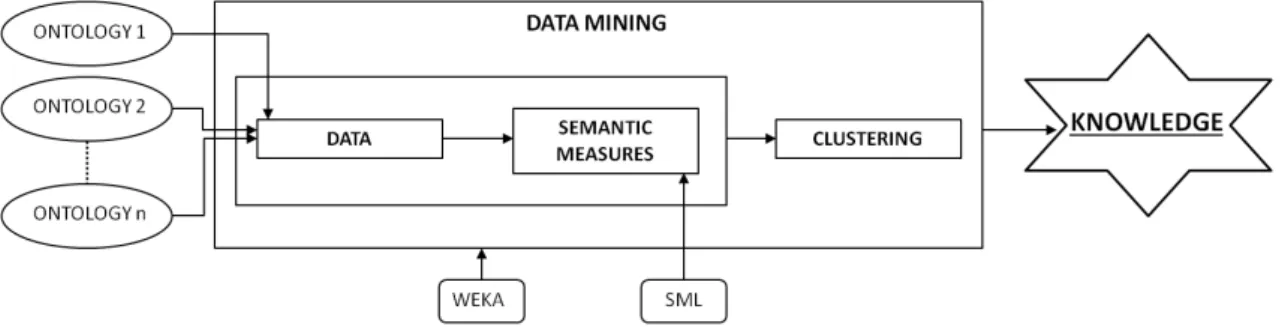
The purpose of this work is to extend typical distance-based clustering approaches with semantic distance. The overall framework consists in allowing the computation of seman-tic distances for data annotated with multiple ontologies, which are then used as distance values for clustering approaches. Figure 4 schematically represents the global framework, challenges and expected achievements. The goal is a system from which knowledge can be extracted using semantic information from more than one ontology to implement clus-tering based on semantic distances. There were a few requirements concerning the
soft-Figure 4: Schematic representation of the software solution’s global framework. ware libraries to be used on the system’s development, they should be:
• Free, open source;
• State of the art references;
• Easy to integrate with each other; • Extensible;
• Very well documented.
In line with these requirements, the resulting implementation utilizes the two following libraries:
Chapter 3. Clustering with Semantic Based Distances 18
• WEKA for machine learning algorithms – Considered a landmark system, widely adopted by machine learning and data mining communities as an educational tool and also widely used in commercial settings. Its main features are, in summary, data preprocessing, classification, clustering, attribute selection and data visualization; • SML for semantic similarity calculations – It is, from several available software
so-lutions for the computation of knowledge-based measures (type of semantic mea-sures adequate to the intention to use ontologies as the form of knowledge repre-sentation from which to extract the semantics associated to the compared elements), the most complete. In this work, it was further extended to allow the computation of semantic similarity using multiple ontologies.
This software solution – designated SESAME as an invocation of the magical phrase from the story of "Ali Baba and the forty thieves", here in the sense that it aims to favor the integration of semantic space potential in data mining processes – was completely devel-oped using Java programming language in Eclipse Integrated Development Environment (IDE) with SML and WEKA Java libraries added in Java Archive (JAR) format.
3.1
SESAME
The components resulting from the software development efforts to create SESAME as a data mining application program for clustering based on semantic measures, are repre-sented in the diagram of figure 5.
Chapter 3. Clustering with Semantic Based Distances 19
3.1.1
Semantic Data and Inputs
SESAME takes two types of data, the variable inputs defined by the user for each appli-cation run and the semantic data files that must be constantly available in the same file system path as the application itself. The run specific, user defined inputs are:
• File in Comma-Separated Values (CSV) format, data.csv, having in its lines the instances to cluster, table 2 shows an example – the formation of these files requires yet another data source concerning the instances’ class assignments;
• Target number of clusters which must coincide with the number of different classes of instances in the corresponding input file (seven in the example shown in table 2);
Entry Chebi Class
http://SESAME/P60709 No SignalingbyEGFR http://SESAME/P63261 No SignalingbyEGFR http://SESAME/O14672 Yes SignalingbyEGFR http://SESAME/P46109 No SignalingbyPDGF http://SESAME/P09958 Yes SignalingbyPDGF http://SESAME/Q14451 No SignalingbyPDGF http://SESAME/P16333 No SignalingbyPDGF http://SESAME/P08559 Yes SignalingbyRetinoicAcid http://SESAME/P11177 Yes SignalingbyRetinoicAcid http://SESAME/O00330 No SignalingbyRetinoicAcid http://SESAME/Q15118 No SignalingbyRetinoicAcid http://SESAME/Q06187 Yes SignalingbyRhoGTPases http://SESAME/O43684 No SignalingbyRhoGTPases http://SESAME/P13498 No SignalingbyRhoGTPases http://SESAME/P04839 Yes SignalingbyRhoGTPases http://SESAME/P06756 No SignalingbyVEGF http://SESAME/P05771 Yes SignalingbyVEGF http://SESAME/Q05513 No SignalingbyVEGF http://SESAME/Q15759 Yes SignalingbyVEGF http://SESAME/Q9HCK8 No SignalingbyWnt http://SESAME/P18545 No SignalingbyWnt http://SESAME/P25963 No SignalingbyNGF http://SESAME/O14920 No SignalingbyNGF http://SESAME/P51617 Yes SignalingbyNGF http://SESAME/Q15418 Yes SignalingbyNGF
Table 2: Example of an input file’s content, instances to cluster. Entries are proteins identifiers in the semantic graph, the attribute Chebi just informs about the existence of ChEBI annotation and the attribute Class identifies each instance’s metabolic pathway.
Chapter 3. Clustering with Semantic Based Distances 20
• Clusterer – clustering algorithm option;
• Measurer – semantic measuring configuration, i.e. semantic measure plus graph loading combination option.
The necessary semantic data elements, used to load semantic graphs and calculate semantic distances according to user selected semantic measure plus graph loading com-bination, are:
• Ontologies in OBO format;
• Annotations files in Tab-Separated Values (TSV) format.
3.1.2
Preprocessing
This component concerns to what could be designated as logistic tasks: necessary prepa-rations before running the application when it is necessary to collect the desired data from the selected data sources and then:
• Prepare annotations files – Annotations files are produced by converting files ex-tracted from the chosen data sources to TSV. For each chosen ontology one file is necessary with a line per entity. Each line with two columns, one with the entity’s identifier and the other with its annotations with the corresponding ontology. These preparations are made only once for all runs corresponding to clustering tasks using the same ontologies.
• Prepare data.csv files – Files containing each a list of instances of a specific class are joined in a CSV formatted file. As shown in the example of table 2, each line of this file contains an instance having in a first column instances’ identifiers concate-nated with the string http://SESAME/ to form a proper Uniform Resource Identifier (URI), in a second (optional) column chosen verification information about the data and, in a third column, that instance’s class. In the process of creating these CSV files, there are no missing attribute values, instance repetitions are avoided and their annotations are checked using the annotations files (to avoid not annotated data ob-jects, which would result in runtime errors, and to know with which ontology each instance is annotated). SESAME converts these CSV files to WEKA’s Attribute-Relation File Format (ARFF) so they must also have a header line identifying each of the three columns of data.
3.1.3
SESAME’s GUI
The application includes a Graphical User Interface (GUI) to provide its users a kind of interface that is indispensable if not for the entire scientific community, at least for those
Chapter 3. Clustering with Semantic Based Distances 21
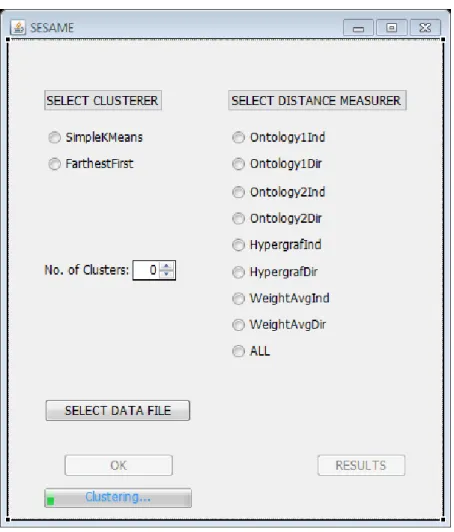
who dislike command line instructions or text-based interfaces. WEKA provides a GUI but this one is exclusively dedicated to SESAME’s functionalities therefore provides a more specific interaction not subject to WEKA’s version broader characteristics. It is based on WindowBuilder, a plug-in for Eclipse IDE which makes it very easy to create Java GUI applications without spending a lot of time writing code. Using a visual designer and layout tools simplifies adding controls using drag-and-drop, adding event handlers to those controls or changing various properties of controls using a property editor. The corresponding Java code is automatically generated. Figure 6 shows the created JFrame.
Figure 6: SESAME’s GUI.
The user must select a clusterer and a distance measurer (only one of each can be selected), the target number of clusters (less than 51 and if 0 a rule of thumb is used) and a data file (through a common file system navigator). Only then the OK button becomes available allowing to proceed to clustering. When OK is pressed and until the clustering ends a progress bar shows. Eventually, a button to visualize the TSV formatted results file in a spreadsheet is also made available. The distance measurer option ALL allows to run the application with the selected clusterer, number of target clusters, data file and all the available measurers.
Chapter 3. Clustering with Semantic Based Distances 22
3.1.3.1 Alternative User Interface Options
SESAME’s GUI is its only user interface that allows an unrestricted number of clustering tasks, with different options or not, to be run in the same application session. Users who consider this feature unimportant may chose one of the following interface options.
Command Line A simple text-based interface is provided if the application is run from command line without specifying the input parameters. This way the user makes clusterer, measurer and number of target clusters choices. The data file must be in the application’s path and be named "data.csv". To specify input parameters, the following sequence must be observed:
N [clusters #] -t [data file path] - A [measurer option] -C [clusterer option] In either possibility:
• The number of target clusters must be an integer in [0,50] (0 for a "rule of thumb" number of target clusters definition);
• The data file path must comply to windows operating system requirements;
• The available measurer options are 1 for Ontology1Ind, 2 for Ontology1Dir, 3 for Ontology2Ind, 4 for Ontology2Dir, 5 for HypergraphInd, 6 for HypergraphDir, 7 for WeightAvgInd and 8 for WeightAvgDir;
• The available clusterer options are 1 for adapted SimplekMeans and 2 for adapted Farthest First.
WEKA Explorer GUI The Explorer is an important component of WEKA that pro-vides a graphical environment from which users may configure and launch all the avail-able data mining options. One of WEKA’s most relevant strengths is its adaptability and extensibility and the explorer is not an exception.
As of version 3.4.4 it is possible for WEKA to dynamically discover classes at run-time. To enable or disable dynamic class discovery, the relevant file to edit is Gener-icPropertiesCreator.props(GPC) which can be obtained from the weka.jar archive. All that is required, is to change the UseDynamic property in this file from false to true (for enabling it) or the other way around (for disabling it). After being changed, the file must be placed in the home directory [66]. For the present work, this property was set to true and the system’s environment variable CLASSPATH (which tells Java where to look for classes) was configured to include WEKA and SML used libraries in JAR format as well as SESAME’s main class, MyFirstCluster, also in JAR format.
Chapter 3. Clustering with Semantic Based Distances 23
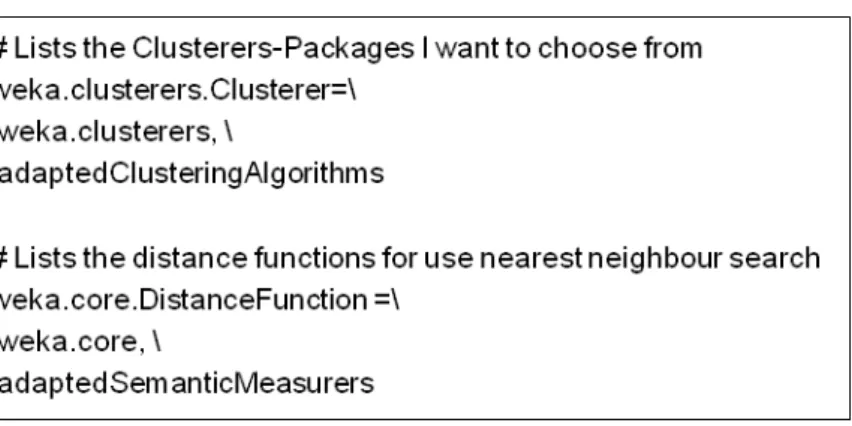
Since version 3.4.4, WEKA can also display multiple class hierarchies in its GUI which makes adding new functionalities quite easy. In the present work, adapted cluster-ers and distance functions were developed and located in packages adaptedClusteringAl-gorithmsand adaptedSemanticMeasurers, respectively. So, the file GPC add to be changed accordingly, as shown in figure 7.
Figure 7: GenericPropertiesCreator.props file’s lines including SESAME’s packages.
3.1.4
SESAME’s Core
This component is the application’s central hub. It receives the inputs, either from the GUI or command line, uses them to instruct clustering algorithms what to do and treats the results to produce an output file for each clustering task.
After some maintenance instructions, intended to control the flow of multiple clus-tering tasks in the same session (when the GUI is used), an output file name is defined reflecting the user’s input options. Next, the chosen CSV format data file is loaded, con-verted to ARFF and only then used to set the data instances.
At this point, concrete clustering procedures are initiated by setting: • The clustering algorithm;
• The semantic measuring configuration; • The target number of clusters;
• The seed value – Used to initialize the random number generator. k-Means based clusterers like SimplekMeans and Farthest First set initial cluster’s centroids by randomly selecting instances from the data. In SESAME, 42 is defined as the seed value;
• The option not to replace missing values – Used to set the replacement of all missing values for nominal and numeric attributes with the modes and means of the data. In SESAME it is set to true because the data is supposed to have no missing values.
Chapter 3. Clustering with Semantic Based Distances 24
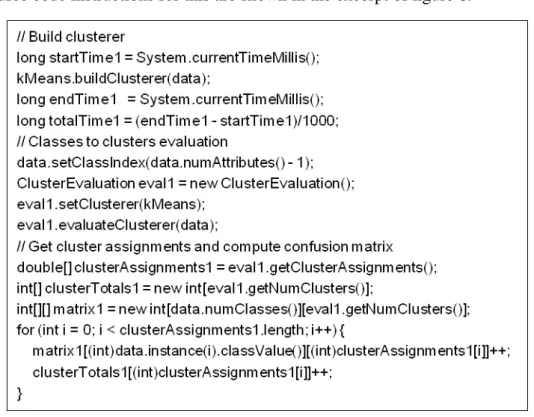
Finally the clusterer is built, the build time counted and clustering evaluation can then be made as well as a consequent gathering of results’ information like:
• Clustering assignments and confusion matrix;
• Statistics (clustering time, percentage and number of incorrectly clustered instances and percentage and number of instances per cluster);
• Classes assigned to clusters.
The source code instructions for this are shown in the excerpt of figure 8.
Figure 8: SESAME’s source code excerpt.
The last step of this component consists on registering all the computed clustering tasks’ results in an output file.
3.1.5
Clustering Algorithms
Due to their distance based nature, suitable to the problem at hand, two of WEKA’s clus-tering algorithms, identified as adaptation-prone, were selected for integration of semantic distance measuring options [67]:
• SimplekMeans – clusters data using k-means, a method which aims to partition n observations into k clusters in which each observation belongs to the cluster with the nearest mean;
• Farthest First – a variant of k-means that places each cluster center, in turn, at the point (within the data area) farthest from the existing cluster centers.
Chapter 3. Clustering with Semantic Based Distances 25
3.1.5.1 Integrating SML into WEKA
SML provides the means to calculate semantic similarity values, bounded in [0, 1], be-tween pairs of ontology concepts or entities annotated with ontology concepts. Being normalized, these semantic similarity (sim) values, between two data instances (entaand
entb) can be converted to semantic distances (dist) using the relation:
dist(enta, entb) = 1 − sim(enta, entb)
To implement clustering based on semantic measures these semantic distances must be made available to distance based clustering algorithms the same way conventionally used distance metrics are. WEKA provides a few clustering algorithms which are pre-pared to calculate Manhattan, Euclidean or Chebyshev distances. In programmatic terms this corresponds to having Java classes for each of these distance metrics all of them im-plementing the same interface, DistanceFunction. So, what’s necessary to add SML’s se-mantic distances calculation to WEKA is to develop new classes, each based on a desired reference graph configuration and semantic measure option (along with an associated IC specification), which implement the previously mentioned DistanceFunction interface. According to user options, the clustering algorithms then have the possibility to call any of the available distance calculation methods, either conventional or semantic based.
3.1.6
Semantic Distance
At its present state, SESAME is ready to use two ontologies and two corresponding anno-tations files so, the adapted clustering algorithms mentioned in the previous section were enriched with eight options for semantic distance measuring combining four reference graph loading options:
• Ontology1 – reference graph loaded with first chosen ontology;
• Ontology2 – reference graph loaded with second chosen ontology;
• HyperGraf – reference hyper-graph loaded with both chosen ontologies;
• WeightAvg – two reference graphs, one loaded with the first chosen ontology and the other with the second chosen ontology (final distance value based on weighted average values obtained from individual distances calculated using each graph), (the latter two will be explained in greater detail in the next chapter) and two possible semantic measures (both using ontology-based IC computation [58]):
• Direct groupwise semantic measure SimGIC [35] (used in Ontology1Dir,
Chapter 3. Clustering with Semantic Based Distances 26
• Indirect groupwise measure based on Lin’s pairwise measure [45] with Best Match Average – in which each term of the first entity is paired only with the most sim-ilar term of the second one and vice versa [68] – aggregation strategy (used in Ontology1Ind, Ontology2Ind, HyperGrafInd and WeightAvgInd).
Nevertheless, the number of the application’s semantic measuring configurations avail-able may easily be increased if more than two ontologies ought to be used.
The two semantic similarity measures chosen fulfill the requirements established for the present work, where sets of concepts are to be compared implying the use of group-wise measures:
• One measure of the direct and another of the indirect approach types; • Information theoretical (i.e., consider the IC of the concepts);
• Based on graph analysis;
• Reference measures of the respective types.
3.1.7
Output
SESAME’s output consists in a file for each run which outline focus mainly in clearly providing the user all the information pertaining that run’s results. Its content is divided in the following four parts:
1. Run – identifying the inputs (clusterer, measurer, number of target clusters and seed), clustering time and number and percentage of incorrectly clustered instances; 2. Instances – a list of all the clustered instances and, for each, the respective attributed
cluster;
3. Clusters – the list of resulting numbered clusters and, for each, the respective cen-troid URI, number and percentage of instances and attributed class;
4. Confusion matrix – identifying the number of instances from each class assigned to each cluster, an example is shown in table 3.
It is common for a same user to run several tasks and be interested in having all the generated results available to analysis in a user-friendly way. Of course that just having a file for each run with all the aforementioned content would be cumbersome. SESAME in-cludes a tool to, having a set of clustering tasks’ results, facilitate their global analysis and evaluation. This useful tool creates a summary table of tests’ results, like the example in table 4, in a TSV formatted file. Here, key application run results’ values (clustering time and number and percentage of incorrectly clustered instances) and descriptors (clusterer,
![Table 1: Summary of term semantic similarity measures [57].](https://thumb-eu.123doks.com/thumbv2/123dok_br/15496190.1043518/31.892.137.757.100.986/table-summary-term-semantic-similarity-measures.webp)