This project is funded by the European Union
The sole responsibility of this publication lies with the authors. The European Union is not responsible for any use
Economic and Environmental Analysis of Energy
Efficiency Measures in Agriculture
Economic and environmental analysis of energy
efficiency measures in agriculture
Case Studies and trade offs
This project was funded by the FP7 Program of the EC with the Grant
Agreement Number 289139
Project Deliverable 3.1.
Andreas Meyer-Aurich, Hasan Jubaer, Lukas Scholz, Thomas Ziegler,
Leibniz-Institute for Agricultural Engineering Potsdam-Bornim
Tommy Dalgaard Aarhus University
Hannu Yli-Kojola, Jussi Esala, Hannu Mikkola, Mari
Rajaniemi, Tapani Jokiniemi, Jukka Ahokas University of Helsinki Janusz Gołaszewski, Mariusz Stolarski, Zbigniew
Brodziński, Ryszard Myhan, Ewelina Olba-Zięty University of Warmia and Mazury Chris de Visser, Marcel van der Voort, Cecilia
Stanghellini, Hilko Ellen, Arie Klop, Harm Wemmenhove
Wageningen UR
Fátima Baptista, Dina Murcho, Luis Leopoldo Silva, José Rafael Silva, José Oliveira Peça, Mário Louro, Carlos Marques
University of Evora
Antonis Mistriotis, Athanasios Balafoutis, Panagiotis
Panagakis, Demetres Briassoulis Agricultural University of Athens
Photo credits: left photo: Tommy Daalgard, Aarhus University / right photo: FNR/H. D. Habbe © 2012 agrEE
Preface
This report is the result of the collaboration of the partners of the AGREE work-package “Economic and environmental analysis”, which is based on case study analyses of the partners in seven countries of the EU. The case studies show economic and environmental trade-offs in the different regions in the EU, for which each partner is responsible. Nevertheless prior to the reporting of the case studies an intensive discussion on a common methodological approach has been accomplished and applied to the case studies. The case studies show a wide range of different perspectives of energy efficiency in agriculture, but they are all based on the common methodology presented in Chapter 3. In Chapter 4, the case studies are presented, with authors indicated at the beginning of each section. Each section of Chapter 4 ends with a synthesis analysis of the results from the different case studies. Chapter 5 summarizes and concludes the report by highlighting the major findings of the analyses.
The report builds upon the “State of the Art in Energy Efficiency in Europe” published separately by the AGREE consortium (Gołaszewski et al. 2012), which shows the status quo of energy use and possible energy efficiency measures in agriculture across different production systems and regions in Europe. This report presents an economic and environmental analysis based on in-depth case studies which show the potential for, and constraints on, energy efficiency measures in agriculture with respect to the specific environments in Europe.
List of Abbreviations
AGREE AGRiculture & Energy Efficiency AMS Automatic Milking System CAP Common Agricultural Policy CFD Computational Fluid Dynamics CHPP Combined Heat and Power Plant CTF Controlled Traffic Farming
CVT Continuously Variable Transmission
D Germany
EE Energy Efficiency
EL Greece
EM Effective Microorganisms
ENGAGE European Network for Advanced Engineering in Agriculture and Environment
EU European Union
EurAgEng European Society of Agricultural Engineers
FI Finland
GHG Green House Gas
GPS Global Positioning System
GNSS Global Navigation Satellite System HDPE High-Density PolyEthylene
ICT Information and Communication Technology ISO International Organization for Standardization
K Potassium
KBBE Knowledge-Based Bio-Economy LDPE Low-Density PolyEthylene
N Nitrogen NE North-East NL The Netherlands NPK Nitrogen-Phosphorus-Potassium NW North-West P Phosphorus
PAR Photosynthetically Active Radiation PDO Protected Designation of Origin PEC Primary Energy Consumption
PL Poland
PP Polypropylene
PRODER Programa de Desenvolvimento Rural
PT Portugal
PTO Power-Take-Off
SE South-East
SPEC Specific Primary Energy Consumption
SW South-West
TMR Total Mixed Ration
UAA Utilized Agricultural Area
Units:
°C degree Celsius
% w/v mass concentration (mass/volume ≈ mass in g in 100 ml solution) CO2e equivalent carbon dioxide
EUR or € Euro h hour ha hectare = 10,000 m² hp horse power = 746 W g gram = 10-3 kg GJ gigajoule = 109 J J Joule K Kelvin kg kilogram kWh kilowatt hour = 3.6 MJ L litre = 10-3 m³ LU livestock unit m meter ml milliliter = 10-3 L MJ megajoule = 106 J mg milligram PJ petajoule = 1015 J PLN Polish Złoty
RPM revolution per minute
t metric ton = 1000 kg
W Watt
Table of Content
Preface ... 1 List of Abbreviations ... 2 Table of Content ... 4 List of Figures ... 6 List of Tables ... 9 1. Introduction ... 112. Energy Efficiency Measures in Agriculture ... 13
2.1. Reduced tillage and controlled traffic farming ... 13
2.2. Waste/side stream valorization ... 13
2.3. Efficiency measures in storage, drying, ventilation and cooling processes ... 14
2.4. Irrigation systems ... 14
2.5. Fertilizer management (reduced inputs, precision agriculture) ... 15
2.6. Housing (light construction, insulation) ... 15
2.7. Improving the energy efficiency in animal husbandry systems ... 15
3. Methodological Framework for the analysis of measures for improved energy use efficiency in agriculture and their impact on economics and the environment ... 16
3.1. Modeling of agricultural systems to explore trade-offs in the case studies ... 16
3.2. Estimates for energy savings and GHG emission savings associated with the energy efficiency measure ... 17
3.3. Estimates for cost savings associated with the energy efficiency measure ... 17
4. Analysis of Case Studies ... 18
4.1. Case studies–arable crops ... 18
4.1.1. Energy efficiency measures in German wheat production ... 18
4.1.2. Energy efficiency measures in Finnish wheat production ... 22
4.1.3. Poland–Case study on Energy Saving Measures in Wheat Production ... 26
4.1.4. Energy efficiency measures in Dutch wheat, sugar beet and potato production... 30
4.1.5. Energy efficiency measures in Portuguese wheat production ... 37
4.1.6. Energy efficiency measures in a Greek wheat-cotton rotation farming system... 43
4.1.7. Synthesis trade-off analysis of case studies in arable production systems ... 52
4.2. Case studies–dairy and beef production systems ... 53
4.2.1. Poland–Case study on Energy Saving Measures in Dairy Milk Production ... 53
4.2.2. Energy efficiency measures in Dutch milk production ... 55
4.2.3. Energy efficiency measures in Portuguese Dairy Cows production ... 58
4.2.4. Energy efficiency measures in Finnish milk production ... 62
4.2.5. Synthesis trade-off analysis of case studies in dairy production systems ... 65
4.3. Case studies–pork and poultry production systems... 66
4.3.1. Poland – Case study on Energy Saving Measures in Broiler Production ... 66
4.3.2. Case studies – pork and poultry production systems in the Netherlands ... 69
4.3.3. Case studies – pig and poultry production systems in Portugal ... 73
4.3.5. Synthesis trade-off analysis and conclusions in pork and poultry production systems ... 86
4.4. Case studies–greenhouse production systems ... 90
4.4.1. Case studies–greenhouse production systems (The Netherlands) ... 90
4.4.2. Energy efficiency measures in a Greek greenhouse production system ... 95
4.4.3. Energy Efficiency Measures in Portuguese Greenhouse Tomato Production ... 105
4.4.4. Synthesis trade-off analysis of case studies in greenhouse production systems ... 111
4.5. Case studies–Permanent crop production systems ... 113
4.5.1. Energy efficiency measures in German vineyard production ... 113
4.5.2. Energy efficiency measures in a Greek vineyard production farming system ... 114
4.5.3. Energy efficiency measures in Portuguese vineyards production ... 123
4.5.4. Energy efficiency measures in Greek olive groves ... 128
4.5.5. Energy efficiency measures in Portuguese Olive Groves production ... 136
4.5.6. Synthesis trade-off analysis of case studies in permanent crop production systems ... 141
5. Summary and Conclusions ... 144
List of Figures
Figure 1: System boundary of economic and environmental assessments... 17
Figure 2: Relative contribution of different processing units and inputs in wheat production to economics, energy use and GHG emissions ... 18
Figure 3: Impact of different energy saving measures on cost savings, energy use and GHG emissions per ha. ... 21
Figure 4: Impact of different energy saving measures on cost savings, energy use and GHG emissions per ton. ... 21
Figure 5: Distribution of energy input in Finnish wheat cropping with average intensity. Total energy input = 12.3 GJ/ha. ... 23
Figure 6: The impact of thermal insulation on the energy and cost savings of grain drying, reduction of GHG emissions and the pay-back time on a 120 ha farm. Low, average and high cultivation intensities were studied. ... 24
Figure 7: The impact of operating for fuel economy on the energy and cost savings, reduction of GHG emissions, and the pay-back time on a 120 ha farm. Low, average and high cropping intensities were studied... 26
Figure 8: The regional distribution of wheat production in Poland by percentage share in production and yield per hectare. (Source: Concise Statistical Yearbook of Poland 2011) ... 27
Figure 9: Contribution of different processing inputs in wheat production to economics, energy use (PEC) and greenhouse gas emissions (GHG) ... 29
Figure 10: Impact of Different Energy Saving Measures on Cost Savings, Energy Savings and Greenhouse Gas Emission savings (GHG) per ha ... 30
Figure 11: Relative contribution of different inputs in wheat production in The Netherlands to economics, energy use and greenhouse gas emissions (GHG). ... 34
Figure 12: Relative contribution of different inputs in sugar beet production in The Netherlands to economics, energy use and greenhouse gas emissions (GHG). ... 35
Figure 13: Relative contribution of different inputs in potato production in The Netherlands to economics, energy use and greenhouse gas emissions (GHG). ... 35
Figure 14: Relative contribution of different factors used on farm energy, greenhouse gas emissions (GHG) and costs under base scenario. ... 40
Figure 15: Impact of different energy saving measures on costs, profit, energy use and GHG emissions per ha. ... 41
Figure 16: Impact of different energy saving measures on costs, profit, energy use and GHG emissions per ha of wheat. ... 42
Figure 17: Impact of different energy saving measures on costs, profit, energy use and GHG emissions per ton wheat. ... 42
Figure 18: Differences of costs, profit, energy-use and greenhouse gas emissions (GHG) per ton of wheat between the basic scenario and the different energy saving measures. ... 43
Figure 19: Relative contribution of different processing inputs in the farm production to energy use, GHG and economics. ... 49
Figure 20: Energy consumption reduction using the three alternative scenario ... 51
Figure 21: GHG emissions reduction using the three alternative scenarios... 51
Figure 22: Profit increase using the three alternative scenarios ... 51
Figure 24: Total profit increase using the basic scenario and the three alternative scenarios (rent land). ... 52 Figure 25: Impact of Energy Saving Measure on Cost Savings, Energy Use and GHG Emissions per
L of milk. ... 55 Figure 26: Difference in energy efficiency (in MJ/L milk) between 30% & 20% replacement of
cows by heifers. ... 56 Figure 27: Difference in direct electricity use (MJ/L milk) for 80 cows with or without milk heat
recovery. ... 57 Figure 28: Difference in energy use between conventional and organic farming in MJ/L milk (Bos
et al. 2007). ... 57 Figure 29: Relative contribution of different inputs in the farm production to farm costs
economics, energy use and greenhouse gas emissions (GHG) per cow. (Other include bedding straw, veterinary and water). ... 60 Figure 30: Impact of intensive production on costs, profit, energy use and GHG per cow... 61 Figure 31: Impact of intensive production on costs, profit, energy use and GHG per ton of milk. ... 62 Figure 32: Differences of costs, profit, energy use and greenhouse gas emissions (GHG) per ton of
milk between the basic scenario and the intensive production. ... 62 Figure 33: Distribution of energy input in milk production. ... 63 Figure 34: The impact of replacing grasses with nitrogen fixing clovers in silage lays on the energy
and cost savings and reduction of GHG emissions. Minimum, average and maximum are production intensities. ... 65 Figure 35: Relative contribution of different inputs in the farm production to economics, energy
use and greenhouse gas emissions (GHG). Other include bedding straw, veterinary and water. ... 74 Figure 36: Differences of costs, profit increase, energy use and greenhouse gas emissions (GHG)
savings per ton of broilers between the basic scenario, the floor heating and the heat exchanger. ... 76 Figure 37: Relative contribution of different inputs in the farm production to economics, energy
use and greenhouse gas emissions (GHG). Other includes veterinary and water for drinking and cleaning. ... 78 Figure 38: Differences of profit, energy use & GHG emissions (per ton) between the basic
scenario and the studied option. ... 79 Figure 39: Distribution of the energy input in pork production in Finland. ... 80 Figure 40: The impact of airproof storage on the energy and cost savings and the reduction of
GHG emissions per 1 kg live weight in pork production. Average and high are production intensities. ... 83 Figure 41: The impact of heat recovering from outlet ventilation air on the energy and cost
savings per 1 kg live weight and the pay-back time of the investment. Average and high are production intensities. ... 83 Figure 42: A scheme of the broiler production chain in Finland (Siipikarjaliitto 2012). ... 84 Figure 43: Distribution of the energy input in broiler production in Finland. ... 85 Figure 44: The impact of airproof storage on the energy and cost savings and the reduction of
GHG emissions per 1 kg live weight in broiler production in Finland. ... 86 Figure 45: The impact of a heat recovering system on the energy and cost savings per 1 kg live
weight and the pay-back time of the investment in broiler production in Finland... 86 Figure 46: Overview of the product chain of pork (adapted from Nguyen et al. 2010). ... 89
Figure 47: Relative contribution of the production processes (direct and indirect) in a standard Dutch glasshouse to global warming (measured by kg CO2 equivalent, left) and total
energy use (PEC, right). (Torrellas et al. 2012) ... 90
Figure 48: Cost distribution (fixed and variable) and income (€/m2.year) for a greenhouse cucumber operation. ... 94
Figure 49: Environmental impact of the production of 1 kg sweet pepper for all options. The energy use (MJ/kg) is on the left axis and the emission of greenhouse gases (kg CO2e/kg) is on the left. ... 94
Figure 50: Energy, GHGs and Cost profile of the basic scenario. ... 99
Figure 51: Relative contribution of different inputs in the farm production to economy, energy use and greenhouse gas emissions (GHG). (Materials are the LDPE and raffia for tutoring. Others include bumblebees and water). ... 109
Figure 52: Impact of different energy saving measures on costs, profit, energy use and greenhouse gas emissions (GHG) per ton of tomato... 111
Figure 53: Differences of profit, energy use and greenhouse gas emissions (GHG) savings per ton of tomato between the basic scenario and the different options studied. ... 111
Figure 54: Net effects of energetic cane use on environmental and economic indicators. ... 114
Figure 55: Relative contribution of different processing units and inputs in the farm production to energy use, GHG and economics ... 120
Figure 56: Energy consumption reduction using the three alternative scenarios ... 121
Figure 57: GHG emissions reduction using the three alternative scenarios... 122
Figure 58: Profit increase using the three alternative scenarios ... 122
Figure 59: Relative contribution of different processing units and inputs in the farm production to economics, energy use and greenhouse gas emissions (GHG). ... 125
Figure 60: Impact of different energy saving measures on costs, profit, energy use and GHG emissions per ha. ... 126
Figure 61: Impact of different energy saving measures on costs, profit, energy use and GHG emissions per ton of grapes. ... 127
Figure 62: Differences of costs, profit, energy use and greenhouse gas emissions (GHG) savings per ton of grapes between the basic scenario and the different options studied. ... 127
Figure 63: Relative contribution of different processing units and inputs in the farm production to energy use, GHG emissions and economics ... 133
Figure 64: Energy consumption reduction using the three alternative scenarios ... 134
Figure 65: GHG emissions reduction using the three alternative scenarios... 135
Figure 66: Profit increase using the three alternative scenarios. ... 135
Figure 67: Relative contribution of different inputs in the farm production to economics, energy use and greenhouse gas emissions (GHG). ... 139
Figure 68: Impact of different energy saving measures on costs, profit, energy use and greenhouse gas emissions (GHG) per ton of olives. ... 141
Figure 69: Differences of costs, profit, energy use and greenhouse gas emissions (GHG) per ton of olives between the basic scenario and the different options studied... 141
List of Tables
Table 1: Production systems for in-depth analyses of case studies in the four regions ... 18
Table 2: Annualized costs, PEC and GHG emissions with energy efficiency measures in wheat production... 20
Table 3: Percentage share of wheat in the total production costs, energy use and carbon dioxide emission for five crops cultivated in the farm. ... 29
Table 4: Annualized costs, PEC and GHG emissions per one hectare in Łężany farm with energy efficiency measures in wheat production ... 30
Table 5: Income and costs of a standardized Flevoland farm of 120 ha. ... 31
Table 6: Used key figures for study. ... 32
Table 7: Used key figures for study. ... 33
Table 8: Used key figures in the model. ... 33
Table 9: Yield, energy consumption and GHG emission per crop of a standardized Flevoland farm of 120 ha. ... 35
Table 10: Annualized costs, PEC and GHG emissions with energy efficiency measures, based on a model farm of 120 ha in the Netherlands. ... 36
Table 11: Environmental effects of additional compost. ... 36
Table 12: Annual costs, PEC and GHG emission for energy efficiency measures in the farm rotation. ... 41
Table 13: Agricultural equipment of the selected farm and their useful life span ... 47
Table 14: Annualized costs, PEC and GHG emissions per one LU for efficiency measure associated with the intensity of milk production (scenarios 6000 L/LU and 8000 L/LU). .... 54
Table 15: Income and costs from a Dutch dairy farm with 80 cows. ... 56
Table 16: Annualized costs, PEC and GHG emissions with energy efficiency measures, based on a Dutch model dairy farm. ... 58
Table 17: Costs and income for a Portuguese dairy farm with 140 cows. ... 61
Table 18: Annual costs, PEC and GHG emissions with energy efficiency measures. ... 61
Table 19: Input parameters for analysis of energy efficiency in broiler production. ... 67
Table 20: Costs, Primary Energy Consumption (PEC) and GHG emissions per cycle of broiler production for efficiency measure associated with the utilization of poultry manure by external company for energy purposes. ... 68
Table 21: Income and costs from a Dutch pig farm with 4200 fattening pigs ... 69
Table 22: Annualized costs, PEC & GHG emissions with energy efficiency measures, based on a Dutch fattening pig farm. ... 71
Table 23: Income and costs from a Dutch broiler farm with 90000 broilers ... 71
Table 24: Annualized costs, PEC and GHG emissions with energy efficiency measures, based on a Dutch broiler farm. ... 73
Table 25: Costs and income for a Portuguese broiler farm. ... 75
Table 26: Annual costs, PEC and GHG emissions with energy efficiency measures. ... 76
Table 27: Costs and income for a Portuguese pig fattening farm. ... 78
Table 28: Annual costs, PEC and GHG emissions with energy efficiency measures. ... 79
Table 29: Investment and operating costs of a grain dryer and an airproof grain silo. These are alternative methods for conserving cereal on a pork farm. ... 82
Table 30: Investment and operating costs of a grain dryer and an airproof grain silo on a poultry farm. Drying and airproof conserving are optional methods to conserve grain for
broiler feed. ... 86
Table 31: Summary of estimated trade-offs between costs, primary energy consumption (PEC) and total CO2 equivalent GHG Emissions (measured in % point difference compared to the reference) for the case studies selected in Poland (PL), The Netherlands (NL), Portugal (PT) and Finland (FI)... 87
Table 32: Example on trade-offs between the net energy use and the effects on GHG emissions in the form of nitrous oxide (N2O), methane (CH4) or changes on the soil carbon pool (C) in a Danish study (Dalgaard et al. 2011). The total effect of each mitigation option is derived from the partial effect per Livestock Unit (LU) and the expected extent to which the single measure can be implemented. ... 89
Table 33: Annualized costs, PEC and GHG emissions per ha, with EE measures in greenhouse tomato production. ... 92
Table 34: Annualized costs, PEC and GHG emissions per ha, with EE measures in greenhouse sweet pepper production. ... 92
Table 35: Annualized costs, PEC and GHG emissions per ha, with EE measures in greenhouse cucumber production. ... 92
Table 36: Annualized costs, PEC and GHG emissions per ton product, with EE measures in greenhouse tomato production ... 93
Table 37: Annualized costs, PEC and GHG emissions (per ton), with EE measures in greenhouse sweet pepper production. ... 93
Table 38: Annualized costs, PEC and GHG emissions (per ton), with EE measures in greenhouse cucumber production. ... 93
Table 39: Greenhouse construction and equipment ... 99
Table 40: Agricultural equipment of the selected farm and their useful life span ... 99
Table 41: Reduction in cost, energy and GHG emissions due to Alternative 1 ... 101
Table 42: Reduction in cost, energy and GHG emissions due to Alternative 2. ... 103
Table 43: Reduction in cost, energy and GHG emissions due to Alternative 3. ... 104
Table 44: Annualized costs, PEC and GHG emissions per ha, with EE measures in greenhouse tomato production. ... 104
Table 45: Costs and income for a Portuguese tomato greenhouse farm... 110
Table 46: Total annual costs, PEC, GHG emissions and Profit with energy efficiency measures. ... 110
Table 47: Cost analysis energetic use of grape canes (Schwarz, 2012). ... 114
Table 48: Agricultural equipment of the selected farm and their useful life span ... 118
Table 49: Annual costs, PEC and GHG emissions with energy efficiency measures. ... 126
Table 50: Agricultural equipment of the selected farm and their useful life span. ... 131
Table 51: Costs and income for a Portuguese olive groves farm. ... 140
1. Introduction
To date energy efficiency1 in agriculture has received little attention, except for energy used in greenhouses. Nevertheless, energy use is considerable, especially when indirect energy use is taken into account. The project AGREE (AGRiculture & Energy Efficiency) has the objective of showing the potential of short term energy efficiency gains and the promise of the long term potential. Environmental effects of savings on direct and indirect energy use in agriculture are integrally considered, as energy use efficiency also implies reduction of greenhouse gas emissions per unit output. Because energy savings in agriculture depend greatly on the agri-environment, particularly climatic conditions. AGREE brought together south-eastern, south-western, north-eastern and north-western agricultural production systems. Evidence from the energy saving potential and corresponding environmental and economic effects at country level are brought to the transnational level to identify an agenda for transnational collaboration to increase the learning curve on energy use efficiency. To this end, AGREE sets up a stakeholder participation process for two reasons. Firstly by doing so, stakeholders will be involved in the development of the agenda and this will facilitate the implementation of the results. Secondly, AGREE needs the opinions and views of stakeholders to produce an agenda that reflects the needs and opportunities by the various agricultural practices.
To enhance implementation, AGREE has created a link with a European network of researchers committed to adopting the issue. This network (ENGAGE) is closely associated with the European Society of Agricultural Engineers (EurAgEng). This link will facilitate the adoption process. AGREE has established a close link with and involvement of the SCAR/KBBE Collaborative Working Group on agriculture and energy. This group is embedded in the Standing Committee on agriculture and the KBBE-net and is thus perfectly positioned to translate the agenda, produced by AGREE, into commitment for effective R&D on energy efficiency. To this end, it is important that AGREE provides evidence of the added value of such research.
This report uses case studies with an in-depth analysis of the interactions of energy efficiency measures, farm economics and the environmental impact of the measures across Europe. It builds upon the “State of the Art in Energy Efficiency in Europe” previously published by the AGREE consortium (Gołaszewski et al. 2012). It shows trade-offs and win-win situations associated with energy efficiency measures, farm economics and greenhouse gas emissions in agriculture across Europe. These cases studies are virtual farms of average size in which energy efficiency measures are implemented. The impact of these measures on
1 Technically, 'energy efficiency' means using less energy inputs while maintaining an equivalent level of economic activity or service; 'energy saving' is a broader concept that also includes consumption reduction through behaviour change or decreased economic activity. In practice the two are difficult to disentangle and the terms are often used interchangeably (Energy Efficiency Plan 2011. Brussels, 8.3.2011, COM(2011) 109 final)
farm economics, energy use, energy efficiency and greenhouse gas emissions were calculated and discussed. This methodological procedure allowed the project to provide insight in the complexity of energy efficiency.
2. Energy Efficiency Measures in Agriculture
A reduction in energy use can be achieved by reducing energy input. Improved energy efficiency, however, is only achieved, if energy input per unit produce from the agricultural system is reduced. Therefore, improved energy efficiency can be realized with either increased or decreased energy inputs depending on the input-output relationship. Generally energy efficiency can be realized by the use of improved technologies, but also straightforward adjustments to the level of energy input into agricultural systems can contribute to better energy efficiency. Energy efficiency measures in agriculture can be grouped in seven clusters, according to the technology addressed with the energy efficiency measure.
2.1. Reduced tillage and controlled traffic farming
Reduced tillage in plant production systems has been identified as an efficient measure to reduce energy input. Agricultural systems with reduced tillage need less fuel and thus result in lower GHG emissions and lower costs for the farmer. Furthermore, an associated carbon sequestration effect in the soil may further mitigate the net greenhouse gas emissions from agriculture. However, with respect to soil and climate conditions, reduced tillage may also affect crop yields, which could counteract the positive effects. The individual situation needs to be evaluated in each regional setting, which will be provided in the case studies. Using Precision Farming techniques, especially GNSS-Real Time Kinematics to provide autosteer of tractors, can provide permanent trackways for Controlled Traffic Farming (CTF). CTF, very common in Australia and increasingly common in Europe, is primarily a technique to improve soil conditions but can show a fuel reduction of about 20% and additional yield increase as soil compacted by equipment is reduced. This greatly reduces energy used to break-up compacted soil and, over time, allows plant roots to penetrate deeper for nutrients and moisture (Tullberg et al. 2007; Tinker et al. 2010).
2.2. Waste/side stream valorization
The utilization of waste/side streams from agricultural production systems for energy, chemical or other material use can contribute to a more efficient use of energy in the whole agricultural process. The waste streams can be quite different; for instance straw can be used for bioenergy, or used to produce manure from animal husbandry systems, which then can be used to produce biogas. Another option is to use straw directly to produce materials for non-food purposes. Common to all valorization streams is that the production of additional goods, such as energy, chemicals or materials can avoid energy use in other production chains, which can be accounted for as credits according to life cycle assessment accounting methods. However it is necessary that accounting credits for waste stream valorization do not consider the waste in the reference system, otherwise, the value of the waste in the reference system needs to be accounted for. For example the use of animal manure as fertilizer per se is not regarded as an energy saving measure since animal manure is generally used as plant fertilizer. In Europe several regulations, for instance the Nitrogen
Directive, ensures that manure use is controlled when applied to agricultural fields especially maximum fertilizer rates per ha. Therefore, manure use per se cannot be treated as energy saving measure. Instead a more efficent use of manure can contribute substantially to energy efficiency since in this case less energy is needed for fertilizer production. Furthermore benefits for the environment can be expected because of reduced emissions of plant nutrients to the environment.
2.3. Efficiency measures in storage, drying, ventilation and cooling processes
Post-harvest processes such as storage, drying, ventilation and cooling often have a great impact on energy use in agriculture. Drying is a typical method of preserving the quality of different agricultural products like wheat, sunflower, fodder grass etc.. However, it is the most energy intensive unit operation in postharvest technology since typically large quantities of water must be evaporated due to the high moisture content of the harvested products. Gentle treatment of the crops and low drying temperatures are often essential. Some dryers or storage facilities e.g. for onions or potatoes require simple ventilation without significant additional thermal energy input, in order to keep the product free from moisture for avoiding microorganisms. This however requires as well considerable amount of electrical energy for the blowers.
Recognizing and applying efficiency measures in agricultural drying and cooling require a process-oriented approach. Increased uniformity of drying by optimizing the dryer apparatus, minimum heat losses, maximum heat recovery including by the use of heat pumps, and optimized process control are the measures that can be taken for an enhanced energy efficiency in drying. The effect of the measures can be expressed in terms of specific primary energy consumption (SPEC) per unit of evaporated moisture. The SPEC varies considerably depending on the type of the drying process (e.g. continuous or batch-type), the scale of the dryer, the product to be dried, the initial moisture content, the meteorological conditions, and the age of the equipment. In Europe an important difference that must be mentioned in this context, is observed among the countries. The post harvest process steps are not always carried out within the farm boundary. For instance in countries like Germany and Poland drying is often performed by the farmers on the farm in order to acquire a higher price in the market, whereas in the Netherlands usually contract drying is preferred. If storage, drying and other post harvest treatments are not done inside the farm, the corresponding energy efficiency measures are not relevant for the balance around the farm. Nevertheless the measures are still effective for the companies fulfilling the contracts and can contribute substantially to resulting in lower energy consumption in the overall balance for the agricultural products.
2.4. Irrigation systems
Pumping of irrigation water can contribute to substantial energy use. Innovative irrigation technologies use water more efficiently and thus use less energy per crop. The innovative systems have to be adjusted to the production systems in the specific farming contexts and
cannot be applied to all systems in the same way. In the case study analyses views will be given for various systems. Reduced GHG emissions can be expected to be associated with the fuel savings. Furthermore different irrigation systems may provide interactive effects for N2O emissions.
2.5. Fertilizer management (reduced inputs, precision agriculture)
Indirect energy associated with fertilizer use, contributes to the total energy use in agriculture by 30 to 50%. Therefore, all measures to improve the efficiency of fertilizer use contribute to the overall energy efficiency to a great extent. As an example Precision Farming technologies can contribute to improved fertilizer use efficiency. Different technologies, however, have different potentials, which have to be addressed specifically. A reduction in fertilizer use reduces energy use, but at the same time yield may be reduced as well, which could thus even lead to a decrease in energy efficiency. This potential trade-off effect requires attention. A negative effect should be avoided and therefore a well balanced reduction of fertilizer to realize an optimum level of energy use needs to be found.
2.6. Housing (light construction, insulation)
The material and construction of housing in agriculture contributes to energy use efficiency indirectly by the energy cost of the materials including the insulation (leading to less direct energy demand). Even though significant indirect emission savings can be achieved with lightweight construction these gains need to be depreciated over the duration of use of the housing. In contrast, insulation provides yearly direct energy savings especially in northern Europe. In Mediterranean climate zones, housing can be lightweight, as the direct heating needs are low and only occur for a short period of the year.
2.7. Improving the energy efficiency in animal husbandry systems
In animal husbandry systems, energy efficiency can be improved to a certain extent by increased performance of the system in terms of milk yield per cow or meat per animal or eggs per layer. For example Kraatz (2012) showed that energy use per kg of produced milk can be reduced from 2.1 to 1.7 MJ/kg milk by changing the diet of the cows so that milk yield increased from 4000 to 8000 kg milk per year. The increased energy efficiency is primarily a result of reduced energy cost for rearing the offspring necessary to maintain the herd. However a further increase in milk yield per cow did not result in lower energy use per kg milk as the high energy cost of the concentrated feed eventually is not compensated by the reduced energy cost for rearing the offspring.
3. Methodological Framework for the analysis of measures for improved
energy use efficiency in agriculture and their impact on economics and
the environment
Increased efficiency in energy use implies using less energy for the same amount of agricultural product produced. The analysis of the environmental and economic trade-offs includes the analysis of energy efficiency measures on the use of direct and indirect energy, GHG emissions and farm economics. The energy use, environmental and economic analysis are based on a cradle-to-farm-gate analysis, taking all costs and emissions into account needed to produce the agricultural products following ISO 14040. This is a procedure followed throughout the AGREE project. The economic cost calculations were based on the economic settings in the considered countries, while for the energy use and GHG estimates, whenever possible, common methodologies were used.
3.1. Modeling of agricultural systems to explore trade-offs in the case studies
In order to model potential trade-offs between energy savings, GHG-emissions and farm economics the relevant energy efficiency measures were modeled in simple spreadsheet based models. Four model frameworks were constructed to estimate the effects of energy saving measures on farm level in cropping systems, animal production systems, greenhouses and permanent crop systems. The farms were defined as typical and thus virtual farms in the countries considered expressing a general and common or average situation. This procedure allowed to yield results of average and indicative value. The calculations are not based on real farming situations but prices, inputs and yield express average levels within a country. For each farm system, models were constructed based on typical farm situations in the countries for the selected case studies. Instead of modeling just the production systems, we have put the studied production systems within a farm framework and included the related costs and savings on energy, economic costs and GHG emissions to the total costs at farm level.
In order to provide consistent results across Europe the same system boundaries for all economic and environmental assessments were chosen. The farm gate was considered as the ultimate boundary of the analysis of the trade-offs of energy efficiency measures (Figure 1). This means that in some countries processes are within farm boundaries whereas in other countries they lie outside the boundaries. For instance in wheat production, drying is not included in Dutch farms but is included in German arable farms. The target is not to compare different countries but to get an idea of the effects of energy efficiency measures on farm level.
Figure 1: System boundary of economic and environmental assessments
3.2. Estimates for energy savings and GHG emission savings associated with the energy efficiency measure
The calculations of the energy savings and GHG emissions with the energy efficiency measures were based on the report “State of the Art on Energy Efficiency in Agriculture” published on the AGREE website2 (Gołaszewski et al. 2012) and extended with regard to GHG emissions. Data on assumptions were, if not stated otherwise, drawn from published data from the Biograce database (www.biograce.net).
3.3. Estimates for cost savings associated with the energy efficiency measure
The economic assessments were based on the use of inputs calculated for the farm models. Furthermore, fixed costs were allocated according to the expected lifetime of the equipment used. Prices for inputs and machinery (variable costs) were taken from country specific data, as described in the case study analyses.
2
4. Analysis of Case Studies
In case studies across Europe energy efficiency measures were analyzed for their interactions with farm economics and environmental impacts. This is done in order to understand potential opportunities as well as drawbacks and pitfalls associated with energy efficiency measures across Europe. The production systems for the in-depth analysis are shown in Table 1.
Table 1: Production systems for in-depth analyses of case studies in the four regions Regions
Production systems SW (PT) SE (EL) NW (DE, NL) NE (PL, FI) Arable crops Wheat Cotton, wheat Wheat (D, NL),
sugar beet (NL), Wheat
Dairy / beef Dairy Dairy (NL) Dairy
Pork/ poultry Pork, poultry Pork, poultry (NL) Pork (FI), poultry (FI, PL) Greenhouse production Tomato Greenhouse production systems Tomato, cucumber, sweet pepper (NL) Permanent crops Olive trees,
vineyards
Olive trees,
vineyards Vineyards (D)
4.1. Case studies–arable crops
4.1.1. Energy efficiency measures in German wheat production
Andreas Meyer-Aurich, Thomas Ziegler, Hasan Jubaer, Lukas Scholz, Tommy Dalgaard
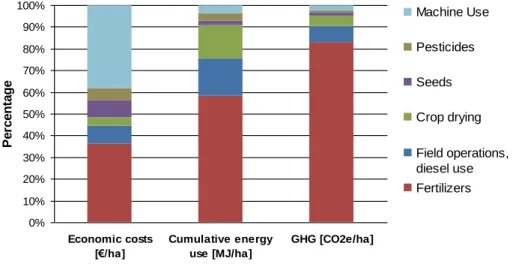
The statistical data regarding energy input in German wheat production was shown with three different scenarios (low, average, high) in the report “State of the Art on Energy Efficiency in Agriculture” published on the AGREE website (Gołaszewski et al. 2012). The highest energy inputs in typical German wheat production stem from fertilizer inputs and grain drying, followed by fuel use (Figure 2).
0% 10% 20% 30% 40% 50% 60% 70% 80% 90% 100% Economic costs [€/ha] Cumulative energy use [MJ/ha] GHG [CO2e/ha] Pe rc e n ta g e Machine Use Pesticides Seeds Crop drying Field operations, diesel use Fertilizers
Figure 2: Relative contribution of different processing units and inputs in wheat production to economics, energy use and GHG emissions
The direct energy use is about one third of the total energy use in wheat production, two thirds of the energy use stems from indirect energy use, which statistically is typically
accounted for outside the agricultural sector but is caused by agricultural activities and should be taken into consideration for energy saving potentials in agriculture. The implications of energy efficiency measures in different processing units are very different though. While typically for improved grain drying systems significant investments are necessary, reduced fertilizer input has no investment requirements unless technological solutions, like precision farming are applied. Anyhow, a reduction in fertilizer input compared to optimal fertilizer rates results in opportunity costs such as reduced yields, while precision farming, especially site-specific fertilizer application may increase energy efficiency without reductions in yield.
Investments in grain drying
In order to implement the proper efficiency measure in grain drying systems, it is very important to recognize the main causes of poor efficiency. The leading reasons causing variation in the specific energy consumption of wheat-drying include the type of the drying process (e.g. continuous or batch-type), the size as well as age of the equipment, the initial moisture content of the product and the weather conditions.
Several types of dryer are used in drying of wheat. Most of them are also well-established and well known. However, they are not always energy efficient in their design or operation. For instance a dryer with poor design causes heterogeneous drying of the crop, which ultimately leads to significantly high energy consumption. Therefore, one of the most important measures towards energy efficiency is to implement dryers with optimal design. Another measure at farm level, which does not require as large investment as for new equipment, is to improve the operation of the existing dryer by implementing energy optimization. For instance, an optimized process control system can decrease the specific energy consumption considerably.
A substantial amount of energy gets wasted in drying of wheat only because the energy in the system is not utilized properly. Apart from the heat losses due to poor or missing thermal insulation, in most cases heat recovery from the waste air is lacking, which results in a considerable additional amount of energy to be consumed. Therefore, maximizing heat recovery for instance by using heat pumps as well as minimizing heat losses by better insulation are essential, in order to achieve a better energy efficiency.
Precision Farming
Precision farming is a measure to apply inputs more precisely and minimize inefficient nutrient losses. For this study we draw from a case study in Germany, where major investments were implemented in a farm, which resulted in increased yields and reduced fertilizer inputs (Meyer-Aurich et al. 2008).
Reduced nitrogen fertilizer input
Reduced nitrogen fertilizer input may be an effective measure to reduce the energy input per ha in cropping systems. However, since yield is affected by fertilizer levels, a reduction in
fertilizer use may result in reduced yield. The impact of reduced fertilizer applications have been investigated by Meyer-Aurich et al. (2011) and is used to illustrate the trade-offs of reduced fertilizer inputs in cropping systems.
Relative Contribution of different inputs and process steps to energy use, total costs of production and greenhouse gas emissions
The different inputs and processing units contribute in different proportions to the total costs, primary energy consumption (PEC) and greenhouse gas emissions (GHG). This implies that some small changes may cause only a little change in costs, but have a high impact on energy use and GHG emissions. For example crop drying has a small contribution to the total economic costs of wheat production, but the relative impact on the energy use is much higher. In contrast, the relative economic cost of machinery use is much higher than its impact on energy use and GHG emissions.
Impact of different energy efficiency measures on economics and the environment
The analysis showed that all suggested energy efficiency measures contributed to energy savings and reduced GHG emissions, which were in the range of 2.3 to 4.4% of the total energy use and 1.3 to 5.9% for the GHG emissions (Table 2). Cost savings were in the range of 1.3% to 3.2% for all energy efficiency measures with the exception of reduced nitrogen fertilizer measure. In this case negligible costs apply because the fertilizer application rate was below the economically optimal rate.
Table 2: Annualized costs, PEC and GHG emissions with energy efficiency measures in wheat production
Annualized Cost PEC GHG €/ha % MJ/ha % CO2e/ha %
Reference 952 100.0 19260 100.0 1722 100.0
Dryer I (New dryer with optimal design) 932 97.9 18459 95.8 1679 97.5 Dryer II (Optimization of existing dryer) 939 98.7 18820 97.7 1699 98.7 Precision Farming 921 96.8 18620 96.7 1661 96.4
Reduced N 952 100.1 18414 95.6 1621 94.1
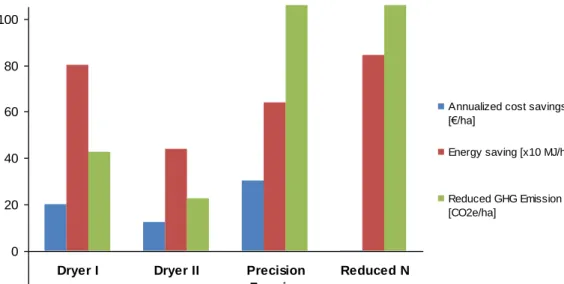
While the measures which affect the fertilizer application rate have a strong effect on GHG emissions, improved drying has a major effect on the energy use but a smaller effect on GHG emissions (Figure 3). Comparing other energy efficiency measures with “Precision Farming”, the economic and environmental effects were higher when the effects were related to the crop yield (per ton) (Figure 4). This is due to the assumed yield increasing effect of Precision Farming. Since “Reduced N” results in reduced crop yield, the environmental effects are less pronounced per ton of product, while the economic effects were more pronounced. However, the 10% reduced fertilizer application does not result in negative energy savings per ton of crop, although this is the case with more drastic fertilizer reductions.
All energy saving measures, which were associated with investments showed positive annualized cash flows, indicating economic profitability. These need to be analysed further with sensitivity analyses to provide a holistic investment analysis.
-20 0 20 40 60 80 100
Dryer I Dryer II Precision Farming
Reduced N
Annualized cost savings [€/ha]
Energy saving [x10 MJ/ha]
Reduced GHG Emission [CO2e/ha]
Figure 3: Impact of different energy saving measures on cost savings, energy use and GHG emissions per ha.
-10 0 10 20 30 40 50
Dryer I Dryer II Precision Farming
Reduced N
Annualized cost savings per ton [€/t]
spec. Primary energy saving [x10 MJ/t]
spec. reduced GHG emission [CO2e/t]
Figure 4: Impact of different energy saving measures on cost savings, energy use and GHG emissions per ton.
Conclusions
The introduction of Precision Farming, some reduced nitrogen fertilizer application and improved crop drying technologies proved to be efficient measures for enhancing energy efficiency in wheat production. While the Precision Farming and improved crop drying measures require investment, reduced fertilizer input can be realized without investments (although farmers will need to monitor carefully fertilizer use and impact on yield to ensure that it is still economically near optimum). While policies targeting reduced pollution with reactive nitrogen have been set in place, current policies do not consider energy and GHG aspects of different fertilizer strategies in the same way (Häussermann & Döhler 2010). The environmental effects of all measures are comparable and do not show a clear advantage of one measure against others. However, reduced fertilizer input implies an economic loss which is unlikely to be realized by farmers unless they are forced to do so, and currently given the interest in global food sustainability and CAP negotiations, may not be politically attractive. The measures of this case studies are rather process based and do not take into account complex interactions relevant for whole crop rotations, which can have a great effect on energy use efficiency, especially when integrating legumes in the crop rotation.
4.1.2. Energy efficiency measures in Finnish wheat production
Hannu Yli-Kojola, Jussi Esala, Hannu Mikkola, Mari Rajaniemi, Tapani Jokiniemi, Jukka Ahokas
Wheat is a grain crop cultivated all over Europe which is why it was chosen as a reference crop analyzed in all six AgrEE countries. However, barley and oats are more important cereal crops in Finland and they are cultivated on larger area (in 2010: barley 448 000 ha, oats 296 000 ha, wheat 214 000 ha (Information Centre of the Ministry of Agriculture and Forestry 2011)). Barley and oats are better adapted to the short Finnish growing season than wheat. Wheat has been traditionally cultivated in southern and south-western parts of Finland. Due to its longer growing season and higher temperature requirement, the risk of unfavorable growing seasons in the northern parts of the country are higher than those for barley and oats. A traditional cultivation chain of wheat starts with ploughing as a primary tillage method. It is followed by secondary tillage, combined seeding and fertilizer placement, plant protection, harvesting, and grain drying.
Combined seeding and fertilizer placement (to every other row spacing to a depth of 6–8 cm) is a Scandinavian specialty which has many positive impacts on the growth of cereals and oil seed crops. It improves exploitation of nitrogen, reduces pressure of weeds, lowers the moisture content of grains at harvesting time and increases the yield (Kara & Räisänen 1976; Esala & Larpes 1986a; Esala & Larpes 1986b; Rasmussen et al. 1996; Rees et al. 1997). This method is already widely used and it can’t be regarded as a novel EE measure. Farmers also favour stubble cultivation and direct drilling instead of ploughing in cereal cultivation. Both of the measures decrease diesel fuel consumption (Danfors 1988) and if the yield is the same as it is after ploughing, EE will be improved.
Grain drying is necessary in Scandinavian conditions. The moisture content of cereals at harvesting in Finland are, as long-term averages, for barley 18.8%, oats 18.5%, spring wheat 20.5%, winter wheat 21.0%, and rye 23.1% (Sieviläinen 2008). In practice, grain has to be dried every year. Grain can be stored by methods other than drying e.g. by silage method, with propionic acid addition, or by means of airproof preservation. However, drying has been used mainly (90% of the grain yieldaccording to Suomi et al. 2003), because drying is an appropriate method for that part of the cereal yield which is used for human nutrition, seed, or for industrial purposes or exported. The rest of the yield (> 60% according to Suomi et al. 2003) is used for animal feed and it could be stored fresh without drying (Siljander-Rasi et al. 2000). The impact of fresh storage methods on EE and economy are discussed in the chapters of milk, pork and broiler production.
Energy consumption and saving in wheat production
The distribution of energy use in Finnish wheat cultivation is presented in Figure 5. Fertilizers are the major input and would be an attractive target for energy saving measures. There are potential measures to cut nitrogen input by implementing crop rotations which include legumes. There is also potential to reduce the need of P and K by means of better nutrient recycling. However, changes in crop rotations would also require changes in the market of
agricultural products. There should be sufficient demand for products other than cereals at reasonable prices. One possibility could be to include green manure crops in the crop rotation or to grow catch crops after the cash crops. These measures should be economically competitive with synthetic fertilizers. Changes in crop rotations and their impacts on the market of agricultural products are difficult to forecast and therefore interest in this analysis was focused on grain drying and on diesel fuel consumption in field operations. They are the second and third most significant energy inputs in wheat cultivation.
Figure 5: Distribution of energy input in Finnish wheat cropping with average intensity. Total energy input = 12.3 GJ/ha.
Grain drying was the second highest energy input in wheat production. 10-20% of energy could be saved in grain drying by thermal insulation of the hot metal surfaces of the grain dryer (Ahokas and Koivisto 1983). Thermal insulation does not interfere with the use of the grain dryer in any way and is an inexpensive investment which a farmer can do himself making it an attractive energy saving investment. Energy could be saved also by avoiding drying at night time. The impact of the temperature on the water holding capacity of air can be found from the Mollier diagram. Heating increases the absolute water holding capacity more in higher than in low temperatures. So, from the point of view of energy saving it is advisable to use as hot air for drying as possible but, of course, taking into consideration fire safety and the impact of high temperatures on the quality of grains. The ambient air temperature is at night time 5–10˚C lower than at daytime. This would save energy 5–20%. Heat recovery from the outlet air of a grain dryer is technically possible but it is so far uneconomical due to high investment costs.
One suggestion to reduce diesel oil consumption in agricultural is to teach economic tractor operating to farmers. Teaching is expected to have similar impacts on fuel consumption as courses on economic driving for car drivers. It is also assumed that online feedback on fuel consumption (l/ha) would help tractor operators to adopt economic driving .
These measures were seen as practical and relatively easy to be implemented quickly. They are expected to lower the direct energy demand of wheat production and if realized together they could cut 10% off the direct energy consumption and 3% off the total energy consumption for wheat production.
Thermal insulation of a grain drier
A hot air grain dryer of silo type is typical in Finland. The grain is dried in batches from 10 to 70 m3. The grain circulates in the dryer during the drying process and normally it passes
through a pre-cleaner several times as well to remove dust, trash, weed seeds and light, poor quality grain and improves the quality of the grain. Continuous operation grain dryers are not popular due to the lack of continuous grain input because of the uncertain harvesting conditions and difficulty in drying very moist grain. The temperature of the ingoing air is 60–80°C depending on the moisture content of the grain. It is lower the higher the moisture content because a high temperature destroys the germination ability of seeds. However, grain which is used for animal feed can be dried with air up to 100°C or even more (Suomi et al. 2003).
Due to the high temperature of the ingoing air metal surfaces of the grain dryer are hot. Significant energy can be lost from uninsulated surfaces (Ahokas and Koivisto 1983). Thermal insulation can be made simply by fixing insulation sheets on the hot surfaces of the grain dryer and round the air duct leading from the furnace to the grain dryer. Only the air input part of the dryer needs to be insulated. The outlet section can be left without insulation. For thermal insulation of a 30 m3 grain drier 40 m2 polyurethane sheets is needed. The cost is 800 € (40 m2 x 20 €/m2 = 800 €). Labor cost for installation is 200 € (10 hours x 20 €/hour). The write-off period of the investment was supposed to be 15 years. Estimated savings were 10% of the fuel consumption for drying.
Figure 6 shows the energy savings MJ/t and cost savings €/t, reduction of GHG emissions kg CO2e/t, and the pay-back time in years on a 120 ha farm. Cropping intensity had just no impact on these indicators. The pay-back time of the investment was 1.3-1.5 years. Calculation made with smaller cultivation areas indicated that the pay-back time was less than 10 years even though the farm size was only 30 ha. The annual profit of the investment was higher than the annual costs and for this reason the cost of GHG emission reduction was negative (from -172 € to -634 €/kg CO2e).
Figure 6: The impact of thermal insulation on the energy and cost savings of grain drying, reduction of GHG emissions and the pay-back time on a 120 ha farm. Low, average and high cultivation intensities were studied.
The temperature of the drying air should be kept constant during the drying period. If the ambient air temperature falls then more energy is needed to heat air. For example if 70˚C drying temperature is used, at daytime the ambient temperature can be 15˚C and a
temperature rise of 55˚C is needed. At night time the ambient temperature can be 5˚C and a temperature rise of 65˚C is needed and some 18% more energy is needed to heat air. During intensive harvesting season it is not always possible to dry only at daytime because the dryer capacity in many cases restricts the harvest capacity and the dryer must be operated day and night.
Operating tractors for fuel economy
Diesel oil can be saved in tractor operations by using the tractor in the optimal loading range of the engine (Renius 1999; Handler and Nadlinger 2009). The most energy efficient loading range is engine specific but can be found from test reports. At the most fuel economic loading rate the torque is generally 70-90% of the maximum and the speed of the engine is 60–80% of the maximum. The tractor can be operated at the optimal load if the power of the tractor is correctly matched to the capacity of the implement and that power transmission by suitable sized and ballasted tyres or Power-Take-Off (PTO)use that allows the optimal engine load to be achieved. This is the technical basis of economic tractor operating (Green driving). This kind of short introduction to the theory of fuel economy could be included to the lessons of green driving. Gear Up, Throttle Back advice and engine efficiency indicators have been available for very many years in certain countries as described in Tinker 1992.
Courses on driving for fuel economy (Green driving) for car drivers have proved that after the course fuel consumption is 6–13% less than before the course (SenterNovem 2005). Studies have also shown that immediate feedback of fuel consumption by a gauge or monitor helps to save fuel and to adopt energy saving driving. A study of tractor fuel consumption in field work has shown that fuel efficient driving can be realized also in tractor operations (Ahokas & Mikkola 1986).
A driving course could be a one day event including 2–3 hours lessons and another 2–3 hours practical training. A group of 10–15 tractor operators at a time would be an ideal number of people for one course. The group is small enough to stimulate spontaneous discussion among course participants and practical training is easy to arrange. Lessons should contain information about fuel consumption meters to give real-time fuel consumption feedback in older tractors. If GNSS devices are incorporated then fuel use per distance or per area can be shown as well. In modern tractors these devices are mostly available as standard or as options.
Practical training is important because it demonstrates the impact of driving style on fuel consumption. Playful competitions are a good way to raise interest and to motivate participants. Existence of a GNSS device in a tractor can motivate farmers to use GNSS for field navigation. This can reduce overlapping by ca. 5-10% which improves the efficiency of fuel use, operator’s time, seed use and plant protection chemicals and fertilizer application. Better application, apart from reducing inputs, improves yield and quality and reduces emissions. Savings in plant protection chemicals and fertilizer are savings of indirect energy.
Investments needed to realize this energy saving measure are a course on operating for fuel economy (300 €) and devices to enable the online feedback of fuel consumption to be seen in the tractor cab (650 €). The write-off period for the devices was estimated to be 10 years and the estimated saving was 10% of fuel consumption.
Economic analysis was made for a 120 ha farm but costs were studied on smaller farms too. Figure 7 shows the energy and cost savings MJ/t, reduction of GHG emissions kg CO2e/t, and the pay-back time on a 120 ha farm. The magnitude of this energy saving measure was much the same as that for thermal insulation of the grain dryer. Energy saving from green driving increased when cropping intensity increased while thermal insulation was not sensitive for cropping intensity. The pay-back time was 3.3–1.3 years and it was less than 10 years even for a 40 ha farm. Costs of GHG emission reduction were negative for this measure because the annual profit of the investment was higher than the annual costs.
Figure 7: The impact of operating for fuel economy on the energy and cost savings, reduction of GHG emissions, and the pay-back time on a 120 ha farm. Low, average and high cropping intensities were studied.
Modern tractors equipped with an automatic powershift or a continuously variable transmission (CVT) help the operator to save energy because they enable the tractor engine to run at the most fuel efficient speed and torque for a range of vehicle speeds and loads. Integrated electronic engine control units, ECU, can adjust the engine speed and transmission ratio in a way that is beyond the driver’s capabilities. Though the efficiency of the powershift and CVT transmissions is lower than that for a simple manual operated mechanical transmission the engine of the tractor operates so much more efficiently that it improves fuel economy.( Tinker 1992).
4.1.3. Poland–Case study on Energy Saving Measures in Wheat Production
Janusz Gołaszewski, Mariusz Stolarski, Zbigniew Brodziński, Ryszard Myhan, Ewelina Olba-Zięty
Poland’s share is 1.4% of the global and 6.9% of the EU-27 wheat production. Despite a recent downward trend in the wheat use, with some replaced by maize and triticale, wheat remains the most important cereal and is cultivated across the whole country (Figure 8). Our evaluation of the energy efficiency of winter wheat production and potential energy savings has been performed on a cash crop farm in Łężany (Province of Warmia and Mazury;
53.9667 °N, 21.1333 °E) taken as a case study, and with the 2011 data. The farm does not have any livestock production. The arable area is 1058 ha. The soils vary from sandy through sandy clay and clay loamy ones; in terms of agricultural usability, they are classified from complex 3 (defective wheat complex) to complex 6 (defective rye complex). The crops and proportions on the farm are winter wheat (59.4%), winter oilseed rape (18.1%), oat (14.2%), spring oilseed rape (8.1%) and winter rye (0.2%). The straw is used for energy generation.
Figure 8: The regional distribution of wheat production in Poland by percentage share in production and yield per hectare. (Source: Concise Statistical Yearbook of Poland 2011)
Our analysis of the energy efficiency attained on the above farm contains three energy saving measures:
1) change in plant rotation by reduction of oilseed crops (winter rapeseed) and inclusion of leguminous crop–horse bean;
2) ploughing of straw and application of multi-compound inorganic fertilizer, and 3) application of effective microorganisms.
The energy saving measures considered here represent the three aspects of integrated production in a farming system, which takes into account the economics of production as well as protection of the environment.
Plant rotation and replacement of oilseed crops with leguminous crop–horse bean
By introducing leguminous crops into a crop rotation system including cereal and industrial crops, it is possible to reduce amounts of applied nitrogen fertilizers and to improve productivity of crops owing to increased organic matter resources, improved soil fertility, enhanced soil biological activity and more effective use of nutrients and moisture by plants (Korbas 2011). Consequently, the inputs for plant fertilizer use are lower as the nutrients are used by the plants more effectively. This means there is better effectiveness of chemicals used to protect plants from diseases and pests. Likewise, the biological activity in the soil is improved, e.g. it contains higher counts of beneficial organisms. As a result, fewer plant protection treatments and less pesticide, are needed.
Ploughing in of straw and application of liquid multi-compound fertilizers with macro and microcompounds
There is a high demand in Poland for energy biomass, which makes straw such a valuable fuel that many cash crop farms increase their income by selling straw. With such a demand and with a generally low level of humus in Polish soils, intensive cash crop production,