Mergers and Acquisitions:
The Roche’s offer for Illumina
Estela Maria Serra Lucas
Advisor: Peter Tsevetkov
Dissertation submitted in partial fulfillment of requirements for the degree
of MSc in Business Administration, at the Universidade Católica Portuguesa.
Abstract
As of January 2012, the Swiss drug maker Roche made a hostile offer of $44,50 USD per share of Illumina, a biotechnology company based in the US. This move has been following a consolidating strategy from Roche that acquires small and mid-sized companies which will allow its business to develop. The beginning of the negotiations was coincident with the beginning of this dissertation and it captured the writer’s attention to evaluate such deal.
Throughout this dissertation, there is a review of literature regarding several topics on valuation and M&A, followed by an analysis of both companies and their respective industries. One of the most important chapters is related to the companies’ valuations and the assessment of potential synergies from the deal. An offer price is suggested along with an offer structure.
Illumina’s market cap is valued at $5,7 bn, representing an upside potential of 35% against the figures of the last trading day of 2011. Synergies are estimated to be of $3,3 bn, mostly due to Roche’s capability to launch personalised medicines, as well as its capability to incorporate Illumina’s operations and make it more efficient. An offer price of $56,47 is suggested with a deal 100% financed with debt, so that most of the value added is received by Roche’s shareholders.
By the time this thesis was delivered, there was still no agreement between both companies in order to close the deal and Illumina asked for $75 per share in the last negotiation, which Roche rejected.
Acknowledgments
After such a long and difficult journey, I would like to express my acknowledgements to Professor Peter Tsvetkov for the availability, the feedback and the knowledge transmitted throughout this process. His insights were extremely helpful in order to achieve my final goal.
Also, I must convey my gratitude to all my Finance Professors, especially Manuela Athayde Marques and Guilherme Almeida e Brito for providing me the knowledge needed to develop this dissertation and for being responsible for my interest in Finance.
I am very grateful for my dear friends and colleagues Richard Herstell, Isabel Almeida e Brito, Marine Santos, Sara Machado and Alberto Ippolito among several others that helped me with their knowledge and companionship throughout the entire Masters Program.
Finally, I want to thank my father, sister and grandfather for being a constant help and motivation to give the best of me in everything I do. I would also like to dedicate my effort and my final result on this dissertation to two important people in my life that would certainly be proud of my work, my mother and my grandmother.
Table of Contents
1. Introduction ... 5
2. Literature Review ... 6
2.1. Literature on Mergers and Acquisitions ... 6
2.1.1. Types of M&A ... 6
2.1.2. One Plus One Equals Three – The Reasoning for M&As ... 7
2.1.3. The Power of Synergies ... 8
2.1.4. Cross-Border M&A ... 9
2.1.5. Methods of Payment and Their Implications ... 10
2.2. Literature on Valuation ... 11
2.2.1. Valuation Techniques ... 11
2.2.2. Discounting Cash Flow Valuation ... 11
2.2.3. Relative Valuation ... 13
2.2.4. Contingent Claim Valuation ... 13
2.2.5. Putting It to Practice ... 14
3. Roche, Illumina and Industry Review ... 18
3.1. Roche ... 18
3.2. Illumina ... 19
3.3. Industry Review ... 20
3.3.1. Pharmaceuticals... 20
3.3.2. Life Science Tools ... 22
4. Valuation ... 24
4.1. Standalone Valuation of Illumina ... 24
4.1.1. Main Assumptions ... 24
4.2. Standalone Valuation of Roche ... 30
4.2.1. Main Assumptions ... 31
4.2.2. Results... 33
4.3. Merged Entity ... 33
4.3.1. Roche and Illumina – Valuation of Both Businesses Together ... 34
4.3.2. Roche and Illumina – Accounting for Synergies ... 36
4.3.3. Inferring the Value of Synergies ... 38
4.3.4. Integration Costs... 38
5. The Acquisition ... 40
5.1. How much should Roche pay? ... 40
5.2. Structure of the Final Offer ... 42
5.3. Execution Risk ... 43
6. Conclusion ... 44
7. Appendix ... 45
1. Introduction
As of January 2012, the Swiss drug maker Roche made a hostile offer of $44,50 USD per share of Illumina, a biotechnology company based in the US. This move has been following a consolidating strategy from Roche that acquires small and mid-sized companies which will allow its business to develop. As stated in Roche’s latest annual report, “Our goal is to lead through innovations in science by combining the critical mass of Big Pharma with the flexibility and entrepreneurial spirit of smaller business units”. The special interest in Illumina is related with its gene sequencing technology that would allow Roche to develop state-of-the-art therapies, customised for each patient.
Since the negotiations would occur during the development of this dissertation, it seemed appealing to explore this deal. As a cross-border acquisition, it was also a good way to perform a more interesting analysis. Moreover, As Roche and Illumina are at two different stages in their life-cycle, two different perspectives would have to be considered for the valuation assumptions. Lack of information, especially from such a recent company as Illumina was one of the challenges, as well as the complexity of the healthcare industry.
After several rounds of negotiation and considerable speculation, Illumina consistently rejected Roche’s offer – $51 USD per share was the final offer in April, totalling a $7 billion deal. By the end of December the deal resurfaced with Illumina asking for a price of $75 per share, which Roche rejected.
In this dissertation, both companies will be valued, potential synergies will be accounted and an offer price will be proposed. These figures will then be compared with Roche’s offer, in order to ascertain whether it was a good move on the part of Illumina to reject the deal or if, on the other hand, Roche acted well in its decision to walk away and not raise the price above $51 USD.
The literature review section presents an overview of the academic perspective on company valuation and mergers and acquisitions. This chapter is important to understand which are considered the best practices, in order to reach a valuation and to build up an acquisition strategy that is as accurate as possible.
Relying on available data, an industry and both companies’ analysis are performed. This section sums up relevant financial data to be considered when assumptions about the companies have to be made in the valuation section. Both companies will be valued at a point in time before the announcement of the offer (standalone valuation) and then the merged entity will be valued, subsequently incorporating the possible synergies. A strategy for the acquisition has to be built and it is important to assess which players would benefit from such a deal.
Finally, a comparison with reality is undertaken, in order to understand why the deal did not take place so far. It is important to mention that, no matter how deep the analysis performed and how detailed the forecasts are, it is impossible to reach an exact, 100% accurate value, since guessing the future is not possible and many factors may change and lead to different results in the years to come. Above all, the most important thing is to exercise a logical rationale that would fit the best practices to analyse such deals.
2. Literature Review
In this chapter, several academic aspects regarding M&A and Company Valuation will be addressed. By analysing different academic studies, one can find information to help decide which valuation method is more appropriate in each case or which risk premium should be considered in a cross-border deal. In the following pages, the relevant literature for this thesis will be addressed, additionally considering some alternatives and points of discussion that although are not applicable for the case, are worthy of mention.
2.1. Literature on Mergers and Acquisitions
2.1.1. Types of M&A
There are different classifications to identify types of M&A. For instance, Ross et. al (2003) mention two different ways to categorize M&As – legal procedures and the typical financial analysts’ classification.
Within the legal procedures, there are three distinct deals:
Merger or Consolidation – In a merger, the buyer absorbs the target company, acquiring all the assets and liabilities and through a consolidation, a new firm is created, aggregating both companies, leading to a new legal entity. Both types of deals need the approval of the involved companies’ stockholders, generally, by a favourable vote from, at least, two-thirds of the total shares.
Acquisition of Stock – The acquirer makes an offer for the target’s stocks. Usually, this operation is performed through a tender offer, i.e. buying the target’s shares making a public offer for the shareholders of that firm. A general meeting is not necessary since the buyer deals directly with the shareholders. However, it may be difficult to buy the entire company as it is up to each and every shareholder’s decision whether to sell the shares or not.
Acquisition of Assets – The bidding company buys all the assets from the target. It requires a formal approval from the shareholders and transferring the ownership of those assets may be costly.
According to the typical financial analysts’ classification, the deals are characterized as follows:
Horizontal Acquisition – Both the bidding and the target companies are from the same industry, competing in their product market.
Damodaran (2002) presents a classification similar to the above mentioned legal procedures type and he adds another classification for a deal when it is not a company acquiring a second one, but instead, a company is acquired by its own management team (Management Buyout) or by a group of investors, usually making the acquisition with a high level of debt (Leverage Buyout).
2.1.2. One Plus One Equals Three – The Reasoning for M&As
There are different motives for companies to engage in M&A deals. Some of the most commonly mentioned across academic papers are the acquisition of undervalued companies, diversification by buying firms from other businesses, synergies (operating and/or financial), the acquisition of badly managed companies or even just for managerial self-interest. Bower (2001) outlines distinct strategic objectives and major concerns regarding the different reasons for M&A deals. Either by an attempt to deal with overcapacity or by a roll-up of local competitors, the bidder is looking for growth and market share. One should be concerned with the problems that may arise from such deals. Through the aggregation of several companies, there may be a conflict in terms of culture or operations. Usually, there is a rationalization of costs and the acquired company’s employees are more affected by the layoffs. If the deal is a merger of equals (companies of roughly the same size), there may be strong arguments for cost cutting decisions, which values to implement, how to manage organizational culture conflicts and, especially, who will take management control.
Another interesting perspective is the acquisition of companies as a substitute for R&D or to exploit a new industry that is likely to become important in the market. These strategies would imply entering into new fields but could also be a source of diversification for the company, thus diminishing the company’s risk. As for the substitution for R&D, the company may be acquiring some start-ups in the same industry. As far as main issues that may arise are concerned, these are related with cultural aspects and being able to provide the freedom that is necessary for the creative process. When it concerns a strategic shift towards other industries, management should focus their efforts on due diligence and ensure that they understand the new market that will be addressed.
There may be other less financial aspects such as testimonials and success stories that may influence managers towards this type of deal. Kummer and Steger (2008) performed a study on M&A waves and they mention that “Testimonial evidence about businesses at conferences and in the media tells us that some M&A have (supposedly) been a huge success” but “…when these success stories are examined in detail, it is often difficult to measure whether they really were successful.” Companies also suffer external pressures for growth, especially those that are listed. When there are no more sources of internal growth, M&A can present itself as a viable strategy to continue expansion. Also, some managers have the self-interest to become emperors in the industry and make as many acquisitions as possible in a show of power.
Goedhart et. al (2010) identify five types of successful acquisitions, namely those that improve the performance of the target company, consolidate companies in the industry in order to remove excess capacity,
buying small companies either to provide them with easier market access, to take advantage of their skills or technologies or simply by betting on future winners in the market. Again, some of these deals are surrounded by a lot of uncertainty and therefore, one should develop a well-planned strategy for value creation. The authors also refer to a roll-up strategy or buying undervalued companies as strategies that may not lead to value creation. The first is easily copied by competitors and the second is not simple to spot, since the company would need to be evaluating the target with better precision than the market.
2.1.3. The Power of Synergies
When several CFOs in the United States were asked about their reasons for M&A deals, a large majority mentioned synergies (37,3%) and diversification (29,3%) as the principal motives. In order to understand such preponderance of this reason for an acquisition, one should start by understanding the meaning of this concept. “Synergy is the additional value that is generated by combining two firms, creating opportunities that would not have been available to these firms operating independently” as Damodaran (2005) considers. In the same working paper, the author categorizes different types of synergies:
Operating Synergies – these will generally lead to higher expected cash flows for the company and can be materialized through economies of scale achieving cost-efficiency, greater pricing
power by reducing competition, combination of different functional strengths or higher growth in new existing markets, mostly in cross-border mergers.
Financial Synergies – these can either lead to higher expected cash flows or lowering the discount rate at which the companies are valued. These synergies can be achieved through the combination of a company with excess cash but narrowed growth opportunities with a company with highly profitable projects but limited cash. Increase the company’s debt capacity and benefit from tax savings are other reasons. Finally, diversification (which is the second reason presented in the survey above mentioned) is also subject of financial synergy as it may lower the discount rate.
But while, managers rely on synergies to justify acquisitions, there is a lot of uncertainty as to whether they actually materialize. Reasons such as exploring new markets or combining functional strengths are so intangible that they should not be considered, once a priori, they cannot be reflected into currency. Moreover, one should not only account for the benefits from potential synergies but also consider the costs the company would incur to achieve them. Ficery et. al (2007) identify six common mistakes related with synergies, the most relevant being the incorrect definition of synergies, either too narrow or too broad and missing the window of opportunity to achieve those synergies, since around three quarters of the value captured from synergies occurs
2.1.4. Cross-Border M&A
With the increased globalization of markets, labour, capital, goods and services are easier to trade. This facilitates investments abroad and companies look for growth, especially in emerging markets where there are attractive opportunities to grow the business. Zenner et. al (2008) identify long and short-term drivers for cross-border M&A as well as possible factors that might reduce this trend. Globalization and geographical diversification increase scale for the firm and afford the opportunity to explore new markets. The trend towards deregulation and the consequent free flow of capital and goods also prospers this trend to look for external markets. From a short-term perspective, high relative equity valuation of target companies predicts growth potential. The authors also mentioned that the weakness of USD makes US-based companies less valuable and investing abroad can reduce that risk. Moreover, sovereign wealth funds have gained relevance in the market and major investments are made overseas in order to offset possible adverse cycles affecting the country. As an example we can take the recent set of investments made by the Chinese Government in companies based in several different countries. However, these short-term factors can change without notice and alter the context in which such deals are made. Also, one should take protectionism laws of the foreign country into account. This issue is especially relevant in emerging markets, where there is a higher degree of uncertainty.
In terms of valuation, it is important to take into account some aspects that may differ due to the nature of a cross-border deal. Froot (1997) refers some aspects such as:
Taxes – countries have different corporate tax rates and regimes. Using the higher corporate tax rate is assumed to be a good conservative assumption. Also, it is important to analyse whether the foreign country offers any type of tax exemptions for international investments and thus account for any effect this might have during the relevant period.
Different Currencies – a cross-border deal may occur with two firms that operate in different currencies. In order to make the valuation one can estimate in the foreign currency FCFF, convert to the domestic currency and obtain the firm value by discounting with a home currency discount rate, accounting for the necessary risk adjustments (country, asset and financial risks). Alternatively, the entire valuation can be performed in the foreign currency. Cash flows, respective discount rate and the final result will then be converted to the domestic currency using a spot foreign exchange rate. Zenner et. al (2008) also present these alternatives and both methods lead to the same result.
Adjusting the valuation for possible additional risk in the foreign country, such as expropriation or inflation risk for instance. This can be achieved by either adding a risk premium to the discount rate (this would assume that this risk is constant over time) or by accounting for these potential risks in the cash flow forecasts. Performing a scenario analysis is also a good practice to analyse these effects.
Chari et. al (2010) analysed acquirer returns three days either side of the announcement day of the deal for developed-market acquirer and emerging-market targets between 1986 and 2006 and concluded that, on average, there is a statistically significant increase of 1,16% in acquirer’s returns compared to developed-market acquirer and target deals.
Although this dissertation analyses a cross-border deal, both companies are based in developed markets, therefore some of the considerations above stated will not be addressed, as for instance, there may be a lower risk exposure due to a lower level of uncertainty.
2.1.5. Methods of Payment and Their Implications
Two common methods of payment can be identified: common stock exchange or cash offers. There is a general agreement in academia regarding the implications of selecting either one of the methods. Usually, mergers are paid for through common stock exchange, while tender offers are transacted with cash, as Travlos (1987) stated in his work. The same author concludes that, upon announcement, the shareholders’ returns on the bidding firm suffer significant losses while cash offer deals do not lead to abnormal rates of return (either positive or negative). A recent study by Hazelkorn et. al (2004) lead to the same conclusion. Moreover, the authors pointed out that in the long term (over a two-year period) “cash-financed acquirers outperformed industry peers by 4,3% while stock-financed acquirers underperformed industry peers by 5,2%”.
Both articles mention the signalling effect of the payment methods. An equity-financed transaction tends to signal overpriced stocks. Also, if the transaction is paid through exchange of stocks, the target company’s shareholders will not only capture the risk of the deal but also, the potential synergies. If the management is certain about the future gains, there is no incentive to share it with other shareholders. On the other hand, a cash offer sends positive signals to the market, since it represents the acquirer's confidence in re-establishing the cash balance as well as confining all the potential gains from the deal to the existing shareholders.
Martynova and Renneboog (2009) consider the acquirer’s financing decision to be driven by the cost of capital and the company will seek the cheapest way of financing and structuring the method of payment taking that into consideration. When there is a cash offer, especially financed through debt, managers tend to have more incentives to benefit from synergies earlier, as it is crucial to repay debt.
2.2. Literature on Valuation
2.2.1. Valuation Techniques
There are several valuation methods that one can use to obtain the value of a company or investment. Damodaran (2002) provides a classification of different approaches to valuation and they are presented as such:
Discounted Cash Flow (DCF) Valuation – Based on the Present Value of an asset or its expected future cash flows. The type of cash flows to be used and the discount rate to be applied are the main differentiators of the different models within this category. Examples:
o Equity Valuation – discounting expected Free Cash Flows to Equity at the cost of Equity. o Firm Valuation – discounting expected Free Cash Flows to the Firm at the weighted
average cost of capital (WACC) or using the Adjusted Present Value (APV), which is a sum of two components: the firm value as if the company was only equity financed plus the present value of tax shields.
Relative Valuation – Valuation of an asset comparing it with similar assets in terms of a variable as, for instance, cash flows, earnings, sales or book value. Examples:
o Price to Cash Flow, Price to Earnings Ratio, Price to Sales, Price to Book Value, Price to Dividend Yield.
Contingent Claim Valuation – Valuation of assets with such characteristics that one can apply the option pricing models. As an example, an oil company can value the option to explore an undeveloped oil reserve. The options vary from firm to firm and it can be applied to either financial or real assets. These options can be valued through the Black and Scholes Model or the Binomial Option Pricing Model.
Young et. al (1999) compared distinct valuation methods and assumed that it is indifferent which model is used as they should all lead to similar values. The authors state that it is possible to identify the assumptions that make the value of a company change from one method to another.
2.2.2. Discounting Cash Flow Valuation
2.2.2.1. Equity Valuation
This model gives the equity value of a firm. It is based on free cash flows to equity (FCFE), which can be seen as the cash flows that the firm can afford to distribute to its shareholders after all the financial obligations, capital expenditures and working capital needs are met. As Koller et. al (2005) state, there is a second way to
compute free cash flows to equity as “dividends plus share repurchases minus new equity issues”, leading to similar values.
It is important to mention that dividends and free cash flows to equity may not be the same. The FCFE represent the cash available to be paid out to stockholders but the firm may be paying more or less dividends to its shareholders. Damodaran (2002) identifies desire for stability in dividends payment, future investment needs and increases in dividends payments as positive signalling effects and likewise, reasons why FCFE and dividends tend to be different in value. Actually, investors expect to have increasing dividend payments over the years. As this dividends policy may influence the analysis of the equity value, using the Dividend Discount Model may be misleading.
2.2.2.2. Firm Valuation using WACC and APV
These two models discount Free Cash Flows to the Firm (FCFF) to their present value but at different discount rates. The FCFF is defined as the sum of cash available to repay all claim holders. Luehrman (1997) provides an example on how to compute the FCFF. In general terms, FCFF is given by EBIT (1- Corporate Tax Rate) plus Depreciation, minus Capital Expenditure, minus Changes in Net Working Capital.
The same author compares the two alternatives to reach the enterprise value. In the WACC-based method, the cash flows are discounted at a weighted average cost of capital (WACC), which incorporates all the financial effects, namely any benefits or costs related with the leverage in the capital structure of the firm. The major drawback off this method is that either the firm has a stable capital structure, or one needs to compute a new discount rate, i.e. a new WACC every period the capital structure is changed, which may be challenging. The formula to compute the WACC is given by:
This way, the portion of debt will be discounted at a cost of debt, accounting also for the tax shields, while the portion of equity will be discounted at the cost of equity.
On the other hand, the APV method consists of the sum of two components: the valuation of the firm as if it was all equity financed, therefore discounting the FCFF at an unlevered cost of capital plus the value of interest tax shields discounted at the cost of debt. In the article, APV is said to be a better tool as it works even when the WACC method cannot be applied. Also, for managerial decisions, APV is richer in information, since the financial effects can be clearly identified from the value of the project/assets of the company itself. This allows managers to understand where value comes from.
2.2.3. Relative Valuation
With this method, a company is valued through a comparison with other similar firms in the market. Damodaran (2002) states that it is necessary to have standardized prices, as it is not possible to simply compare share prices, since companies have different number of shares. Thus, “converting prices into multiples of earnings, book values or sales” is an option to overcome this bias. Goedhart et. al (2005) affirm that performing this comparison with other firms in the market is a good reality check for the necessary assumptions for the forecasting period in the DCF approaches. When there are significant differences in those assumptions, it is possible to verify if either the companies indeed have different performances or if the assumptions are incorrect.
One can compute several multiples as for instance Price to Earnings Ratio, Price to Book Value and Enterprise Value to Sales. One can either estimate the market value of the assets of the firm or the equity value, depending on whether we use price or enterprise value multiples.
The multiples are straightforward and simple to calculate and the value of the company can therefore be easily derived. The main challenge however, is to identify which companies in the market are comparable with the one being valued, i.e. defining the peer group. Kaplan and Ruback (1996) point out three different measures to determine the peer group: comparable company, where the multiple is “calculated from the trading values of firms in the same industry as the firm being valued”; comparable transaction having multiples “from companies that were involved in a similar transaction” and comparable industry transaction, which comprises of multiples of firms from the same industry with similar transactions. Goedhart et. al (2005) suggest the use of companies with “similar expectations for growth and ROIC”.
Liu et. al (2002) provide a ranking of the multiples regarding their proximity to stock prices. They conclude that the multiples with bigger explanatory power are the ones based on forward earnings, historical earnings and cash flow measures. When deciding on the multiples to estimate the value of Roche and Ilumina, these will certainly be taken into account.
Kaplan and Ruback (1996) compare multiples valuation with the discounted cash flow methods and conclude that the DCF approaches perform better. However, the DCF approach would gain explanatory power when combined with the information provided by the multiples valuation.
2.2.4. Contingent Claim Valuation
Through the application of real options, managers can assess whether implementing a new project will be profitable and if so, the appropriate timing. Copeland and Keenan (1998) identify several sectors where real options can be applied, one of which is the pharmaceutical industry. Real options may be useful to valuate R&D projects and define which ones should be applied first. R&D is surrounded by technological uncertainty (whether or not the outcome will lead to a new product) as well as market uncertainty (whether or not there will be demand for that new product). The authors, however, maintain that attempts to apply real options are still too
simplistic to provide relevant results. Nevertheless, in a strategic sense, this is a good method to understand the uncertainties faced by the firms when deciding to embrace new projects.
2.2.5. Putting It to Practice
When developing the deal valuation, some estimates will need to be made. In this section of the Literature Review, the major issues for estimating cash flows and computing the discount rates necessary for the valuation of the Roche & Ilumina deal will be addressed.
2.2.5.1. Estimating CF
In order to use the WACC and APV methods, it is necessary to first calculate the Free Cash Flows to the Firm (FCFF), as already mentioned. The formula to calculate it is as follows:
The cash flows are computed each year while the company’s performance varies. After a few years (three to ten years in general), the steady state is assumed and FCFF are assumed to be a perpetuity with or without a certain yearly growth rate. This final year of estimation is called the Terminal Value and is given by:
Young et. al (1999) consider terminal value to be “by far the most important element in any valuation estimate”. In fact, as the explicit period (first years of estimates) represents only few years, at the end, terminal value will represent about 80% to 90% of the market value estimate. Regarding the terminal value, expected growth can be estimated by multiplying the firm’s reinvestment rate by the return on capital as Damodaran (2002) states. Moreover, Kaplan and Ruback (1996) assume that in the terminal value period capital expenditures (CAPEX) should be at least as large as depreciation and amortization, once it is assumed to be a growing perpetuity.
As this dissertation is based on a cross-border deal, special factors are to be taken into account. The firms have their accounts in two different currencies and the tax rates are different. These issues were already addressed in the Cross-Border M&A section.
2.2.5.2. Compute the Discount Rates
Once the cash flows are computed, the next step is to obtain the present value of the firm. In order to do so, it is necessary to use a suitable discount rate. This rate will depend on the valuation method that is used. As for the WACC method, one must compute the cost of equity (levered) and the cost of debt. For the APV methodology, the unlevered cost of equity and the cost of debt are necessary.
Cost of Equity
There are several asset-pricing models useful to estimate the cost of equity of a firm. These models determine the expected return on a company’s stock that would compensate the risk assumed by the investor. Koller et. al (2005) identify three models as the most commonly used – Capital Asset Pricing Model (CAPM), Fama-French Three-Factor Model and Arbitrage Pricing Theory (APT).
CAPM
This model was first developed by William Sharpe in 1964. The author outlines that an investor will demand a return that represents the sum of the return on a risk-free rate plus an additional premium to compensate for the risk exposure. “In effect, the market presents him [the investor] with two prices: the price of
time, or the pure interest rate and the price of risk, the expected return per unit of risk borne” mentioned Sharpe
(1964).
The cost of equity can be computed as:
Where:
– Expected return on a stock of company i. – Risk-free rate.
– Beta of company i – stock’s covariance with the market. – Expected return on the market index.
Moreover, the difference between the expected return on the market index and the risk-free rate represents the Equity Risk Premium. It can be seen as the outperformance of risky assets over a risk-free asset, leading again to the idea of a premium to compensate for risk.
Therefore, one needs to determine the risk-free rate, the beta for the company and the equity risk premium in order to come up with an estimate for the cost of equity.
Risk-free rate – to estimate the , the common practice is to consider government bonds with no default risk. Koller et. al (2005) identify the 10-year US government bond as a good proxy for the risk-free rate in the valuation of US based companies, while the 10-year German Eurobond is
suggested for the valuation of European companies. In the case of this thesis, the 10-year Swiss government bond can be used to value Roche, since this asset is also stable and riskless.
Beta – in order to compute the beta, a regression of the stock’s returns against the market’s returns is performed. Beta is given by the covariance between the firm and the market. According to Koller et. al (2005), “company stock returns should be regressed against a value-weighted, well diversified portfolio, such as the S&P 500 or MSCI World Index”. In order to improve the beta estimate, one should look at the betas for similar companies in the same industry. When computing the beta, the effect of the company’s leverage is incorporated. One can determine the unlevered beta (accounting only for operating risks) with the following relationship:
( )
As a final consideration, depending on the valuation method, the levered (WACC) or unlevered (APV) cost of equity will be computed. In order to do so, it is necessary to match the cost of equity with the corresponding beta, i.e. for levered cost of equity, one must use the levered beta and the same applies for the unlevered.
Equity Risk Premium – There are several methods to estimate the Equity Risk Premium. Damadoran (2012) identify three common practices: obtain the market expectations by surveying investors and managers; use the historical premium as a proxy for the future; estimate an implied premium by looking at the market rates and prices on the assets today. The author suggests that the best approach for valuation is to use the implied equity risk premium, since this was the approach with the best predictive power. As already mentioned in the Cross-border M&A topic, one should account for an additional country risk premium when considering less stable markets. Moreover, when valuing a global company, one can use a global equity index as for instance the Morgan Stanley Capital Index (MSCI) to determine the Equity Risk Premium.
Fama-French Three-Factor Model and APT
Fama and French (1996) presented a model that is able to overcome some anomalies in the CAPM. According to the authors, “average returns on common stocks are related to firm characteristics like size, earnings/price, cash flow/price, book-to-market equity, past sales growth, long-term past return, and short-term past return”. The Three-Factor model is given by the following regression:
Where SMB and HML correspond to the difference between the return on two portfolios, respectively, small stocks minus big stocks (SMB) and high book-to-market stocks minus low book-to-market stocks (HML). The first factor is the equity risk premium as already seen in the CAPM model.
The APT can be seen as a generalized version of the Fama-French model. Generally, the logic applied is similar, but this model has k factors, as much as the considered relevant to determine the excess return on a company’s stocks. Koller et. al (2005) consider this model to be too theoretical and of difficult implementation as “there is little agreement about how many factors there are, what the factors represent, or how to measure the factors”.
Cost of Debt
A good proxy for the cost of debt of a firm is its yield to maturity on long-term, highly liquid, option-free bonds (Koller et. al 2005). However, this rate is a promised rate and thus it may not be the most suitable one to discount expected cash flows. The authors state that this proxy is applicable for companies with an investment-grade debt of BBB or better.
In other situations, one should use the bond ratings provided by the rating agencies, as for instance S&P or Moody’s and add up the respective spread to the risk-free rate. Damodaran (2002) provides a third perspective where the interest coverage ratio (EBIT/Interest Expenses) of the firm is computed and compared with the ratios of rated firms, applying a spread based on the spread of those firms.
37.058 32.794 10.415 9.737 2010 2011 Pharmaceuticals Diagnostics 37% 25% 12% 26%
Fig.1 - Pharmaceuticals - % Sales by Region (2011) US Western Europe Japan International 50% 18% 32%
Fig.2 - Diagnostics - % Sales by Region (2011) EMEA
North America Rest of the World
3. Roche, Illumina and Industry Review
3.1. Roche
Fritz Hoffmann-La Roche founded the company in 1896 with the same vision that guides Roche today – manufacturing high quality drugs and to distribute them internationally. By 1912, Roche had already expanded it business on three continents, across nine different countries. Currently, Roche operates in more than 150 countries. The company has been growing through several acquisitions of innovative companies that, through time, allowed Roche to develop its products and being in the edge of innovation. Roche employs around 80,000 people worldwide.
The company’s operations can be segmented into two different areas: pharmaceuticals and diagnostics. Within each area there are smaller divisions, being the pharmaceuticals area divided into three fields: Roche Pharmaceuticals, Genentech and Chugai; and the diagnostics area has five distinct fields: Applied Science, Diabetes Care, Molecular Diagnostics, Tissue Diagnosis and Professional Diagnostics. In general terms, Roche is a producer and developer of drugs for the treatment of several diseases and it also develops diagnostic instruments for the detection, prevention and treatment of patients. In terms of R&D, the company focuses its efforts in therapeutic areas such as oncology, virology, inflammation, metabolic disorders, and central nervous system. Roche has its operations spread worldwide. According to each segment there is a different division as it is possible to see in the charts below.
The North American and European markets are at utmost importance for the company. As a matter of fact, 37% of the Pharmaceuticals Segment Sales are for the US market followed by Western Europe (Fig.1). For the Diagnostics Segment Sales, 50% of sales are for the EMEA (Europe, the Middle East and Africa) market (Fig.2).
Since 2009, the total amount of sales has declined being this value equal to 42.531 million CHF in 2011 (Fig.3). This represents a 10% decrease when comparing with the 47.473 million CHF in 2010, which was already reflecting a 3% decline
relevance in the total business, increasing its weight on total sales from 20,5% in 2009 to 22,9% in 2011.
Another important issue is the fact that the cost of sales has been falling through time (Fig.4). One of the factors leading to this reduction is the decrease in royalties payments, which expire through time. Nevertheless, when looking at the company’s annual report, it is stated that sales actually grew 1% at Constant Exchange Rates, however as the Swiss Franc has been strengthening against other currencies, it impacted severely the results. When comparing cost of Sales relatively to total sales, the ratio has been quite stable, albeit with a decreasing trend. In this account, there is no impact of exchange rates, mostly because Roche has the majority of its cost base allocated outside Switzerland.
3.2. Illumina
Illumina was founded in 1998 by David Walt, Larry Bock, John Stuelpnagel, Anthony Czarnik, Mark Chee – a group of scientific experts and venture capital investors. The company went public in 2000. This innovative company offers products and services for the analysis of genetic variation and function. In 2002, Illumina launched its first system – Illumina BeadLab. In 2007, it was named the fastest growing high-tech company by Forbes. Currently, its portfolio has more than 10 instruments and assays available to address state of the art disease research, drugs development, molecular tests and genetics analysis.
Illumina’s operations are divided in two segments: Life Sciences and Diagnostics. The Life Sciences segment comprises all products and services related with the research market, while the Diagnostics segment explores the molecular diagnostics field. So far, the Diagnostics segment represented a very small percentage of the operations and the company presents its results as a whole. According to the company’s most recent annual report (2012), the results of the operations will be reported in two segments once the Diagnostics segment represents more than 10% of revenues, operating profit or loss, or assets of the total business.
The company sells its products and services in North America, Europe and Asia-Pacific regions, its customers in general are academic and government research centres, pharmaceutical and biotechnology companies. As of the beginning of 2012, the company employed around 2,200 people.
13.661 14.615 13.293 11.942 31.956 34.436 34.180
30.589
2008 2009 2010 2011
Fig.4 - Evolution of Sales and Cost of Sales
Total Sales (m. CHF) Cost of Sales (as % Sales) CAGR (%) = -1,74% CAGR (%) = -3,31%
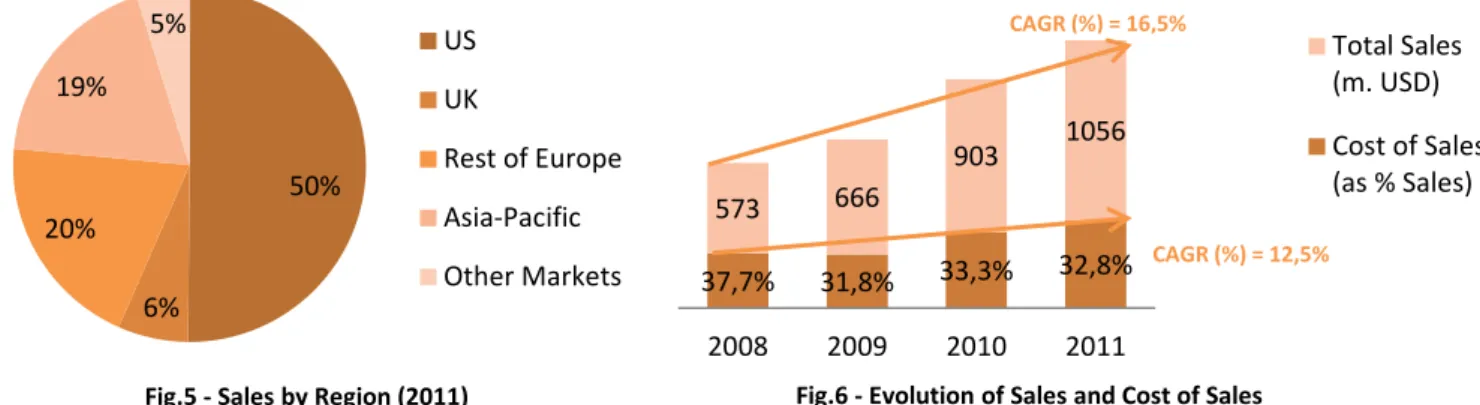
50%
6% 20%
19% 5%
Fig.5 - Sales by Region (2011) US UK
Rest of Europe Asia-Pacific Other Markets
In Fig.5 one can simply deduce that the US market is the most important one for the company, representing 50% of total sales. Moreover, if we add up the UK and Rest of Europe markets, these will represent three quarters of total sales. Since 2008, total sales have been increasing (Fig.6), representing a CAGR of 16,5% for this period. Consequently, the total cost of sales also increased, but when analysing in relative terms, the cost of sales represent around 30% of total sales. In 2011, there was a slightly improvement in this ratio when comparing with 2010 (from 33,3% to 32,8% of sales).
3.3. Industry Review
Both companies’ businesses belong to the healthcare sector, although in different industries. Roche’s business is within the pharmaceuticals industry while Illumina has Life Science Tools as its core industry.
3.3.1. Pharmaceuticals
According to IMS Health, the world market for pharmaceuticals represented $ 856 bn in 2010. This market has been growing for the past few years. Since 2003, the annual growth rate has been around 7%. Geographically, North America and Europe represent the largest markets, as it is possible to see in Fig.7, where these markets together represent more than 50% of the total market size.
Fig. 7 – Pharmaceuticals Market Size and growth estimates
Source: IMS Health Market Prognosis(Mar’11)
2010 (bn USD) Market Size by Region (%) 2006-2010 CAGR % 2011 % Growth (Estimate) 2011-2015 CAGR % (Estimate)
Total Market Size $ 856,4 - 6,2% 4 - 5% 3 - 6%
North America $ 334,7 39,1% 4,6% 2 - 3% 0 - 3% Europe $ 245,3 28,6% 5,6% 2 - 3% 2 - 5% Asia/Africa/Australia $ 126,5 14,8% 14,5% 12 - 13% 11 - 14% Japan $ 96,5 11,3% 2,6% 5 - 6% 2 - 5% 37,7% 31,8% 33,3% 32,8% 573 666 903 1056 2008 2009 2010 2011
Fig.6 - Evolution of Sales and Cost of Sales
Total Sales (m. USD) Cost of Sales (as % Sales) CAGR (%) = 16,5% CAGR (%) = 12,5%
Nevertheless, it is noteworthy to observe that for the past few years, the Asia/Africa/Australia and Latin American markets have experienced higher growth rates, this being a trend expected to continue in the future with predicted CAGR between 11% and 14% for these markets for the period 2011-2015.
The Pharmaceuticals industry is very fragmented. Pfizer’s sales represent 7% of total sales and this is the company with higher market share. Actually, the Top 10 companies, in terms of sales, represent roughly 45% of total market share. Roche is positioned in 7th place having a 4,17% market share. In such a fragmented and competitive industry, it is important to understand what drives growth. There are several important factors worthy of mention:
Exposure to Patent Expiration – loss of market exclusivity leads to higher competition and tougher commercial conditions. Therefore, patent expiration is a major issue for companies and it is necessary to have a forward looking approach to this fact, since it will have a negative impact for the companies losing their patent rights, declining revenues in the future.
Expansion of Emerging Markets Portfolio – diversification into emerging markets is key to success, not only due to the growth potential of this ascending market but also to overcome patents expiration in western countries, along with the austerity measures that have slowed down the healthcare spending. The rise of a middle-class in emerging markets, with higher income levels, will allow families to spend more on healthcare and additionally governments can invest more in providing better health services and products. Therefore, companies should not miss out on this opportunity for growth.
Barriers to Generic competition – with the expiration of patents, there is a fiercer competition from generic products. Nevertheless, the legal and regulatory requirements may delay the process, especially in areas related to biologics, respiratory devices and vaccines, creating higher barriers to entry. Thus, companies should analyse their portfolios in order to understand how generic products may affect their business.
Value-creating innovation – investing in R&D does not immediately translate into new products. Achieving success in developing new medicines, passing through all the regulatory requirements and launching them in the market is what generates value. Thus, what is important is not the number of pipeline assets that a company has, but which of them can translate into value-added products. 0,00% 1,00% 2,00% 3,00% 4,00% 5,00% 6,00% 7,00% 8,00%
Fig.8 - Share of the Top 10 Pharmaceutical Companies in Total Sales
Source: IMS Health Midas, Dec. 2010
Concerning the current economic situation, there are two other important factors to take into account, from the Government and Institutions perspectives and also from the patients perspectives. The austerity measures, translated in this case by Healthcare budget cuts, have an impact on R&D investment, expenditure on medicines and the purchase of state-of-the art technology for Health Institutions. On the other hand, there is an increasing elasticity of demand, since patients may have lower purchasing power and be more price-sensitive.
3.3.2. Life Science Tools
This industry is highly fragmented as it is possible to identify in Fig.9, although four major players can be distinguished by their higher market shares (Thermo Fisher Scientific, Quest Diagnostics, Agilent Technologies and
LabCorp).
According to a Goldman Sachs Equity Research, Life Science Tools was the worst-performing industry in the healthcare sector, mostly due to the concerns around austerity measures that have impact on academic and government funding. Nevertheless, in 2012, this industry was the second best performer as these concerns are slightly fading away, as R&D funding recovers, and there is a positive expectation for future funding. In the US the debate still goes on regarding the budget for the National Institute of Health (the uncertainty will endure until a final decision is reached). However, in an election year, there is a higher likelihood for no or low cuts in the budget. In the EU, the funding has been quite stable in regions such as UK, Germany and Scandinavia. Finally, China is seen as a key country for the development of this industry as the government intends to increase its R&D investment (from 1,5% of GDP currently to 2,5% by 2020).
21,9%
14,0% 12,5% 10,4%
7,0%
4,7% 4,5% 4,3% 3,7% 3,5% 3,4% 3,1% 2,2% 2,0% 2,9%
Fig.9 - Market Share in the Life Science Tools Industry in terms of Total Sales
Source: Goldman Sachs Equity Research on Medical Technology (2011)
Similarly to the Pharmaceuticals industry, key growth drivers are related to government and academic spending in R&D, new products adoption (value-creating innovation), expansion into emerging markets (higher
growth perspectives) and pricing (important factor in a such fragmented market).
Moreover, Life Science Tools is a cyclical industry with a high correlation between its organic growth and global GDP growth (R2 = 73% according to Goldman Sachs). Fig.10 shows the comparison between Global GDP growth and Life Science Tools growth and generally, the industry growth follows GDP growth, albeit with a higher degree of volatility. This makes total sense, as this industry, as well as the entire sector, relies so much on R&D spending, which is also cyclical alongside the market.
To conclude, there is on one hand, a mature and competitive market such as pharmaceuticals and on the other hand, a market highly fragmented, still developing and facing a downturn due to the dependence on R&D investments which have been affected by the government budget cuts for that purpose. After gaining some knowledge about the context, the following step is to proceed for the valuation of the companies and the deal itself.
Fig.10 – Comparison of Global GDP growth and Life Science Tools organic growth
Source: Goldman Sachs Equity Research on Life Science Tools and Diagnostics (2012)
4. Valuation
In this chapter, the quantitative analysis of the proposed deal will be addressed. The first step is to make a standalone valuation of the target company (Illumina) in order to reach a fair price of the company before accounting for any synergies from the merger. Since the announcement of the offer in January of 2012, the valuation of Illumina will be carried out as of December of 2011, i.e. a pre-bid date.
The same will apply for Roche’s valuation, which will lead to the second step – the standalone valuation of the acquirer company. It is important to compute the fair price of Roche, so that one can arrive at the value of the merged entity. This step will comprise of two phases. In the first instance, both firms’ values are summed up and subsequently, the synergies are incorporated into the valuation. The difference between these two values will infer the synergy value.
These valuations are based on the data available from the companies’ reports obtained from their respective websites, Damodaran’s and Reuters’ websites and Equity Research studies from Goldman Sachs and Morgan Stanley.
4.1. Standalone Valuation of Illumina
In order to identify a price target for the firm, Illumina will be valued using the WACC method. Being a younger firm, Illumina is still in its growth phase, experiencing high volatility in relation to its margins. The decision to choose between a valuation method that uses FCFE or FCFF was relatively simple and is related to the fact that the company has no dividends distribution and there is no intention to do so in the forthcoming years. Also, its stock repurchases policy has been quite unstable throughout past years, which makes it difficult to set a trend and forecast future free cash flows to equity. Moreover, the company has been issuing convertible senior notes that give investors the option to convert their rights into shares. Thus, the FCFF approach will be considered.
In this section, the main assumptions regarding the forecast of Cash Flows will be addressed as well as the assumptions to compute the WACC value (rates and capital structure).
4.1.1. Main Assumptions
Sales Growth
This is, undoubtedly, the most important assumption to make, since the majority of figures will be forecasted based on a relationship with revenues. In the past few years, Illumina has faced a CAGR of 16,5%.
high rate, Illumina would have to be launching new successful products every two years, which may be an excessively optimistic view.
According to a market forecast in the Biotechnology industry from BCC Research, a 13,6% CAGR for the global market is expected for the next years. Yahoo Finance presents a figure of 17,9% as the growth rate estimate for Illumina and a 13,5% growth for the industry. Nevertheless, one has to understand the challenges that Illumina will be facing, especially over the next two years. The Budget Control Act affects the funding for academic and government institutions. The National Institute of Health (NIH), one of the most preponderant clients is no exception. As 80% of Illumina’s customer base is subject to these budget cuts, it may impact the firm’s ability to meet the expected sales growth rates. Thus, one should consider a more conservative figure.
A research from Morgan Stanley assumes budget cuts of approximately 3,5% in 2012 and 5% in 2013. This will have impact on the US customer base. However, the management team assumes that Illumina will suffer no impact from these budget cuts, which is doubtful. In Europe, there may be some cuts as well but with a lesser impact, while in other regions, the reverse situation may occur whereby funding tends to increase, especially when it concerns healthcare-related government and academic institutions.
Other factors that may drive sales growth rates are the development and the launch of new lines, as well as the changes in the product mix. The MiSeq, launched in the third quarter of 2011, and HiSeq 2500 whose release to the market is expected to start in the second half of 2012 are new sequencing instruments that will allow the development of studies of the human genome in less time and at a lower cost, which will therefore be very appealing to the market. These products will drive down the Microarray business as they work as substitutes to those devices. With this change in the product mix, there will be a positive effect in the gross margin as the sequencing products have higher margins.
Taking all this information into consideration and the fact that the company does not provide any figures of sales breakdown per product or region, the most conservative estimate of 13,6% growth was taken as a basis and relying on the information provided by Morgan Stanley on the End Market Mix distribution of Illumina (Fig.11), a weighted average growth rate was computed for each year, accounting for the expected 3,5% and 5% budget cuts affecting the sales growth for the “Academic/Govt” and “NIH” customers (Fig.12). For the Terminal
Fig.11 – End Market Mix of Illumina. Source: Morgan Stanley Research
90% 7% 3%
Fig. 13 - Cost of Sales Breakdown
Cost of Product Revenue Cost of Service and Other Revenue Amortization of Acquired Intangible Assets
Value, the average of the estimated periods’ growth rates is assumed, leading to a value equal to 10,5%, defending the idea that the company will not have a high growth forever and when it reaches a certain maturity, lower growth rates will occur.
g (%) Weights 2012 2013 2014 2015 2016
NIH and Govt 80% 10,1% 8,6% 9,6% 10,6% 10,5%
Others 20% 13,6% 13,6% 13,6% 13,6% 10,5%
Weighted Average 10,8% 9,6% 10,4% 11,2% 10,5%
Fig.12 – Sales growth rate assumptions for Illumina
Cost of Sales
For the past three years, the average ratio of cost of sales as a percentage of revenues was equal to 32,6%. On October 2011, the company implemented a restructuring plan with the objective of reducing workforce by 8% and consolidation of facilities. Besides the restructuring plan, the change in the product mix will lead to lower costs as sequencing products and its consumables have a lower production cost. When looking at the costs breakdown per category (Fig.13), it is fairly easy to deduct that the production cost and the cost of buying the raw material for that production (cost of product revenue) represent the major bulk of this account. Although no target is specifically defined by the administration, a gradually 1,6% improvement in the cost of sales/sales ratio will be assumed, therefore, the target for 2016 will be 31%. As mentioned before, this improvement in the ratio will be progressive, thus it is expected that the major improvements will occur in the first years, implying a gross margin enhancement. Comparing the figures from 2011 with 2016, there is a 2% increase in the gross margin.
R&D
This account will be impacted by two distinct factors already mentioned above. On one hand, the restructuring plan and the acquired expertise will allow Illumina to invest less and maintain the performance. On
Income Taxes
The management team states that the current figure for the tax rate will diminish in the following years, thus, from a conservative perspective a slight decrease of the tax rate to 34% will be assumed, less 0,6% than the average from the past three years.
Depreciation and Capital Expenditures
In order to forecast the values for Depreciation and Capital Expenditures (CAPEX), a ratio of those accounts over non-current assets of the previous year was calculated. The past years average led to the figures of 10,5% for Depreciation and 12,3% for CAPEX. In this phase, it is important to understand whether this value is reasonable for future forecasts. Given the fact that the company is still in its growth phase, the CAPEX rate has to be higher than the depreciation rate. As the company moves to the long-run, there are fewer investments and in a steady state situation, CAPEX is equal to depreciation as investments are to replace worn out capital stock.
Net Working Capital
Net Working Capital (NWC) for each year was calculated with the following formula:
Then, the changes in net working capital that figure in the Cash Flow Statement were calculated through:
Capital Structure
Although the management does not specifically mention the company’s future perspectives regarding its capital structure, it is stated that the company has set up a hedge strategy on the convertible senior notes in order to avoid dilution and a consequent change in the capital structure. Therefore, it will be assumed that the company does not intend to change its D/E ratio. For the calculation of this ratio, Net Debt will be considered as
Long-term Debt + Short-term Debt – cash. In Illumina’s case, the value assumed as a target capital structure was
Discount Rates
For the DCF valuation, the weighted average cost of capital (WACC) should be calculated. As previously mentioned above, its formula is given by
Therefore, some assumptions have to be made in order to reach an estimate. Taking into consideration the literature review, the cost of equity ( was calculated using the CAPM method and the cost of debt ( was calculated with Damodaran’s ranking based on the interest coverage ratio of the company. The capital structure was already mentioned above. In order to reach those discount rates, the following data were used:
Risk-free rate – the 10-years rate for the treasury bond of the US government as of 1st of December 2011 was considered as the riskless asset.
Beta – Damodaran provides an unlevered beta for the biotechnology industry (Global) equal to 1,24. Reuters has a beta value specifically for the company (0,58), which is significantly lower than the figure presented by Damodaran. Since this is a more specific value, concerning Illumina individually, it was assumed that the Reuters value for beta should be used, as Damadoran’s figure might be too generic. In order to obtain the levered beta for the company, the target D/E ratio was used.
Equity Risk Premium (ERP) – Damodaran’s estimate for the US was utilised. It is not considered a specific country risk premium. On one hand, the company is based in the US where it retains 50% of its customer base; on the other hand, Illumina has a diversified portfolio globally, which diminishes the international risk exposure to other countries as well.
Cost of debt – the interest coverage ratio (EBIT/Interest Expenses) was calculated and a credit ranking was attributed to Illumina according to Damodaran’s ranking. Illumina’s debt is ranked with an A-, which implies a premium 1,65% over the risk-free rate, which implies a cost of debt equal to 3.76%.
Terminal Value
For the terminal value, the most difficult matter is to determine when this company will exit its growth phase. Assuming that in the future, when a company is in a stable phase, it does not surpass the economy’s growth rate, a forecast for GDP growth from the Global Economic Outlook study by The Conference Board was taken into consideration. For the period of 2007-2025 the expected GDP growth for Advanced Economies and
4.1.2. Results
After assuming a conservative estimate in all instances, the valuation led to a final price per share of $41,18, which compared to the share price of $30,48 in the stock market on the 30th of December of 2011, represents 35,1% upside potential. This would lead to the conclusion that the shares may be undervalued in the market. One should bear in mind the fact that the main points of uncertainty are related to the R&D pipeline and the ability to launch successful new products, which, if the company continues to strive to grow through this strategy, there may be even higher upside potential. Accounting for the 139 million shares outstanding, the equity value for Illumina is $5.721,88 mn (Appendix 3).
Sensitivity Analysis
In order to consider an interval for Illumina’s Equity Value, a sensitivity analysis was performed by changing two variables – Operating Margin and Expected Growth for the Terminal Value. Changes were made regarding the results from the Base Case. A Bull and Bear perspective were assumed.
Bull Case – Operating Margin is assumed to be 2,5% superior against the base case. For instance, for the last estimated year (2016) the operating margin will be 29% instead of base case’s 26,5%. It considers that there will be a strong demand for Illumina’s products and/or costs reductions will be even more effective. The terminal value growth rate adds 0,25% against the Base Case, assuming a higher impact of the superior growth rates from emerging markets.
Bear Case – Operating Margin is assumed to have the inverse impact of the Bull Case, thus, being lower in 2,5% against the Bear Case. This case defends the eventuality that Illumina’s products are rejected by the market and/or that there were no additional costs reductions resulting from the restructuring plan. For the terminal value growth rate, the Advanced Economies growth was assumed. This figure is equal to 1,9%.
Taking into consideration these two scenarios, Illumina’s Share Price range from $33,65 to $48,99, representing an upside potential between 10,4% and 60,7% against the $30,48 share price as of the 30th of December 2011.
Share Price Variation in the last year
The market share price for Illumina from 30th of December 2011 up until one year back, ranged from $25,96 and $77,88. The estimated prices fit within the range, but as there is a high volatility in the prices, there is no strong conclusion to take out of these figures.
Multiples Valuation
After defining a comparable peer group, the average and median multiples of Price/Sales, EV/Sales and EV/EBITDA were computed (Fig.14), including and excluding Illumina in the sample. The final result lead to share prices between $14 and 31$.
Nevertheless, it is important to take into account the specificity of this industry, where companies are not absolutely comparable. The core product/technology being sold is differentiated across companies and the growth expectations differ a lot as well. The company that, at each moment, is providing the state-of-the-art technology is the one that has the competitive advantage, being that reflected in the share price. Illumina has a unique technology that cannot be copied by competitors so far, and this may drive its price up in the market.
Fig.14 - Multiples Valuation for Illumina
Firm Market Cap. EV Sales EBITDA Price/Sales EV/Sales EV/EBITDA
Illumina 3530,20 2947,50 1066,80 244,60 3,31 2,76 12,05 Luminex 894,00 780,30 177,70 20,10 5,03 4,39 38,82 Agilent 12096,90 11588,90 6615,00 768,00 1,83 1,75 15,09 Thermo Fisher 17253,30 18464,40 11373,40 2464,00 1,52 1,62 7,49 Qiagen 3207,40 3145,90 1121,30 331,30 2,86 2,81 9,50 Perkinelmer 2219,90 2226,10 1851,10 322,50 1,20 1,20 6,90 Life Technologies 7176,80 9397,30 3703,40 1154,90 1,94 2,54 8,14 Affymetrix 294,60 354,30 287,30 17,00 1,03 1,23 20,84
Average (inc. Illumina) 2,34 2,29 14,85
Median (inc. Illumina) 1,88 2,14 10,77
Average (exc. Illumina) 2,20 2,22 15,25
Median (exc. Illumina) 1,83 1,75 9,50
4.2. Standalone Valuation of Roche
A second step in this valuation chapter is to perform the valuation of the acquirer company so that, in a third stage, both companies’ values are aggregated, enabling us to arrive at a merged entity, which will then incorporate the appropriate synergies of such deal. It is important to take into consideration that, in order to merge both companies, their income statement, balance sheet and cash flow statement must be as similar as possible, thus Roche statements will follow Illumina’s and therefore, some accounts that were originally separated in the annual report, were grouped and renamed.