ABSTRACT
http://dx.doi.org/10.1590/1678-775720140483
Early osseointegration driven by the surface
chemistry and wettability of dental implants
Suelen Cristina SARTORETTO1, Adriana Terezinha Neves Novellino ALVES1, Rodrigo Figueiredo Britto RESENDE1, José CALASANS-MAIA2, José Mauro GRANJEIRO3,4, Mônica Diuana CALASANS-MAIA4
1- Graduate Program in Dentistry, Fluminense Federal University, Niteroi, RJ, Brazil. 2- Orthodontics Department, Fluminense Federal University, Niteroi, RJ, Brazil. 3- National Institute of Metrology, Quality and Technology, Duque de Caxias, RJ, Brazil.
4- Dental Clinical Research Center, Dentistry School, Fluminense Federal University, Niteroi, Rio de Janeiro, Brazil.
Corresponding address: Suelen Cristina Sartoretto - Rua Mario Santos Braga, 28/3˚ andar - Center - Niteroi - RJ - Brazil - 24020-140 - Phone: +55 (21) 2629-9803 - Fax: +55 (21) 2629-9803 - e-mail: [email protected]
Submitted: November 24, 2014 - Modiication: March 29, 2015 - Accepted: April 6, 2015
O
bjective: The objective of this study was to investigate the impact of two different commercially available dental implants on osseointegration. The surfaces were: sandblasting and acid etching (Group 1) and sandblasting and acid etching, then maintained in an isotonic solution of 0.9% sodium chloride (Group 2). Material and Methods: X-ray photoelectron spectroscopy (XPS) was employed for surface chemistry analysis. Surface morphology and topography was investigated by scanning electron microscopy (SEM) and confocal microscopy (CM), respectively. Contact angle analysis (CAA) was employed for wetting evaluation. Bone-implant-contact (BIC) and bone area fraction occupied (BAFO) analysis were performed on thin sections (30 μm) 14 and 28 days after the installation of 10 implants from each group (n=20) in rabbits’ tibias. Statistical analysis was performed by ANOVA at the 95% level of signiicance considering implantation time and implant surface as independent variables. Results: Group 2 showed 3-fold less carbon on the surface and a markedly enhanced hydrophilicity compared to Group 1 but a similar surface roughness (p>0.05). BIC and BAFO levels in Group 2 at 14 days were similar to those in Group 1 at 28 days. After 28 days of installation, BIC and BAFO measurements of Group 2 were approximately 1.5-fold greater than in Group 1 (p<0.05). Conclusion: The surface chemistry and wettability implants of Group 2 accelerate osseointegration and increase the area of the bone-to-implant interface when compared to those of Group 1.Keywords: Dental implants. Surface properties. Wettability. Osseointegration. Rabbits.
INTRODUCTION
Implants, when in contact with the biological environment, are characterized by dynamic changes in their surface properties. Interaction between the tissues and the implant surfaces began immediately after the placement of the biomaterial in the body, and has been a challenge for scientists to increase the implant’s biocompatibility and osteoconductivity12.
Also, it has been dificult to determine the optimal modiication required to accelerate the biological
events that lead to more rapid osseointegration6.
The cascade of reactions that occurs between the biological environment and the biomaterial, this
leads to the formation of a bioilm, which modulates
the host’s cellular responses. This event involves the blood clotting and the implant, with a thin layer of serum protein, which progresses to the granulation tissue, followed by immature woven bone1. The
bone formation begins early, during the irst week,
through the promotion of osteoblast differentiation, production of osteogenic factors, cytokines and growth factors27. The primary bone that includes
trabecular of woven bone is substituted by
parallel-ibered and/or lamellar bone and marrow. Between 1
and 2 weeks, the bone tissue responsible for primary mechanical stability of the device, immediately lateral to the implant region, is resorbed and substituted by newly formed bone1.
time without compromising osseointegration is a topic of particular interest in dentistry27. It is
important to consider that the human body needs a minimum amount of time to perform reactions that result in osseointegration8. Early osseointegration
provides the basis for current treatment protocols, for example, the immediate loading of dental implants consists of implant loading until 1 week after implant placement and early loading of dental implants consists of functions after 1 week and until 2 months after placement26.
The surface properties of dental implants appear to be one of the parameters affecting the speed of osseointegration, becoming an interesting alternative to enhance the bone-to-implant interface and improve osseointegration29.
The modiication of dental implant surfaces often
involves physical and topographical features at the micro and nanoscale, such as coating, roughness, porosity, patterning and fractal architecture. Additionally, changes in the chemical composition at the surface by plasma21 treatment or by oxidization5
affects osseo integration. Among the properties exhibited by dental implant’s surfaces, several manuscripts have presented the properties exhibited by dental implant surfaces affecting osseointegration, such as, morphology8, topography28, roughness16,
chemical and surface composition22, surface
energy30, and hydrophilicity (or wettability)25.
Moreover, there is an interaction between multiple factors that might interfere with the stability of the implants and, consequently, in the maintenance of osseointegration. For example, the dimensions and the shape of the implant, bone quality, surgical procedures and the loading conditions8.
The implant surface energy is an important factor for regulating osteogenesis. Depending on the surface energy, a hydrophilic or hydrophobic surface could prevail18. Generally, when the implant
surface is positively charged, the surface becomes hydrophilic, and some of the plasma proteins essential for establishing the initial osteogenic interactions adsorb to hydrophilic surfaces11.
Hydrophilicity is a property that has gained increasing interest as a factor that affects the osseointegration of dental implants17. Hydrophilicity
presents major advantages during the initial stages of wound healing and during the cascade of events that occurs during osseointegration, facilitating bone integration4. Studies suggest that osteoblasts
cultured in chemically pure and hydrophilic surfaces express higher levels of differentiation markers such as alkaline phosphatase and osteocalcin when compared to hydrophobic surfaces30. Additionally,
animal4 and clinical studies12 support the positive
effect of hydrophilicity on osseointegration by
signiicant improvements in bone-implant contact
(BIC) and bone anchorage during the early stages
of bone healing.
Physical and chemical changes in the surfaces of dental implants enhance the surfaces’ hydrophilicity. A hydrophilic implant exhibits a reduced carbon concentration, which results in an increase in the amount of oxygen on its surface24. Theoretically,
an oxide surface is hydrophilic, and when it binds structurally to water, -OH and -O2 groups are formed on its outermost layer23. Another hypothesis is
that the formation of a hydroxylated oxide surface enhances reactivity toward the surrounding ions,
amino acids and proteins in the tissue luid.
The global implant market show a number of similar products alleging to have the “best” physico-chemical, biological and clinical properties4,12,13.
However, the regulators and professionals must
have evidence showing the safety and eficacy of
them through standardized protocols, to reduce
controversy and the use of ineficient products.
Therefore, this study aimed to investigate the impact of the surface properties of new commercially available dental implants on osseointegration, through surface chemistry, morphology, topography, and wetting analysis and a histomorphometric evaluation of bone-implant-contact (BIC) and bone area fraction occupied (BAFO).
MATERIAL AND METHODS
Implants: Two groups of Grade 4 titanium
dental implants, Titamax, morse taper junction - CM, (Neodent, Curitiba, PR, Brazil) were evaluated: Neoporos (Group 1) and Acqua (Group 2). The materials were sterilized by gamma radiation according to ISO 11137 (Sterilization of health care - products - Radiation)10.
Group 1 surface: sandblasting with abrasive
particles followed by an acid etching process.
Group 2 surface: as treated in Group 1 and,
also, maintained in an isotonic solution of 0.9%
sodium chloride.
Surface characterization
Scanning electron microscopy (SEM):
scanning electron microscopy SSX-550 (Shimadzu, Kyoto, Kyoto, Japan) enable a qualitative characterization of the surface morphology of Group 1 and Group 2 implants (n=2/group) at an accelerating voltage of 15 kV, focal width (FW) of 4.0, and Working Distance (WD) of 18 and 19 for
magniications of 1000X and 3000X, respectively.
Confocal three-dimensional laser scanning microscopy: μSurf Custom (Nanofocus AG,
Oberhausen, North Rhine - Westphalia, Germany) allowed for the quantitative evaluation of the surface roughness of different implant surfaces. Three implants of each group were used to measure the
Analysis Premium software program (Nanofocus AG, Oberhausen, North Rhine - Westphalia, Germany) was used to calculate 3D roughness parameters such as Ssk (amplitude distribution skew), Sa (arithmetic mean deviation of the peak-to-valley height of the surface), Sz (the average distance between the highest peak and the deepest valley), Sdr (indicates the surface area enlargement) and Sds (indicates the density of peaks on the surface).
The Ssk parameter identiies the distribution of
valleys (Ssk<0) or peaks (Ssk>0) on the surface. If the Ssk is close to zero, it has a gaussian surface21,30.
X-ray photoelectron spectroscopy (XPS):
The chemical composition of the different groups was examined by X-ray photoelectron spectroscopy (XPS) VG/SSI 2803 S-Probe (Kratos Analytical Ltd., Hofheim,Hesse, Germany) using an aluminum anode at 300 W (15 kV x 20 mA). A monochromatic Al Kα radiation source was used; the analysis spot size was 0.25x1 mm, and the measurement step size was 1 eV. Overview spectra were obtained over an energy range of 0–1100 eV. The emission angle between the incident beam and the surface of the sample was 35°. For elemental analysis, the survey spectra were analyzed and the detected elements were normalized. Two disks of each group were used for analysis.
Contact angle analysis: Universal Goniometer
DSA 20E (KrüssHamburg, Germany) allowed the static contact angles on disks to mimic the implant surfaces for the hydrophilicity analysis by assessing by sessile-drop technique18. The measurements
were performed on the surfaces (n=5 disks/group)
after a drop of SBF (simulated body luid) solution
was deposited onto the sample surfaces at room temperature. Fifteen contact angle values were obtained (one value per second in each sample).
In vivo procedures
Ten skeletally mature White New Zealand rabbits (Oryctolaguscuniculus) aged 5-6 months with an
average weight of 3.3 kg (range, 3.0 to 3.5 kg) of both sexes were used in this study. The animals were randomly assigned to individual 80x80x80 cm cages and received water and a commercial chow diet ad libitum. Animal experiments and
breeding were performed under conditions that were approved by the Institutional Review Board (CEP/ UFF: 380/2013), in compliance with the NIH Guide for Care and Use of Laboratory Animals and with Brazilian legislation on animal use.
Surgical procedures
The animal’s legs were shaved before surgery. For experimental manipulation, all animals were anesthetized with an intramuscular injection of ketamine, Francotar® 20 mg/kg-1(Virbac,
Jurubatuba, SP, Brazil) and xylazine, Sedazine® 1
mg/Kg-1 (FortDodge, São Cristovão, RJ, Brazil) to decrease the vagal tone. After 10 minutes, with visibly sedated animals exhibiting no responses to pain, ear vein puncture was performed, and lactated Ringer’s solution (Baxter Hospitalar LTDA, São Paulo, SP, Brazil) was administered intravenously at 15 ml/ kg/h. Then, the general anesthetic was maintained
by the inhalation of 1 % Isolurane® (Cristália, Rio de
Janeiro, RJ, Brazil). All surgical areas were clipped, prepared and draped using a sterile technique. Following the trichotomy and disinfection of both
tibia regions with a 0.2% chlorhexidine solution,
Riohex Scrub® (Rioquimica, São José do Rio Preto,
SP, Brazil), infiltration anesthesia was applied
using 2% lidocaine and 1:100,000 epinephrine,
Alphacaine® 0.5 - 1 ml/site (DFL, Rio de Janeiro,
RJ, Brazil) to reduce stimulation during surgery and generate vasoconstriction.
A 2-cm incision was made in the epithelium lining of both rabbits’ tibias. The soft tissue and periosteum were removed, and a sharp subperiosteal dissection exposed the proximal tibia, one implant was placed per limb. Under constant irrigation with 0.9% sodium saline solution, one perforation
was made with a surgical drill according to the manufacturer’s instructions. All drilling procedures were conducted at 1200 rpm. Immediately after opening, one implant was installed in the proximal site of each tibia, Group 1 on the right tibia and Group 2 on the left tibia (n=10/per group). The
periosteum around the bone perforations was then placed back in position and then attached to the subcutaneous tissue using an interrupted suture. The skin was closed using continuous #5.0 nylon sutures Ethicon®(Johnson & Johnson Medical Ltd.,
Blue Ash, Ohio, United States). Postoperatively, the rabbits received a single dose of an antibiotic, Pentabiótico Veterinário® (Fort Dodge, São Paulo, SP,
Brazil), and an anti-inlammatory Meloxicam® 0.3
mg/kg (Ouroino, São Paulo, SP, Brazil). Each rabbit
was caged individually and received food and water.
Histological processing
After 14 and 28 days, the animals were euthanized (10 rabbits/time point) with an overdose of sodium pentobarbital (60 mg/kg IM). A section of each tibia containing the implant area and 0.5 cm of excess tissue on each side were collected.
The non-demineralized specimens were ixed for 2 days in 70% alcohol and gradually dehydrated
using a series of alcohol solutions ranging from 70
to 100% ethanol. Specimens were then clariied in
xylol and embedded in methylmetacrylate according to the manufacturer’s instructions. The tissues
were sliced (~300 μm in thickness) through the
plates with an acrylate-based cement Techonovit 7000 VCL (Külzer, Wehrheim, Hesse, Germany), and allowed to set for 24 h prior to grinding and
polishing. The sections were then reduced to a inal thickness of ~30 μm by grinding/polishing using
a series of abrasive papers EXACT 310 CP series (800, 1000, 1200 and 2400) (EXACT Apparatebau,
Norderstedt, Schleswig-Holstein, Germany) under water irrigation. The unstained sections were analyzed by polarized light microscopy Axioplan 2 (Zeiss, Jena, Thuringia, Germany); the sections were then stained with toluidine blue and submitted to an optical microscopy evaluation Nikon Eclipse E400 (Nikon, Tokyo, Kanto, Japan).
Histomorphometric analysis
In each histological slice, eight non-superimposing
ields, corresponding to the implant/bone interface (four ields on each side of the implant), were captured by scanning at a 20x magniication, and
digital image analysis software (Image J®v.1.45;
National Institutes of Health, Bethesda, MD, USA) was used to measure the bone-to-implant contact (BIC) and bone area fraction occupied (BAFO). The regions of bone-to-implant contact along the implant perimeter were subtracted from the total implant perimeter, and calculations were performed to determine the BIC. The areas occupied by bone were subtracted from the total area between the threads, and calculations were performed to determine the BAFO [adapted from Bonfante, et al.2(2012)]. Both
results were reported as percentages.
Statistical analysis
Because all samples of the in vivo test passed
a normality test (Kolmogorov–Smirnov test), statistical analyses were performed by two-way
ANOVA, and Tukey’s post hoc test to compare the
differences between different experimental periods in the same group. Additionally, Student’s t-tests were performed to determine differences between different groups during the same experimental period. The values obtained by confocal three-dimensional laser scanning microscopy were analyzed with non-parametric Wilcoxon test. A
statistical signiicance was indicated by p-levels of less than 5%.
RESULTS
Surface characterization
Scanning electron microscopy (SEM)
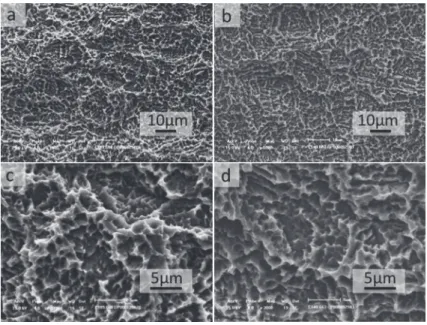
SEM micrographs of the implant’s surface revealed the textured microstructure of the samples. No marked differences between the groups were
identiied, and, in fact, the surface morphology of
Group 1 appeared to be very similar to Group 2 in
both magniications (Figure 1).
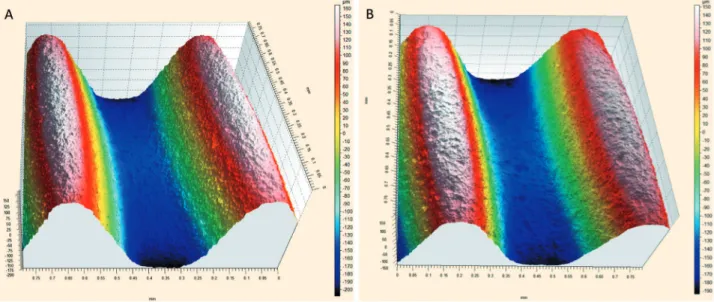
Confocal laser scanning microscopy
In this study, it can be stated that the distribution of peaks and valleys is symmetric, there is a Gaussian surface in both implants and no statistical differences between the groups were observed (Figure 2). The Sa parameter provides a good overview of the values of the height of the irregularities on the surface. Based on the mean values obtained for Group 1
(1.44 μm±1.15) and Group 2 (1.26 μm±0.17)
implants, it can be said that the two have a similar surface roughness, but only with this parameter, it is not possible to describe the surface as a whole. The Sz parameter indicates the average distance between the highest peak and the deepest valley. In this case, due to the process of obtaining the topography by the same method, the Sz value
Figure 1- Scanning electron microscopy of implants surface. Group 1 (a and c) and Group 2 (b and d). No difference
doesn’t change considerably (Group 1: 14.57 μm±1 and Group 2: 16.20 μm±7.8). Sdr is the parameter
that indicates the surface area enlargement. We can say that the surface area enlargement of Group 1
(mean value 1.51%) is similar to the implant surface of Group 2 (mean value 1.21%) due to the fact
that the process of obtaining the topography is the same in both cases. The Sds parameter indicates the density of peaks on the surface. In this case, due to the process of obtaining the topography being the same, the Sds value does not change considerably when comparing both surface Group
1 (658.67±27.42) and Group 2 (643.33±37.74).
X-ray photoelectron spectroscopy (XPS)
XPS analysis showed peaks related to C, O, N and Ti for both groups tested. The surface of Group 1 presented atomic percentage values of 58 and 49 for carbon and 21 and 22 for oxygen, whereas Group 2 presented values of 17 for carbon and 59 for oxygen. Relative to the control surface, Group 2 showed a greater oxygen content.
Contact angle analysis
Group 2 presented superhydrophilic behavior (contact angle <5°), whereas the surface of Group 1 specimens was hydrophobic (contact angle >90°) (Table 1). The contact angles between the drop solution and different surfaces are shown in Figure 3.
Figure 2- Confocal laser scanning microscopy in the thread region (a) Group 1 and (b) Group 2. No substantial difference
between groups was observed (original magniication 20X). The numerical scale (μm) from white (160 μm) and black (-200μm)
Surface Disc 1(º) Disc 2(º) Disc 3(º) Disc 4(º) Disc 5(º) Other elements
Standard deviation
Group 1 130.55 134.83 107.69 136.09 126.55 127.14 11.5
Group 2 <5º <5º <5º <5º <5º <5º n.d.*
* Not determinated
Table 1- Contact angle of different surfaces (goniometer)
In vivo evaluation
Macroscopic evaluation
All animals survived the experimental period, remained healthy and showed no discomfort. The surgical procedures and follow-ups presented no complications regarding procedural conditions,
post-operative infection, or other clinical concerns. No implants were excluded from the study due to clinical instability immediately after euthanasia.
Histological analysis and histomorphometry
Non-decalcified, toluidine-blue-stained, thin sections allowed for the easy visualization of the
Figure 4- Photomicrographs of toluidine blue stained thin sections of the Group 1 at 14 days (a) and 28 days (b) and Group
2 at 14 days (c) and 28 days (d) in bright ield (original magniication 10X). Observe the presence of new bone formation in
the area between threads and the contact between bone and both implant groups. In Group 2 at 28 days, see the presence of trabecular bone more compact and in a greater number than Group 1 at the same period, suggesting the acceleration of osseointegration
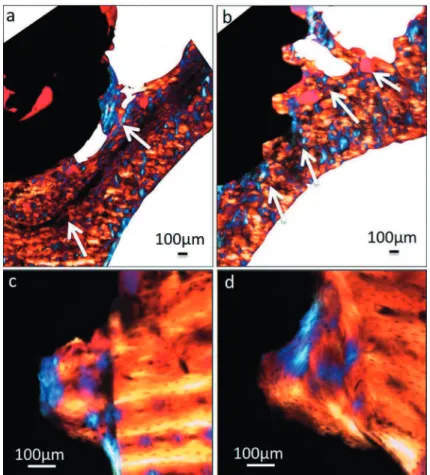
Figure 5- Polarized light micrographs of implant sections at the 28 day period. Apical region in Group 1 (a) and Group 2 (b)
(original magniication 4X); cervical region in Group 1 (c) and Group 2 (d) (original magniication 20X). The arrows indicate
bone-implant interfaces and determination of the bone-to-implant contact and bone area fraction occupied (Figure 4).
In both experimental periods, more islands of new trabecular bone between threads of the implants of Group 2 were observed than in the Group 1 (Figures 4A and 4D). Additionally, the new
bone illed the region between the implant threads
because the new bone was in intimate contact with the implant surface without the presence of an
intervening ibrous tissue layer.
The histological indings obtained from polarized
light microscopy showed greater osseoconduction for the new-formed bone in Group 2 in the apical region (Figures 5A and B) and also showed that the new bone in the area between threads was organized differently when compared with the lamellar structure of the pre-existing bone (Figures 5C and D). Histological analysis was performed to further characterize the cervical and apical regions of the implants.
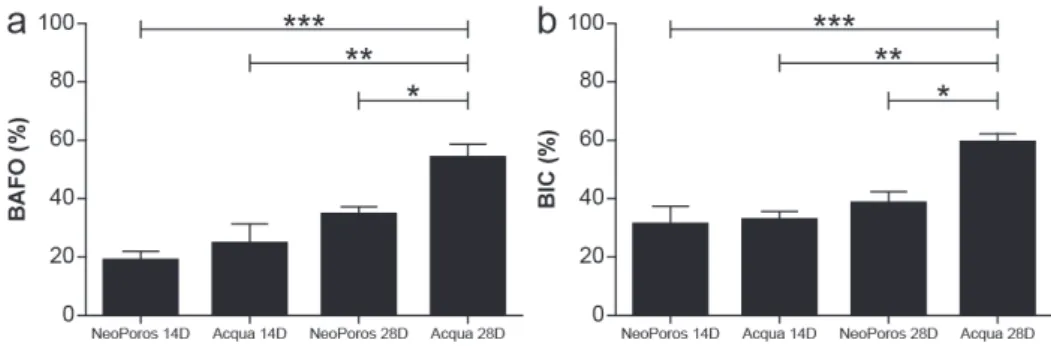
The results of histomorphometric analysis are summarized in Figure 6 and confirm the observations made by the histological analysis. Group 1 showed, after 28 days, rates of BIC of 38.6
(±8.76), while Group 2 presented 59.0 (±7.14)
(p<0.05) for the same parameter. For BAFO values,
Group1 presented 34.3 (±6.26) and Group 2 53.68 (±10.87) (p<0.05). It should be noted that the BIC
and BAFO levels were similar between Group 2 at 14 days and Group 1 at 28 days (p>0.05), clearly demonstrating an acceleration of osseointegration.
DISCUSSION
Over the past few years, material surface properties such as topography and wettability have received great attention in relation to dental implant applications4. An important modiication
is the improvement of the wettability of implant surfaces due to the biological implications of hydrophilicity, from the initial contact between an implant surface and host interface, which involves interactions with water and ions via conditioning
by the formation of protein-rich ilms, up to the
level of cellular interactions20. The general idea is
that when wettability is increased, biocompatibility is enhanced, promoting interactions between an implant’s surface and the biological environment, allowing for the activation of cellular activity most likely modulated by the implant surface’s energy9.
Conventional surfaces are kept dry and exposed to air, making them hydrophobic due to the adsorption of carbon and the hydrocarbons present
Figure 6- Histomorphometric analysis of (a) Bone area fraction occupied (BAFO) and (b) Mean bone-to-implant contact (BIC). BAFO was calculated as a percentage of the total region among the threads. BIC was calculated as a percentage
of the total implant perimeter. Results are shown as mean percentages ± standard deviation. Statistically signiicant
differences are indicated by an asterisk, * p<0.05; ** p<0.01; *** p<0.001
Surface Sample SsK Sa Sz Sdr Sda Sha Sds
[µm] [µm] [mm²] [mm²] [1/mm²]
Group 1 1 − 0.56 1.32 13.6 0.01 0 0 639
2 − 0.55 1.39 14.5 0.01 0 0 647
3 − 0.43 1.61 15.6 0.02 0 0 690
Mean − 0.51 1.44 14.57 0.02 0 0 658.67
Group 2 1 − 0.3 1.26 11.4 0.01 0.29 0 669
2 − 0.66 1.09 12 0.01 0 0 661
3 − 0.33 1.43 25.2 0.01 0 0.01 600
Mean − 0.43 1.26 16.2 0.01 0.1 0.01 643.33
in the air and reducing the wetting of the implant by the surrounding biological environment; this process
makes it dificult for proteins to be adsorbed and
for cellular responses to be induced14. One of the
principal strategies for preventing a decrease in the surface energy of titanium implants is the liquid isolation of the surface of TiO
2 not contaminated by
the atmosphere. Compared to conventional surfaces,
these modiied surfaces favor the adsorption of
proteins and are able to promote the activation of osteoblasts toward a more osteogenic phenotype. These phenomena suggest that the increased bone
formation observed on the modiied surface of these
implants should be due to the stimulating effect of high surface energy on osteoblasts30. Previous
studies have shown that a hydrophilic surface is
beneicial for gene expression, osteoblast behavior,
bone mineralization and early osseointegration4,7.
N e i t h e r s c a n n i n g e l e c t r o n m i c r o s c o p y (SEM) analysis nor confocal laser scanning microscopy revealed any remarkable differences in the morphological and topographical surfaces, respectively, between the two groups of implants. Similar results were obtained in another comparative study between two different surfaces, SLA and modSLA. SEM studies and three-dimensional topographical analysis by white-light confocal microscopy showed that the modiied chemical surface (modSLA) had no structural impact when compared with the standard SLA, suggesting no topographical or morphological differences exist between SLA and modSLA. Indeed, no signiicant
differences were observed for any of the surface roughness parameters4,15. In our study, the confocal
microscopy showed that the distribution of peaks and valleys is symmetric between groups, both groups have a similar surface roughness (Sa, Sdr and Sds), the average distance between the highest peak and the deepest valley doesn’t change considerably between groups (Sz) (Table 2).
In contrast, a signiicant difference in wettability,
evaluated by contact angle analysis, was observed between the surfaces of groups, characterizing the surface of Group 2 as hydrophilic and Group 1 as hydrophobic (p<0.05). These results corroborate those of two previous studies, one that compared two different implant surfaces, SLA and SLActive, in which the contact angle was evaluated and the
authors demonstrated signiicant differences in
wettability between the groups12, and the other
compared four different types of surface modiication
with different wettability and nanostructures in a rabbit’s tibia model and concluded that
osseointegration was inluenced by wettability, and
super-hydrophilic surfaces demonstrated stronger bone response compared with hydrophobic surfaces in implants with the same microtopography29.
The greater amount of oxygen observed on
Group 2’s surfaces can be attributed to the titanium oxide layer present on the surface of the implants24,
in agreement with the results of other studies4,13.
These values are similar to those reported in a previous study in which X-ray photoelectron spectroscopy analysis demonstrated that modSLA surfaces exhibited a higher concentration of oxygen (O2, 55±2%) than their unmodiied counterparts12.
Conversely, modSLA surfaces yielded a lower carbon
concentration (C, 18.4±2.7%) compared with standard SLA surfaces (C, 37.3±3.4%). The carbon
dioxide concentration measured on the surface of Group 1’s implants is also consistent with other results reported in studies that evaluated implant surfaces that had been exposed to air for a certain duration13.
The immersion of an implant in saline solution maintains the hydrophilicity of the implant surface, protecting it from air, preventing contamination by carbon and hydrocarbons and thus preventing the loss of surface energy24. This result is in agreement
with the results reported in a study by Buser, et al.4 (2004) wherein the amount of carbon on the
hydrophilic surface modSLA (control) implants placed in an isotonic solution of sodium chloride
(NaCl) decreased signiicantly compared to what
had been observed on the conventional hydrophobic surface of SLA implants. This method for providing surface protection, in addition to maintaining hydrophilicity, also provides benefits such as exerting pro-osteogenic and pro-angiogenic effects7
and inducing a higher degree of osseointegration in both animals3, and humans12.
Higher surface hydrophilicity correlates positively with intense and rapid osteogenesis, as observed in this study. The results obtained in this study are in agreement with those of previous studies that
demonstrated the beneicial properties of wettability
in the early acceleration of osseointegration in both animals4 and humans12. Another important factor
contributing to this improvement in the performance of Group 2 can be the support of the undisturbed preservation of blood clots on the “osteophilic” surface19.
In this study the in vivo results showed high
rates of BIC and BAFO in Group 2 as compared with Group 1 after 28 days of implantation. This
inding is in agreement with an animal study that showed signiicant improvements in BIC and bone
anchorage during the early stages of bone healing in a minipig model. The authors showed an increase
in BIC of 82% after 4 weeks for SLActive surface modiication compared with the increase of 66.57%
rabbit study after the same experimental period4.
A clinical study also demonstrated an increase in the rate of BIC on SLActive implant surfaces
(hydrophilic, 48.3%) compared to that found on the SLA implant surfaces (hydrophobic, 32.4%)12.
The factors related to bone healing in our study were not affected by micro surface topography but by chemical changes.
CONCLUSION
This study demonstrated signiicant differences
in the chemical properties and wettability between two groups of implants. Both surfaces had similar microtopography. The surface chemistry and wettability of Group 2’s implants accelerated the implants’ osseointegration and increased their
bone-to-implant interface relative to the indings obtained
for Group 1’s implants.
REFERENCES
1-Berglundh T, Abrahamsson I, Lang NP,Lindhe, J. De novo alveolar bone formation adjacent to endosseous implants. Clin Oral Implants Res. 2003;14:251-62.
2-Bonfante EA, Witek L, Tovar N, Suzuki M, Marin C, Granato R, et al. Physicochemical characterization and in vivo evaluation of amorphous and partially crystalline calcium phosphate coatings fabricated on Ti-6Al-4V implants by the plasma spray method. Int J Biomater. 2012;2012:603826.
3-Brånemark PI, Adell R, Breine U, Hansson BO, Lindström J, Ohlsson A. Intra-osseous anchorage of dental prostheses. I. Experimental studies. Scand J Plast Reconstr Surg. 1969;3:81-100. 4-Buser D, Broggini N, Wieland M, Schenk RK, Denzer AJ, Cochran DL, et al. Enhanced bone apposition to a chemically modiied SLA titanium surface. J Dent Res. 2004;83:529-33.
5-Chiapasco M, Abati S, Romeo E, Vogel G. Clinical outcome of autogenous bone blocks or guided bone regeneration with e-PTFE membranes for the reconstruction of narrow edentulous ridges. Clin Oral Implants Res. 1999;10:278-88.
6-Coelho PG, Giro G, Teixeira HS, Marin C, Witek L, Thompson VP, et al. Argon-based atmospheric pressure plasma enhances early bone response to rough titanium surfaces. J Biomed Mater Res A. 2012;100:1901-6.
7-Donos N, Hamlet S, Lang NP, Salvi GE, Huynh-Ba G, Bosshardt DD, et al. Gene expression profile of osseointegration of a hydrophilic compared with a hydrophobic microrough implant surface. Clin Oral Implants Res. 2011;22:365-72.
8-Elias CN. Factors affecting the success of dental implants. In:Turkyilmaz I, ed. Implant dentistry: a rapidly evolving practice. Rijeka: InTech; 2011. p. 319-64.
9-Eriksson C, Nygren H, Ohlson K. Implantation of hydrophilic and hydrophobic titanium discs in rat tibia: cellular reactions on the surfaces during the irst 3 weeks in bone. Biomaterials. 2004;25:4759-66.
10- International Organization for Standardization. ISO 11137: Sterilization of health care products - Radiation - Part 2: Establishing the sterilization dose. Geneva: ISO; 2013.
11-Jimbo R, Ivarsson M, Koskela A,Sul YT, Johansson CA. Protein adsorption to surface chemistry and crystal structure modiication of titanium surfaces. J Oral Maxilofac Res. 2010;1:e3.
12-Lang NP, Salvi GE, Huynh-Ba G, Ivanovski S, Donos N, Bosshardt DD. Early osseointegration to hydrophilic and hydrophobic implant surfaces in humans. Clin Oral Implants Res. 2011;22:349-56.
13-Massaro C, Rotolo P, DeRiccardis F, Milella E, Napoli A, Wieland M, et al. Comparative investigation of the properties of commercial titanium dental implants. Part I: chemical composition. J Mater Sci Mater Med. 2002;13:535-48.
14-Michiardi A, Aparicio C, Ratner BD, Planell JA, Gil J. The inluence of surface energy on competitive protein adsorption on oxidized NiTi surfaces.Biomaterials. 2007;28:586-92.
15-Quere D. Wetting and roughness. Annu Rev Mater Res. 2008;38:71-99.
16-Richards RG. The effect of surface roughness on ibroblast adhesion in vitro. Injury. 1996;27:SC38-43.
17-Rupp F, Scheideler L, Eichler M, Geis-Gerstorfer J. Wetting behavior of dental implants. Int J Oral Maxillofac Implants. 2011;26:1256-66.
18-Sawase T, Jimbo R, Baba K, Shibata Y, Ikeda T, Atsuta M. Photo-induced hydrophilicity enhances initial cell behavior and early bone apposition. Clin Oral Implants Res. 2008;19:491-6.
19-Schwarz F, Herten M, Sager M, Wieland M, Dard M, Becker J. Histological and immunohistochemical analysis of initial and early osseous integration at chemically modiied and conventional SLA titanium implants: preliminary results of a pilot study in dogs. Clin Oral Implants Res. 2007;18:481-8.
20-Sela MN, Badihi L, Rosen G, Steinberg D, Kohavi D. Adsorption of human plasma proteins to modiied titanium surfaces. Clin Oral Implants Res. 2007;18:630-8.
21- Shon WJ, Chung SH, Kim HK, Han GJ, Cho BH, Park YS. Peri-implant bone formation of non-thermal atmospheric pressure plasma-treated zirconia implants with different surface roughness in rabbit tibiae. Clin Oral Implants Res. 2014;25:573-9.
22-Suzuki M, Guimarães MV, Marin C, Granato R, Gil JN, Coelho PG. Histomorphometric evaluation of alumina-blasted/acid-etched and thin ion beam-deposited bioceramic surfaces: an experimental study in dogs. J Oral Maxillofac Surg. 2009;67:602-7.
23-Tengvall P, Lundström I. Physico-chemical considerations of titanium as a biomaterial. Clin Mater. 1992;9:115-34.
24-Textor M, Sittig C, Frauchiger V, Tosatti S, Brunette DM. Properties and biological signiicance of natural oxide ilms on titanium and its alloys. In: Brunette DM, Tengvall P, Textor M, Thomsen P, eds. Titanium in medicine: material science, surface science, engineering, biological responses and medical applications. New York: Springer; 2001. p.171-230.
25-Vasak C, Busenlechner D, Schwarze UY, Leitner HF, Munoz Guzon F, Hefti T, et al. Early bone apposition to hydrophilic and hydrophobic titanium implant surfaces: a histologic and histomorphometric study in minipigs. Clin Oral Impl Res. 2014;25:1378-85. 26-Weber HP, Morton D, Gallucci GO, Roccuzzo M, Cordaro L, Grutter, L. Consensus statements and recommended clinical procedures regarding loading protocols. Int J Oral Maxillofac Implants. 2009;24:180-3.
27-Wennerberg A, Albrektsson T. Effects of titanium surface topography on bone integration: a systematic review. Clin Oral Implants Res. 2009;4:172-84.
28-Wennerberg A, Hallgren C, Johansson C, Danelli S. A histomorphometric evaluation of screw-shaped implants each prepared with two surface roughnesses. Clin Oral Implants Res. 1998.9:11-9.
29-Wennerberg A, Jimbo R, Stubinger S, Obrecht M, Dard M, Berner S. Nanostructures and hydrophilicity inluence osseointegration: a biomechanical study in the rabbit tibia. Clin Oral Implants Res. 2014;25:1041-50.