ABSTRACT:Introduction: The article compares the risk and protective factors for Non-communicable Diseases (NCD), referred morbidity and access to preventive examinations in the population with and without health insurance in all Brazilian State capitals. Methods: The study population consists of adults (≥ 18 years old) living in households with landlines in 26 Brazilian State capitals and the Federal District. Estimates of selected variables are presented according to possession of health plans (“Yes” or “No”) and sex. A post-stratiication was performed according to age, gender and education in both populations, and prevalence ratios were calculated, adjusted for age and sex between people with and without health insurance for the risk and protective factors for NCDs. Results: A total of 54,099 people at the age of 18 or older were evaluated, 47.4% of them were beneiciaries of health plans. The coverage of health insurance tends to increase with age and level of education. Compared to non-beneiciaries of health plans, beneiciaries were more likely to have protective factors, such as healthy eating, physical activity, coverage tests, such as mammography and Pap test, and lower prevalence of risk factors such as smoking, physical inactivity, poor health assessment and hypertension. Alcohol abuse, consumption of excessively fat meats, overweight, obesity and diabetes were not associated with the variable possession of health insurance. When controlled by education, individuals who have health insurance generally have better indicators. Conclusion: This information is important to establish measures for reducing diferences among people with and without health insurance.
Keywords: Chronic Disease. Health plans. Smoking. Papanicolaou smear. Mammography. Population surveys.
Comparison of risk and protective factors for
chronic diseases in the population with and without
health insurance in the Brazilian capitals, 2011
Comparação dos fatores de risco e proteção de doenças crônicas na
população com e sem planos de saúde nas capitais brasileiras, 2011
Deborah Carvalho MaltaI, Regina Tomie Ivata BernalII
IDepartment of Non-Communicable Diseases Surveillance and Health Promotion, Health Surveillance Secretariat, Ministry of Health – Brasília (DF), Brazil.
IICenter for Epidemiological Research in Nutrition and Health of Universidade de São Paulo – São Paulo (SP), Brazil.
Corresponding author: Deborah Carvalho Malta. Departamento de Vigilância de Doenças e Agravos Não Transmissíveis e Promoção da Saúde, Secretaria de Vigilância em Saúde, Ministério da Saúde. SAF Sul, Trecho 2, Lote 5/6, Torre I, Edifício Premium, Sala 14, Térreo, CEP: 70070-600, Brasília, DF, Brasil. E-mail: [email protected]
INTRODUCTION
The main causes of morbimortality among Brazilian adults are the Chronic Non-Communicable Diseases (NCD), especially conditions of the circulatory system, neoplasms, chronic respiratory diseases and diabetes, which are in charge of 72% of deaths in the country1,2.
The impact of risk and protective factors on mortality caused by NCD can be observed by deaths that are attributed to or prevented by each factor. According to the World Health Organization (WHO), the insuicient intake of fruits, vegetables and greens is annually responsible for one third of heart ischemic diseases and about 20% of all gastrointestinal cancers in the world. Arterial hypertension, which is the main risk factor for cardiovascular diseases, causes about 7.5 million deaths/years, followed by smoking, physical inactivity, overweight/obesity, high cholesterol and abusive alcohol consumption. On the other hand, the regular practice of physical activities reduces the risk of cardiovascular diseases, including arterial hypertension, diabetes, breast cancer, colon/rectal cancer and depression, besides helping weight control3.
The NCDs have led to a high number of premature deaths, loss in quality of life and high level of limitation for individuals, besides causing negative economic impacts for families, communities and the society in general, which resulted in the aggravation of social inequities, poverty and social inequalities3.
RESUMO:Introdução: O artigo compara os fatores de risco e proteção de Doenças Crônicas Não Transmissíveis (DCNT), morbidade referida e acesso a exames preventivos na população com e sem planos de saúde nas capitais brasileiras. Métodos: A população de estudo é composta por adultos (≥ 18 anos) moradores de residências com telefones ixos nas 26 capitais dos estados brasileiros e no Distrito Federal. As estimativas das variáveis selecionadas são apresentadas segundo planos de saúde (“Sim” ou “Não”) e sexo. Foi realizada pós-estratiicação segundo idade, sexo e escolaridade nas duas populações, e foram calculadas as razões de prevalência ajustadas por idade e sexo para os fatores de risco e proteção de DCNT. Resultados: Foram avaliadas 54.099 pessoas com 18 ou mais anos de idade, sendo 47,4% beneiciários de planos de saúde. A cobertura de planos de saúde tende a aumentar com a idade e escolaridade. Os beneiciários de planos apresentaram maior chance de ter fatores de proteção, como alimentação saudável, prática de atividade física, cobertura de exames, como mamograia e Papanicolau, e menor prevalência de fatores de risco, como tabagismo, inatividade física, avaliação de saúde ruim e hipertensão arterial. O consumo de bebida alcoólica de forma abusiva, o consumo de carne com excesso de gordura, excesso de peso, obesidade e diabetes não tiveram associação com a variável posse de plano de saúde. Quando controlados por escolaridade, os indivíduos que têm planos de saúde geralmente apresentam melhores indicadores. Conclusão: Essas informações são importantes para reduzir iniquidades entre a população com e sem plano de saúde.
The NCD epidemic has afected mostly people with low income, since they are more exposed to risk factors and because they have less access to health services3,4. There are important
diferences in the distribution of morbimortality of NCDs, according to socioeconomic factors, such as education, occupation, income, gender and ethnicity, which results in diferent access to services, consumption patterns, among others1-3.
Studies have pointed out to a positive correlation between the access to health services and the purchasing power of the population. Data from the National Household Survey (PNAD) indicated that 49.7% of people with lower family income declared having seen a doctor in the past 12 months, but this number increased to 78.3% among people with family income superior to 20 minimum wages5. PNAD also showed that, the higher the family income, the
higher the chances of having a health insurance plan. In the population with family income inferior to one minimum wage, the coverage of health plans was of about 3%, but the coverage increased to 83.8% for those who received 20 minimum wages or more5. Previous
studies from the Telephone Survey Surveillance System for Risk and Protective Factors for Chronic Diseases (Vigitel) pointed out that the population with health plans tends to have more access to preventive cancer examinations, such as the Pap test and mammography6.
The Behavior Risk Factor Surveillance System (BRFSS) has publicized frequent analyses with the American population, comparing risk factors for NCDs among populations covered and not covered by health insurance plans. The results show that populations with health plans tend to have more access to preventive examinations, higher prevalence of protective factors, such as healthy diet and physical activities, and lower prevalence of risk factors, such as smoking7,8.
In Brazil, these national studies about risk factors of NCDs, such as dietary habits, physical activity, use of tobacco and alcohol and access to examinations in the population with and without health plans are still lacking. Studies conducted in Belo Horizonte show important diferences between these populations, always associating higher prevalence of risk factors to populations that are not covered by health plans9.
Data on risk factors of NCDs began to be monitored in Brazil in 2006 by means of the Telephone Survey Surveillance System for Risk and Protective Factors for Chronic Diseases (Vigitel). The survey is conducted annually in all of the 26 Brazilian State capitals and in the Federal District, with the adult population (≥ 18 years old)10. Among the indicators that
are proxy of socioeconomic status, we indicate schooling and the variable health insurance plan, included in 2008. The latter allows a speciic look to the population that is beneiciary of health plans in the 26 capitals and in the Federal District.
METHODS
This analysis refers to a cross-sectional population study that assesses the adult population (≥ 18 years old) living in the capitals of the 26 Brazilian states and in the Federal District. Vigitel uses probability samples of the adult population (≥ 18 years old) from the registration of landlines in the cities, made available annually by the main landline companies in the country. Five thousand landlines were raled in each city, which were divided in replicas (or sub-samples) of 200 lines each in order to identify the eligible lines, that is, active household lines. After conirming the eligibility of the line, the inhabitant to be interviewed was selected.
The data base from Vigitel 2011 was used, considering the comparison group composed of adults with and without health plans. The rake method11,12 was used to calculate post-stratiication
weights, using an external source of data concerning the Brazilian population. In the construction of post-stratiication weights, estimates of age, sex and schooling of the population projected for the year of the study were used. The rake method uses the distribution of absolute frequencies of age group (18 to 24; 25 to 34; 35 to 44; 45 to 54; 65 years old or more), sex (male, female), schooling (0 to 7; 8 to 10; 11 to 13; 14 years or more) of the population, being weighed by sampling weights. Weights were calculated in the SAS software, using the macro sasRakinge.sas, made available by Izrael et al.13.
The Vigitel questionnaire involves 94 questions, divided into modules:
• Demographic and socioeconomic characteristics of individuals;
• Diet pattern and physical activity;
• Reported weight and height;
• Consumption of cigarettes and alcohol;
• Self-evaluation of health status and reported morbidity.
The interview of Vigitel is based on the system of telephone interviews assisted by computer, in which questions are read on the computer screen, and answers are registered directly in electronic mean, thus enabling the automatic skipping of invalid questions resulting from previous answers10.
The following risk factors of NCDs were studied: prevalence of smokers (% of smokers/ number of interviewed individuals, former smokers/number of individuals who quit smoking); excess weight (Body Mass Index ≥ 25 kg/m2) and obesity (Body Mass Index ≥ 30 kg/m2);
medical diagnosis of arterial hypertension and diabetes). The presented protective factors were: recommended consumption (ive or more daily portions, on ive or more weekdays) of fruits and vegetables; regular intake of beans (ive or more days a week); recommended practice of physical activity during free time (practice of at least 150 minutes a week of mild or moderate physical activity, or at least 75 minutes of a week of vigorous physical activity, regardless of the number of days in which the activity is practiced during the week); performance examinations for the early detection of cancer among women (mammography for women aged from 50 to 69 years old and Pap test for women aged from 25 to 59 years old). Such indicators were calculated and the denominator was the total number of interviewed adults, except for those concerning speciic age and sex.
The multiple logistic regression model was used:
(log⎧⎨ = β1 + β2x2 + ... + βpxp)3
⎩ ⎫ ⎬ ⎭ π(x)
1 - π(x) ,
in which π(x) expresses the probability of access to health insurance plans, given the xp characteristics (age group and schooling years), in order to identify the proile. Explanatory variables are qualitative, and the irst category is considered as a reference. Results from the multiple logistic regression are expressed by odds ratio (OR) for one speciic xp and reference categories. The odds ratio equals to 1 indicates that the chance is equally likely in both groups. Values higher than 1indicate how much higher the chance is in the irst group, and values lower than 1 indicate how much lower the chance is in the irst group in relation to the second group14. The frequencies of risk and protective factors
of NCDs with and without health plans were compared, in the set of 26 capitals and the Federal Districted. The OR estimated by the logistic regression model between those who have and do not have health plans was calculated. Risk and protective factors of NCDs in the population with and without health plans were also analyzed, according to schooling strata in the set of 26 capitals and the Federal District. In all of the performed analyses, the inal weight was considered, which is composed by the sampling weight and the post-stratiication weight.
The Vigitel survey was approved by the National Human Ethics Research Committee, from the Ministry of Health. The signature of the Informed Consent Form, in this case, was replaced by the verbal consent of the interviewee at the time of the phone call.
RESULTS
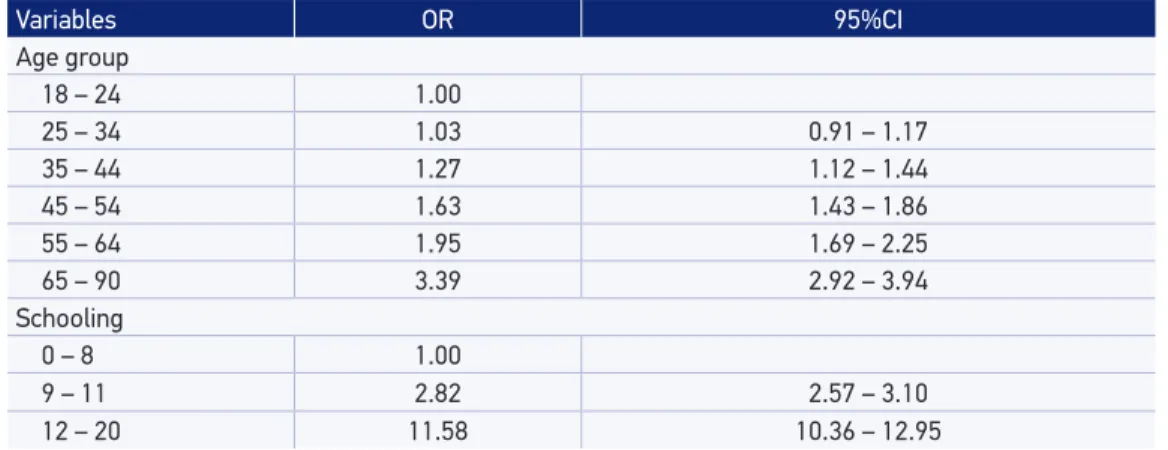
The result of the logistic regression shows that, from the age of 35, the chances of an adult having a health insurance plan is higher when compared to the group aged 18 to 24 years old. The same can be observed for schooling: the higher the schooling, the higher the chances of an adult having a health plan when compared to the group with 0 to 8 schooling years (Table 2).
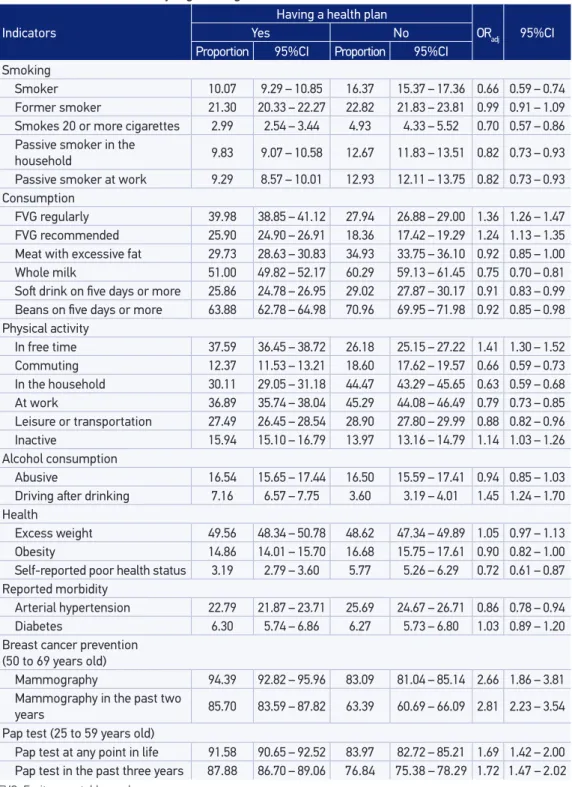
The group of adults with health plan has lower association in the indicators: smoking or excessive smoking (20 or more cigarettes a day); passive smoker in the household and at work; consumption of whole milk or soft drink ive or more days a week; consumption of beans on ive or more days a week; evaluation of health status considered to be poor and arterial hypertension. Physical activity during free time is more frequent in the group with
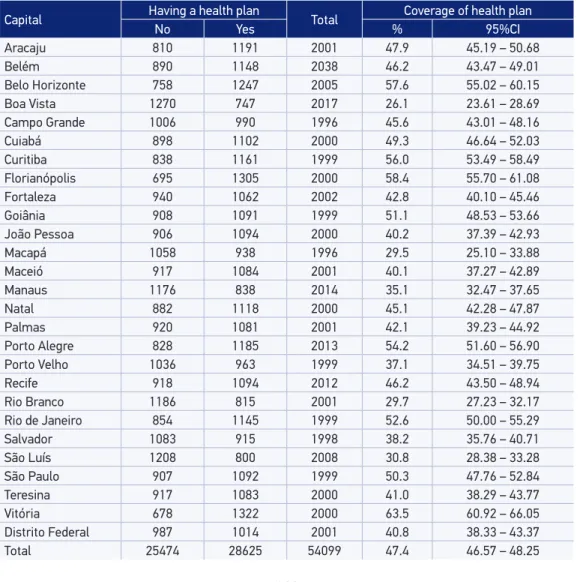
Table 1. Sample size per state capital, and health plan possession and health plan coverage per state capital according to Vigitel, 2011.
Capital Having a health plan Total Coverage of health plan
No Yes % 95%CI
Aracaju 810 1191 2001 47.9 45.19 – 50.68
Belém 890 1148 2038 46.2 43.47 – 49.01
Belo Horizonte 758 1247 2005 57.6 55.02 – 60.15
Boa Vista 1270 747 2017 26.1 23.61 – 28.69
Campo Grande 1006 990 1996 45.6 43.01 – 48.16
Cuiabá 898 1102 2000 49.3 46.64 – 52.03
Curitiba 838 1161 1999 56.0 53.49 – 58.49
Florianópolis 695 1305 2000 58.4 55.70 – 61.08
Fortaleza 940 1062 2002 42.8 40.10 – 45.46
Goiânia 908 1091 1999 51.1 48.53 – 53.66
João Pessoa 906 1094 2000 40.2 37.39 – 42.93
Macapá 1058 938 1996 29.5 25.10 – 33.88
Maceió 917 1084 2001 40.1 37.27 – 42.89
Manaus 1176 838 2014 35.1 32.47 – 37.65
Natal 882 1118 2000 45.1 42.28 – 47.87
Palmas 920 1081 2001 42.1 39.23 – 44.92
Porto Alegre 828 1185 2013 54.2 51.60 – 56.90
Porto Velho 1036 963 1999 37.1 34.51 – 39.75
Recife 918 1094 2012 46.2 43.50 – 48.94
Rio Branco 1186 815 2001 29.7 27.23 – 32.17
Rio de Janeiro 854 1145 1999 52.6 50.00 – 55.29
Salvador 1083 915 1998 38.2 35.76 – 40.71
São Luís 1208 800 2008 30.8 28.38 – 33.28
São Paulo 907 1092 1999 50.3 47.76 – 52.84
Teresina 917 1083 2000 41.0 38.29 – 43.77
Vitória 678 1322 2000 63.5 60.92 – 66.05
Distrito Federal 987 1014 2001 40.8 38.33 – 43.37
health plan, while those who do not have health plans are more active during commute and in the household. Having health insurance plans increases the chances of eating fruits, vegetables and greens (FVG), and of driving after drinking. Preventive examinations, such as mammography among women aged 50 to 69 years old, and the Pap test (to prevent uterine cervical cancer) among women aged between 25 and 59 years old, are more frequent among those with health plans. With regard to the following indicators: former smoker, intake of meat with excessive fat, abusive consumption of alcohol, excess weight, obesity and diabetes, these are not associated with the variable having a health plan (Table 3).
The population with health plans and lower schooling (0 to 8 years), compared to those with no health plan, presents less chances of smoking, smoking 20 cigarettes a day or more, drinking whole milk, performing physical activity during commute between work and the household, and in the household, and drinking alcohol abusively. On the other hand, it increases the chances of eating fruits, vegetables and greens (FVG), performing physical activity during free time, driving after drinking, more coverage of prevention examinations for breast cancer (women aged between 50 and 69 years old) and preventing uterine cervical cancer (25 to 59 years old) (Table 4). In the group of people with 9 to 11 schooling years, the population with health plans, in comparison to the population without health plans, present lower odds ratio for smoking, smoking 20 cigarettes a day or more, smoking passively in the household or at work, drinking whole milk, having lower prevalence of physical activity during commute and in the household, having higher prevalence of poor health status and having more arterial hypertension. On the other hand, it increases the chances of eating FVG, to perform more physical activities during free time, more coverage for the prevention of breast cancer among women aged between 50 and 69 years old and more coverage for the prevention of uterine cervical cancer among women aged between 25 and 59 years old. In the group with 12 schooling years or more, the population with health plans, compared
Table 2. Population coverage of health plans, according to age and education, Brazilian capitals, 2011. Odds ratio (OR) estimated by logistic regression model.
Variables OR 95%CI
Age group
18 – 24 1.00
25 – 34 1.03 0.91 – 1.17
35 – 44 1.27 1.12 – 1.44
45 – 54 1.63 1.43 – 1.86
55 – 64 1.95 1.69 – 2.25
65 – 90 3.39 2.92 – 3.94
Schooling
0 – 8 1.00
9 – 11 2.82 2.57 – 3.10
Table 3. Comparison of the distribution of risk and protective factors of Chronic Non-Communicable Diseases with and without health insurance, among the 26 state capitals and the Federal District. Odds ratio (OR) estimated by logistic regression model.
Indicators
Having a health plan
ORadj 95%CI
Yes No
Proportion 95%CI Proportion 95%CI
Smoking
Smoker 10.07 9.29 – 10.85 16.37 15.37 – 17.36 0.66 0.59 – 0.74
Former smoker 21.30 20.33 – 22.27 22.82 21.83 – 23.81 0.99 0.91 – 1.09
Smokes 20 or more cigarettes 2.99 2.54 – 3.44 4.93 4.33 – 5.52 0.70 0.57 – 0.86
Passive smoker in the
household 9.83 9.07 – 10.58 12.67 11.83 – 13.51 0.82 0.73 – 0.93
Passive smoker at work 9.29 8.57 – 10.01 12.93 12.11 – 13.75 0.82 0.73 – 0.93
Consumption
FVG regularly 39.98 38.85 – 41.12 27.94 26.88 – 29.00 1.36 1.26 – 1.47
FVG recommended 25.90 24.90 – 26.91 18.36 17.42 – 19.29 1.24 1.13 – 1.35
Meat with excessive fat 29.73 28.63 – 30.83 34.93 33.75 – 36.10 0.92 0.85 – 1.00
Whole milk 51.00 49.82 – 52.17 60.29 59.13 – 61.45 0.75 0.70 – 0.81
Sot drink on ive days or more 25.86 24.78 – 26.95 29.02 27.87 – 30.17 0.91 0.83 – 0.99
Beans on ive days or more 63.88 62.78 – 64.98 70.96 69.95 – 71.98 0.92 0.85 – 0.98
Physical activity
In free time 37.59 36.45 – 38.72 26.18 25.15 – 27.22 1.41 1.30 – 1.52
Commuting 12.37 11.53 – 13.21 18.60 17.62 – 19.57 0.66 0.59 – 0.73
In the household 30.11 29.05 – 31.18 44.47 43.29 – 45.65 0.63 0.59 – 0.68
At work 36.89 35.74 – 38.04 45.29 44.08 – 46.49 0.79 0.73 – 0.85
Leisure or transportation 27.49 26.45 – 28.54 28.90 27.80 – 29.99 0.88 0.82 – 0.96
Inactive 15.94 15.10 – 16.79 13.97 13.16 – 14.79 1.14 1.03 – 1.26
Alcohol consumption
Abusive 16.54 15.65 – 17.44 16.50 15.59 – 17.41 0.94 0.85 – 1.03
Driving ater drinking 7.16 6.57 – 7.75 3.60 3.19 – 4.01 1.45 1.24 – 1.70
Health
Excess weight 49.56 48.34 – 50.78 48.62 47.34 – 49.89 1.05 0.97 – 1.13
Obesity 14.86 14.01 – 15.70 16.68 15.75 – 17.61 0.90 0.82 – 1.00
Self-reported poor health status 3.19 2.79 – 3.60 5.77 5.26 – 6.29 0.72 0.61 – 0.87
Reported morbidity
Arterial hypertension 22.79 21.87 – 23.71 25.69 24.67 – 26.71 0.86 0.78 – 0.94
Diabetes 6.30 5.74 – 6.86 6.27 5.73 – 6.80 1.03 0.89 – 1.20
Breast cancer prevention (50 to 69 years old)
Mammography 94.39 92.82 – 95.96 83.09 81.04 – 85.14 2.66 1.86 – 3.81
Mammography in the past two
years 85.70 83.59 – 87.82 63.39 60.69 – 66.09 2.81 2.23 – 3.54
Pap test (25 to 59 years old)
Pap test at any point in life 91.58 90.65 – 92.52 83.97 82.72 – 85.21 1.69 1.42 – 2.00
Pap test in the past three years 87.88 86.70 – 89.06 76.84 75.38 – 78.29 1.72 1.47 – 2.02
Table 4. Distribution of risk and protective factors of Chronic Non-Communicable Diseases in the population with and without health insurance, according to levels of education in all of the 26 state capitals and the Federal District. Risk factors according to education, with plan and without plan.
Variable
0 to 8 schooling years 9 to 11 years 12 years and more
Health plan Health plan Health plan Yes No OR* 95%CI Yes No OR* 95%CI Yes No OR* 95%CI
Smoking
Smoker 12.18 20.67 0.66 0.59 – 0.74 9.13 12.09 0.69 0.58 – 0.82 9.63 10.21 0.88 0.67 – 1.16
Former smoker 32.79 29.1 0.99 0.91 – 1.09 18.34 16.51 0.94 0.83 – 1.08 16.97 14.14 1.02 0.80 – 1.29
Smokes 20
or more cigarettes 4.12 6.91 0.7 0.57 – 0.86 2.51 2.82 0.78 0.57 – 1.06 2.73 2.61 0.85 0.53 – 1.38
Passive smoker
in the household 9.2 11.48 0.82 0.73 – 0.93 11.08 14.23 0.82 0.69 – 0.98 9.08 12.99 0.72 0.55 – 0.95
Passive smoker at work 11.02 12.77 0.82 0.73 – 0.93 10.51 14.01 0.76 0.64 – 0.89 7.15 9.84 0.75 0.56 – 1.00
Consumption
FVG regularly 37.81 27.53 1.36 1.26 – 1.47 34.52 26.93 1.3 1.16 – 1.46 46.18 33.61 1.52 1.30 – 1.79
FVG recommended 22.78 17.21 1.24 1.13 – 1.35 22.73 18.69 1.19 1.05 – 1.36 30.64 22.89 1.36 1.14 – 1.62
Meat with excessive fat 29.14 36.09 0.92 0.85 – 1 32.71 34.09 1 0.9 – 1.12 27.40 32.02 0.87 0.73 – 1.03
Whole milk 51.33 56.59 0.75 0.7 – 0.81 58.15 63.83 0.84 0.76 – 0.94 44.41 66.10 0.44 0.38 – 0.52
Sot drink on
ive days or more 22.55 26.57 0.91 0.83 – 0.99 28.35 32.12 0.92 0.81 – 1.03 25.64 30.05 0.86 0.72 – 1.03
Beans on ive days or more 70.38 73.4 0.92 0.85 – 0.98 68.47 69.33 1 0.9 – 1.11 55.83 64.49 0.75 0.64 – 0.87
Physical activity
In free time 25.02 19.67 1.41 1.3 – 1.52 38.54 32.49 1.38 1.24 – 1.54 44.37 36.02 1.48 1.26 – 1.74
Commuting 9.61 18.34 0.66 0.59 – 0.73 14.2618.48 0.77 0.67 – 0.9 12.35 20.28 0.59 0.47 – 0.75
In the household 42.15 46.78 0.63 0.59 – 0.68 34.32 44.16 0.62 0.55 – 0.68 19.06 34.01 0.44 0.37 – 0.51
At work 34.8 45.63 0.79 0.73 – 0.85 42.72 45.9 0.92 0.83 – 1.03 32.95 41.38 0.71 0.60 – 0.83
Leisure or transportation 19.96 26.07 0.88 0.82 – 0.96 30.14 31.65 0.98 0.88 – 1.1 29.69 33.04 0.89 0.75 – 1.05
Inactive 19.22 15.79 1.14 1.03 – 1.26 13.28 11.68 1.09 0.93 – 1.28 16.33 13.19 1.24 1.00 – 1.53
Alcohol consumption
Abusive 9.74 15 0.94 0.85 – 1.03 16.69 18.17 0.94 0.82 – 1.07 20.55 18.01 1.27 1.04 – 1.56
Driving ater drinking 3.25 2.31 1.45 1.24 – 1.7 5.25 4.35 1.22 0.97 – 1.53 11.24 7.36 1.62 1.23 – 2.14
Health
Excess weight 57.48 53.94 1.05 0.97 – 1.13 48.3 44.53 1.04 0.94 – 1.16 46.33 39.25 1.20 1.03 – 1.40
Obesity 19.75 19.14 0.9 0.82 – 1 13.99 14.62 0.85 0.74 – 0.99 12.94 12.89 0.92 0.74 – 1.13
Self-reported
poor health status 7.14 7.82 0.72 0.61 – 0.87 2.36 3.82 0.56 0.43 – 0.74 1.53 2.59 0.53 0.34 – 0.82
Reported morbidity
Arterial hypertension 41.07 34.32 0.86 0.78 – 0.94 18.2 17.13 0.79 0.69 – 0.91 15.80 13.38 0.90 0.72 – 1.12
Diabetes 13.81 9.17 1.03 0.89 – 1.2 4.44 3.4 0.93 0.72 – 1.2 3.42 2.07 1.15 0.74 – 1.78
Breast cancer prevention (50 to 69 years old)
Mammography 90.91 81.86 2.66 1.86 – 3.81 96.95 85.83 5.25 3.11 – 8.88 96.89 89.14 3.83 1.36 – 10.81
Mammography in the
past two years 80.15 60.98 2.81 2.23 – 3.54 88.29 70.53 3.32 2.38 – 4.64 91.10 67.65 4.95 2.79 – 8.81
Pap test (25 to 59 years old)
Pap test at any point in life 90.28 84.65 1.69 1.42 – 2 91.21 82.3 1.97 1.55 – 2.5 92.44 86.75 1.55 1.08 – 2.23
Pap test in the
past three years 82.33 76 1.72 1.47 – 2.02 87.57 76.75 1.95 1.58 – 2.42 90.49 81.03 1.97 1.44 – 2.68
to that with no health plans, presents less chances of smoking, smoking passively at the household and at work, drinking whole milk, eating beans on ive days a week or more, performing physical activity during commute and in the household, and having a poor health status. On the other hand, it increases the chances of eating FVG, practicing physical activities during free time, drinking alcohol abusively, driving after drinking, presenting with excessive weight, more coverage for the prevention of breast cancer and uterine cervical cancer. The estimated prevalence in the prevention of breast cancer presents a variation coeicient superior to 30%, data not shown, so it should be used carefully.
DISCUSSION
The Vigitel survey points out that about half the population in the capitals has health insurance plans, which increases with schooling and age. The study, in general, indicates that the population with health insurance plans presents higher prevalence of protective factors, such as healthy diet, practice of physical activities during free time, coverage of preventive cancer examinations, such as mammography and the Pap test, and lower prevalence of risk factors, such as smoking, physical inactivity, poor health evaluation and arterial hypertension. The abusive alcohol consumption, the intake of meat with excessive fat, excess weight, obesity and diabetes are not associated with the variable having a health insurance plan. After being stratiied by schooling, these characteristics, in general, tend to maintain; those with health plans, regardless of schooling, usually present better indicators.
The population covered by health plans is concentrated in urban areas, in the capitals, in the most populous cities and in the South and Southeast regions of the country. These diferences can be explained by the higher concentration of richness and income in these places, therefore, this is where most health insurance plans are sold5,15,16. Data from Vigitel also pointed out
to higher coverage in the South and Southeast capitals. A study also showed that people with more schooling years (12 years or more) have more access to health plans, which is also conirmed by PNAD5. Studies show that schooling is strongly associated with income
and health17,18. Other analyses also indicate that schooling is strongly associated with having
a health insurance plan9,19-21.
Data from Vigitel 2011 show 47.4% of the coverage of health insurance plans in the group of the adult population of Brazilian state capitals and the Federal District, which is very close to 46.2%, which was estimated by the National Health Agency (ANS)22. It is
Data indicate the increased coverage of health plane with age and higher chances of elderly people having health plans. This has been described in other studies6, and also in the System of Beneiciary Information (SIB), of ANS16, which reveals this age group needs
to use these services more often15,23.
The population covered by health plans has, in general, more access to health services. Besides, there are inequalities in the access due to the unequal distribution of equipment per region, urban or rural, types of services and human resources5,24.
These characteristics have been described in other studies in the United States (USA) (BRFSS)7,8 and in Brazil9. The last study was conducted in the metropolitan region of Belo
Horizonte, and showed that individuals who have access to health insurance plans, in general, presented healthier habits, such as smoking less, practicing more physical activities during free time, eating ive or more portions of fruits, vegetables and greens, and performing more preventive examinations9.
American studies show that users without health insurance coverage present more risks of NCDs and less access to health services7,8. In general, the worst performances are in the
population that is not covered by health plans, young, non-white people, who are self-employed or unemployed, and individuals with low wages or low income7,8,25,26.
Also in the United States, the population who can access health plans performs more preventive services, such as mammography, colonoscopy and oncotic cytology7.
The protocol of the Ministry of Health, according to international rules of WHO, recommends that the Pap test should be taken every three years among women at reproductive age27. With regard
to mammography, the orientation for the periodicity of the examination is every two years, at the age group of 50 to 69 years old, once the evidence concerning the efectiveness of this examination to reduce mortality caused by breast cancer is stronger in this age group28.
Data from Vigitel are similar to those found in BRFSS, showing higher chances of women who have health insurance plans performing preventive examinations, such as mammography and oncotic cytology, which could be explained by the facilitated access to diagnostic and preventive services in this population7,8. Studies from the Research about
Sanitary Medical Care (AMS) point out to the increased ofer of beds in the private system, as well as equipment, such as the one used for mammography29. This reality tends to change
progressively, with the investment made by the Ministry of Health on the priority program to reduce breast and uterine cervical cancer30,31.
It is important to emphasize that the prevalence of mammography in the past two years in the population without health plans is lower, but it is already close to the 75% objective predicted in the National Plan to Tackle Non-Communicable Diseases for 20222,32. The same
goal has been reached in the population with health plans2,6,32. The diferences concerning
It is important to mention that diferences in the population with and without health plans persist after stratiication by schooling. However, schooling is an important factor concerning the access to these examinations: the coverage of mammography and oncotic cytology increases with schooling.
In 2008, the global prevalence of diabetes was estimated in 100%, and the one of arterial hypertension, between 25 and 40%3. The use of morbidity reported in Brazil can result in lower
prevalence rates, and the study may underestimate the prevalence of self-reported diagnoses (hypertension and diabetes), since it relects previous medical diagnoses, and therefore, the availability of services. Literature indicates advantages in this form of collection, since it is not invasive and has low cost, and the self-reported diagnosis of hypertension demonstrated to be sensitive, thus, being a good indicator33,34.
Hypertension was mostly diagnosed in the population without health plan and lower schooling, which can be explained by the more facilitated access to practices of health promotion, such as healthy diet and physical activity, besides the facilitated access to health services in the population with health insurance plans35,36. Besides, WHO points out that the prevalence of
hypertension is higher in low and mid-income countries, but interventions in the public health ield lead to the decreased prevalence of this disease in high income countries3.
There was no diference in the prevalence of diabetes among people with and without health plans. However, in relation to schooling, the ratio of diabetes was inversed, thus suggesting that schooling, proxy of socioeconomic level, be related to the more facilitated access to practices of health promotion, such as healthy diet, physical activity, besides more access to health services5.
The population covered by health plans usually presents better schooling and income and more access to information about the importance of healthy habits; besides, they have more access to spaces to practice physical activities, more resources to buy healthy food, like fruits, vegetables and greens, more knowledge about the harms of smoking, among others9. Diferent indicators of physical activity were assessed and, in general, they were
all compatible with studies that point out to the practice of physical activity during free time associated with more schooling years, higher income and having a health insurance plan9,37,38. It was possible to observe that, on the contrary, physical activity connected to
commuting, household chores and work tasks is more associated with people with no health plans and lower schooling, which is also in accordance with literature5,38,39. Lower income
and schooling end up promoting the active transportation, like the use of bicycle, bus, collective transportation and dislocations on foot to work, besides the performance of tasks that require more energy at work and care with household cleaning. It is important to mention that the domains physical activity at work and in the household are not always associated with improvements to health, since they can lead to osteomuscular diseases due to excessive and intensive use39.
higher schooling, with more access to goods and services, tend to make a better evaluation of their own health status40,41. These characteristics can explain why people with health
insurance plans make this better assessment. After stratiication by schooling, populations with more schooling years still make the best evaluations.
No diferences were found in relation to excess weight, obesity and abusive alcohol consumption. With regard to drinking and driving, the population with health insurance plans adopts this behavior more frequently, which can be justiied by fact that owning a car is related to the higher socioeconomic status. Besides, Vigitel indicates that the population with more schooling years, proxy of income, adopts this practice more frequently10.
There are some limitations to this study. Among them, the fact of using telephone interviews, including only individuals who own a landline. This can reduce the participation of lower income populations, especially in the North and Northeast regions. However, this bias has been minimized by using the expansion factors from Census. The cross-sectional design of the study does not enable to establish a temporal cause-efect relationship. Therefore, it is not possible to state that the access to health plans leads to less exposure to risk if individuals who are more concerned about their own health look for coverage in these plans. Another limitation refers to the use of self-reported morbidity. The national and international experiences show that some self-reported variables, especially arterial hypertension and assessment of health status, can obtain good estimates, besides presenting advantages such as fast information, sensitivity and low cost33,41.
CONCLUSION
Vigitel allows monitoring the distribution of risk factors continuously, as well as the access to preventive examinations, reported morbidity of NCDs, and also the comparison between this distribution and the population who is beneiciary and non-beneiciary of health insurance plans. These data are essential to establish promotion and preventive measures, as well as to provide decision makers with subsidies to elaborate health programs.
REFERENCES
1. Schmidt MI, Duncan BB, Azevedo e Silva G, Menezes AM, Monteiro CA, Barreto SM, et al. Chronic non-communicable diseases in Brazil: burden and current challenges. The Lancet 2011; 377(9781): 1949-61.
2. Brasil. Ministério da Saúde. Plano de ações estratégicas para o enfrentamento das doenças crônicas não transmissíveis (DCNT) no Brasil, 2011-2022. Brasília (DF); 2011.
3. Organização Mundial da Saúde. Global Status Report on Noncommunicable Diseases 2010. Genebra: WHO; 2011. 4. Organização Mundial da Saúde. Preventing chronic
diseases: a vital investment. Genebra: WHO; 2005. 5. Brasil. Instituto Brasileiro de Geograia e Estatística.
Pesquisa Nacional por Amostra de Domicílios (PNAD 2008). Um panorama da saúde no Brasil: acesso e utilização dos serviços, condições de saúde: 2008. Rio de Janeiro (RJ); 2010.
6. Malta DC, Morais Neto OL, Silva Junior JB. Apresentação do plano de ações estratég icas para o enfrentamento das doenças crônicas não transmissíveis no Brasil, 2011 a 2022. Epidemiol Serv Saúde 2001; 20(4): 425-38.
7. Ahluwalia IB, Bolen J, Garvin B. Health insurance coverage and use of selected preventive services by working age women, BRFSS 2006. J Womens Health (Larchmt) 2007; 16(7): 935-40.
8. Nelson KM, Chapko MK, Reiber G, Boyko EJ. The association between health insurance coverage and diabetes care; data from the 2000 behavior risk factor surveillance system. Health Serv Res 2005; 40(2): 361-72.
9. Lima-Costa MF. Estilos de vida e uso de serviços preventivos de saúde entre adultos iliados ou não a plano privado de saúde (inquérito de saúde de Belo Horizonte). Ciênc Saúde Coletiva 2004; 9(4): 857-64. 10. Brasil. Ministério da Saúde. Secretaria de Vigilância
em Saúde. Vigitel Brasil 2011: Vigilância de fatores de risco e proteção para doenças crônicas por inquérito telefônico. Brasília; 2012.
11. Kalton G, Flores-Cervantes I. Weighting Methods. J Of Stat 2003; 19(2): 81-97.
12. Bernal RTI. Inquéritos por telefone: inferências válidas em regiões com baixa taxa de cobertura de linhas residenciais [Tese de Doutorado]. São Paulo: Universidade de São Paulo; 2011.
13. Izrael D, Hoaglin DC, Battaglia MP. A SAS Macro for Balancing a Weighted Sample; Proceedings of the Twenty-Fifth Annual SAS Users Group International Conference. 2000; Paper 275.
14. Paula GA. Modelos de Regressão com apoio computacional. Instituto de Matemática e Estatística. São Paulo (SP): Universidade de São Paulo; 2004. 15. Malta DC, Jorge AO. O mercado de saúde suplementar
e análise dos dados das operadoras selecionadas. In: ANS. Duas faces da moeda: microrregulação e modelos assistenciais na saúde suplementar. Rio de Janeiro: Ministério da Saúde; 2005.
16. Brasil. Agência Nacional de Saúde Suplementar. Caderno de Informações de Saúde Suplementar. Março/2009. 2ª Ed. Rio de Janeiro (RJ); 2009.
17. Brasil. Rede Interagencial de Informação em Saúde. Indicadores Básicos para a Saúde no Brasil: conceitos e aplicações. Brasília: Organização Pan Americana de Saúde; 2008.
18. Pincus T, Callahan LF. Associations of low formal education level and poor health status: behavioral, in addition to demographic and medical, explanations? J Clin Epidemiol 1994; 47(4): 355-61.
19. Bahia L, Costa AJ, Fernandes C, Luiz RR, Cavalcanti ML. Segmentação da demanda dos planos e seguros privados de saúde: uma análise das informações da PNAD/98. Ciênc Saúde Coletiva 2002; 7(4): 671-86. 20. Lima-Costa MF, Guerra HL, Firmo JO, Vidigal PG,
Uchoa E, Barreto SM. he Bambuí Health and Aging Study (BHAS): private health plan and medical care utilization by older adults. Cad Saúde Pública 2002: 18(1): 177-86.
21. Lima-Costa MF. A escolaridade afeta, igualmente, comportamentos prejudiciais à saúde de idosos e adultos mais jovens?: Inquérito de Saúde da Região Metropolitana de Belo Horizonte, Minas Gerais, Brasil. Epidemiol Serv Saúde 2004; 13(4): 201-8.
22. Agência Nacional de Saúde Suplementar. Tabnet. Disponível em: http://www.ans.gov.br/anstabnet/ cgi-bin/tabnet?dados/tabnet_br.def (Acessado em 11 de março de 2013).
23. Pinto LF, Soranz DR. Planos privados de assistência à saúde: cobertura populacional no Brasil. Ciênc Saúde Coletiva 2004; 9(1): 85-98.
24. Brasil. Comissão Nacional Sobre Determinantes Sociais da Saúde. Iniqüidades em saúde no Brasil, nossa mais grave doença. Rio de Janeiro: Fundação Oswaldo Cruz; 2006.
26. Hagdrup NA, Simoes EJ, Brownson, RC. Health care coverage: traditional and preventive measures and associations with chronic disease risk factors. J Community Health 1997; 22(5): 387-99.
27. Brasil. Ministério da Saúde. Instituto Nacional do Cancer. Programa Nacional de Controle do Câncer do Colo do Útero [Internet]. Disponível em: http://www2. inca.gov.br/wps/wcm/connect/acoes_programas/ site/home/nobrasil/programa_nacional_controle_ cancer_colo_utero (Acessado em 4 setembro de 2013). 28. Brasil. Ministério da Saúde. Instituto Nacional do
Cancer. Programa Nacional de Controle do Câncer de Mama [Internet]. Disponível em: http://www2. inca.gov.br/wps/wcm/connect/acoes_programas/ site/home/nobrasil/programa_controle_cancer_ mama (Acessado em 4 setembro de 2013).
29. Santos IS, Uga MA, Porto SM. O mix público-privado no Sistema de Saúde Brasileiro: inanciamento, oferta e utilização de serviços de saúde. Ciênc Saúde Coletiva 2008; 13(5): 1431-40.
30. Brasil. Ministério da Saúde. Portaria n. 827 de 23 de julho de 2013. Inclui incremento de 44,88% no valor do componente SA do procedimento Mamograia bilateral para rastreamento da Tabela de Procedimentos, Medicamentos, Órteses, Próteses e Materiais Especiais do Sistema Único de Saúde (SUS). Diário Oicial da União. 2013 Jul 24; Seção 1:38.
31. Brasil. Portaria n. 1.504 de 23 de julho de 2013. Institui a Qualiicação Nacional em Citopatologia na prevenção do câncer do colo do útero (QualiCito), no âmbito da Rede de Atenção à Saúde das Pessoas com Doenças Crônicas. Diário Oicial da União. 2013 Jul 24; Seção 1:31.
32. Malta DC, Silva JB Jr. O Plano de Ações Estratégicas para o Enfrentamento das Doenças Crônicas Não Transmissíveis no Brasil e a deinição das metas globais para o enfrentamento dessas doenças até 2025: uma revisão. Epidemiol Serv Saúde 2013; 22(1): 151-64.
33. Lima-Costa MF, Peixoto SV, Firmo JO. Validade da hipertensão arterial auto-referida e seus determinantes (projeto Bambuí). Rev Saúde Pública 2004; 38(5): 637-42. 34. Vargas CM, Burt VL, Gillum RF, Pamuk ER. Validity of self-reported hypertension in the National Health and Nutrition Examination Survey III, 1988-1991. Prev Med 1997; 26(5 Pt 1): 678-85.
35. Chobanian AV, Bakris GL, Black HR, Cushman WC, Green LA, Izzo JL Jr, et al. Seventh report of the Joint National Committee on Prevention, Detection, Evaluation, and Treatment of High Blood Pressure. Hypertension 2003; 42(6): 1206-52.
36. Ferreira SR, Moura EC, Malta DC, Sarno F. Frequência de hipertensão arterial e fatores associados: Brasil, 2006. Rev Saude Publica 2009; 43(2): 98-106. 37. Florindo AA, Hallal PC, Moura EC, Malta DC. Prática
de atividades físicas e fatores associados em adultos, Brasil, 2006. Rev Saúde Pública 2009; 43(2): 65-73. 38. Malta DC, Moura EC, Castro AM, Cruz DK, Morais Neto
OL, Monteiro CA. Padrão de atividade física em adultos brasileiros: resultados de um inquérito por entrevistas telefônicas, 2006. Epidemiol Serv Saúde 2009; 18(1): 7-16. 39. Knuth AG, Malta DC, Dumith SC, Pereira CA, Morais Neto OL, Temporão JG, et al. Prática de atividade física e sedentarismo em brasileiros: resultados da Pesquisa Nacional por Amostra de Domicílios (PNAD) 2008. Ciênc Saúde Coletiva 2011; 16(9): 3697-705. 40. Molarius A, Berglund K, Eriksson C, Lambe M, Nordström
E, Eriksson H, et al. Socioeconomic conditions, lifestyle factors, and self-rated health among men and women in Sweden. Eur J Public Health 2007; 17(2): 125-33. 41. Dachs JN, Santos AP. Auto-avaliação do estado de
saúde no Brasil: análise dos dados da PNAD/2003. Ciênc Saúde Coletiva 2006; 11(4): 887-94.
Received on: 11/09/2013