Carla de Oliveira BernardoI Antonio Fernando BoingII Francisco de Assis Guedes de VasconcelosIII
Karen Glazer PeresII Marco Aurélio PeresII
I Programa de Pós-graduação em Saúde
Coletiva. Departamento de Saúde Pública. Centro de Ciências da Saúde. Universidade Federal de Santa Catarina. Florianópolis, SC, Brasil
II Programa de Pós-graduação em Saúde
Coletiva. Departamento de Saúde Pública. Centro de Ciências da Saúde. Universidade Federal de Santa Catarina. Florianópolis, SC, Brasil
III Programa de Pós-graduação em Nutrição.
Departamento de Nutrição. Centro de Ciências da Saúde. Universidade Federal de Santa Catarina. Florianópolis, SC, Brasil Correspondence:
Carla de Oliveira Bernardo
Campus Universitário Reitor João David Ferreira Lima. Centro de Ciências da Saúde. Departamento de Saúde Pública, sala 131. Trindade
88040-970 Florianópolis, SC, Brasil E-mail: [email protected] Received: 9/21/2011
Approved: 4/1/2012
Article available from: www.scielo.br/rsp
Association between tooth loss
and obesity in Brazilian adults:
a population-based study
Associação entre perda dentária e
obesidade em adultos: estudo de
base populacional
ABSTRACT
OBJECTIVE: To examine the association between tooth loss and general and central obesity among adults.
METHODS: Population-based cross-sectional study with 1,720 adults aged 20 to 59 years from Florianópolis, Southern Brazil. Home interviews were performed and anthropometric measures were taken. Information on sociodemographic data, self-reported diabetes, self-reported number of teeth, central obesity (waist circumference [WC] > 88 cm in women and > 102 cm in men) and general obesity (body mass index [BMI] ≥ 30 kg/m2)
was collected. We used multivariable Poisson regression models to assess the association between general and central obesity and tooth loss after controlling for confounders. We also performed simple and multiple linear regressions by using BMI and WC as continuous variables. Interaction between age and tooth loss was also assessed.
RESULTS: The mean BMI was 25.9 kg/m2 (95%CI 25.6;26.2) in men and
25.4 kg/m² (95%CI 25.0;25.7) in women. The mean WC was 79.3 cm (95%CI 78.4;80.1) in men and 88.4 cm (95%CI 87.6;89.2) in women. A positive association was found between the presence of less than 10 teeth in at least one arch and increased mean BMI and WC after adjusting for education level, self-reported diabetes, gender and monthly per capita income. However, this association was lost when the variable age was included in the model. The prevalence of general obesity was 50% higher in those with less than 10 teeth in at least one arch when compared with those with 10 or more teeth in both arches after adjusting for education level, self-reported diabetes and monthly
per capita family income. However, the statistical signifi cance was lost after controlling for age.
CONCLUSIONS: Obesity was associated with number of teeth, though it depended on the participants’ age groups.
Obesity is a public health concern associated with chronic diseases such as diabetes and cardiovascular diseases. Its prevalence is increasing not only in high-income countries but also in medium- and low-high-income countries.19
In Brazil the prevalence of overweight and obesity increased progressively in the four national population-based surveys conducted between 1974-1975 and 2008-2009. In adults the prevalence of overweight increased from 15.7% to 37.7% in men and from 20.7% to 31.1% in women. During this same period, obesity increased from 2.8% to 12.4% and from 8.0% to 16.9% in men and women, respectively.a
RESUMO
OBJETIVO: Analisar a associação entre perda dentária e obesidade geral e central em adultos.
MÉTODOS: Estudo transversal de base populacional com 1.720 adultos (20 a 59 anos) de Florianópolis, SC, em 2009. Entrevistas e medidas antropométricas foram realizadas nos domicílios. Foram incluídos dados sociodemográfi cos, diabetes e número de dentes autorreferidos, obesidade central (circunferência da cintura > 88 cm em mulheres e > 102 cm em homens) e geral (índice de massa corporal ≥ 30 kg/m2). Utilizou-se um modelo múltiplo por meio da
regressão de Poisson para associações entre obesidade geral e central e perda dentária após controle pelas variáveis de confusão. Também foram realizadas análises de regressão linear simples e múltipla utilizando índice de massa corporal e circunferência da cintura como variáveis contínuas. A interação entre idade e perda dentária também foi investigada.
RESULTADOS: A média de índice de massa corporal foi 25,9 kg/m2 (IC95%
25,6;26,2) em homens e 25,4 kg/m² (IC95% 25,0;25,7) em mulheres. A média de circunferência da cintura foi 79,3 cm (IC95% 78,4;80,1) nos homens e 88,4 cm (IC95% 87,6;89,2) nas mulheres. Observou-se associação positiva entre a presença de menos de dez dentes em pelo menos uma arcada e o aumento do índice de massa corporal e da circunferência da cintura após ajuste para escolaridade, diabetes autorreferida, sexo e renda mensal per capita. Entretanto, essa associação foi perdida quando a idade foi incluída no modelo. A prevalência de obesidade geral foi 50% maior em adultos que apresentavam menos de dez dentes em pelo menos uma arcada quando comparados àqueles com dez ou mais dentes em ambas as arcadas após ajuste para escolaridade, diabetes autorreferida e renda mensal per capita. Porém, a signifi cância estatística foi perdida após controle pela idade.
CONCLUSÕES: Obesidade foi associada ao número de dentes, entretanto dependeu do grupo etário dos participantes.
DESCRITORES: Perda de Dente, epidemiologia. Obesidade, epidemiologia. Fatores de Risco. Fatores Socioeconômicos. Estudos Transversais.
INTRODUCTION
a Instituto Brasileiro de Geografi a e Estatística. Pesquisa de Orçamentos Familiares 2008-2009. Antropometria e análise do estado nutricional
de crianças, adolescentes e adultos no Brasil. Rio de Janeiro: IBGE, 2010.
b Ministério da Saúde. Secretaria de Atenção à Saúde. Departamento de Atenção Básica. Projeto SBBrasil 2010: resultados principais.
Brasília; 2011.
Some studies have shown an association between obesity and tooth loss.12,14 The most plausible
explana-tion is an associaexplana-tion between patterns of food intake with number of natural teeth. It has been documented that individuals who lost all their natural teeth may less frequently consume vegetables, dietary fi ber, wholemeal bread than who those with natural teeth.15
In 2003, the prevalence of edentulism – complete tooth loss – among Brazilian adults aged 35 to 44 years was 9%, with a median tooth loss of 11. Tooth loss was strongly associated with living in rural areas, female gender, poor socioeconomic condition, low schooling, and older age.1In this same age group, in 2010, mean
c Instituto Brasileiro de Geografi a e Estatística. Estimativa da população. Rio de Janeiro; 2009. d Instituto Brasileiro de Geografi a e Estatística. Censo Demográfi co 2000. Rio de Janeiro; 2003.
Most studies that assessed the association between tooth loss and obesity were carried out in elderly popula-tions15 or only focused on the association between
tooth loss and specifi c nutrient intake,7 studied small
samples,10 and investigated specifi c populations.2
There are limited data associating tooth loss with obesity in adult populations. This is concerning because prevention and early detection programs may help reduce potential damage of tooth loss and related health effects later in life. Ostberg et al12 found an
association between tooth loss and general obesity in a defi ned Swedish rural adult population, regardless of age, gender, socioeconomic status, lifestyle and comorbidities. To the best of our knowledge there are no other well-designed, population-based studies that investig ated the association of obesity and tooth loss in adults controlling for well-known confounders. This study aimed to assess the association between tooth loss and general and central obesity in adults.
METHODS
A population-based cross-sectional study was carried out in Florianópolis, Southern Brazil, between September 2009 and January 2010. Florianópolis is the capital city of the state of Santa Catarina with a population of approximately 400,000 inhabitantsc. It
has the highest health and social indicators in Brazil, including an infant mortality rate of 8 per 1,000 live-borns and a Municipal Human Development Index of 0.875 compared with 19.5 per 1,000 and 0.813, respectively, for Brazil as a whole.d The target
popula-tion of this study included all adults aged 20 to 59 years living in the urban area of the city (almost 96% of the entire population), totaling nearly 240,000 inhabitants. This study is a part of a comprehensive large study
EpiFloripa 2009, a health survey conducted in adults to investigate self-rated health, self-reported diseases, oral health, health services utilization and main risk factors for chronic diseases, such as socioeconomic and demographic characteristics, diet, physical activity, blood pressure, anthropometric measurements, and alcohol and tobacco use.
The sample size was calculated to estimate the prevalence of each of the above mentioned outcomes considering the following parameters: unknown preva-lence (50%), 95% confi dence level, a sample error of 3.5 percentage points, a design effect of 2 due to the cluster sampling and an additional 10% to compensate for refusals. The minimum sample size estimated was 1,720. As the study was nested in a larger health survey, the fi nal sample was 2,016 after estimating each of
the studied outcomes. Aposteriori we calculated the minimum sample size required to investigate the asso-ciation between tooth loss (exposure) and general and central obesity (outcomes) adopting a 95% confi dence level (error type I of 5%), a power of 80% (error type II of 20%), a minimum relative risk to be detected of 1.4, and a prevalence of the outcomes of 14% among the unexposed population. Finally, we added 10% to compensate for refusals. The fi nal sample to test the association between tooth loss and obesity was 1,615 adults.
A two-stage sample selection was performed. First, we selected 60 census tracts among all 420 tracts in the urban area of the city. Second, we selected the occupied households and then all adult residents living there. All 420 urban census tracts were ordered according to the average monthly income of the household head.d We
used a systematic sample of 60 census tracts (60/420 or 1/7), i.e., six census tracts in each income decile. All selected census tracts were visited by the fi eldwork team and all occupied houses were checked and counted in order to update the number of residents in the selected clusters. As the number of households ranged from 61 to 810 households, some census tracts were merged to reduce the variability among the number of households in each tract and ensure a self-weighting sample. There were 63 census tracts totaling 16,755 eligible households, of which 1,134 were selected for this study. There were selected on average 32 adults in each census tract. All adults aged 20 to 59 years and living in the selected households were eligible. Exclusion criteria included amputees; bedridden individuals; individuals with casts; individuals who could not remain in the required position for measurements; and those who not able to answer the questionnaire. All respondents were the adults selected; no other unselected individual was allowed to answer the questionnaire. Anthropometric and blood pressure measurements were not taken from pregnant women and women up to six months after delivery.
Home visits included a face-to-face questionnaire applied with the use of personal digital assistants (PDA), two blood pressure measurements and anthro-pometric measurements including weight, height and waist circumference (WC). All 35 interviewers/evalu-ators were women previously trained for fi eld work. The questionnaire was pre-tested with 35 adults not included in the sample and who were living within the coverage area of a local health center. The pilot study included almost 100 adults living close to the research headquarters within two unselected census tracts. Anthropometric measurements were taken following the proposed Lohman et al11 recommendations.Body
capacity of 150 kg, sensitivity of 100 g, calibrated before the training and fi eld work. They were placed on a level surface and respondents were weighted wearing light clothes and standing with their feet placed together and their arms hanging at sides. Height was measured twice with a stadiometer specifi cally made for the study with an inelastic measuring tape with 1-mm resolution. The respondents were placed in the orthostatic position, barefoot, with the head in the Frankfurt position without any ornaments, placing shoulders, gluteal muscles and heels against the wall and feet side-by-side. Height was the average of two measures. Body mass index (BMI) was calculated as weight in kg divided by the square height in meters.
WC measures were taken using an anthropometric inelastic tape with millimeter markings (Sanny®) with
1-mm resolution. They were taken at the narrowest waist level, or if this was not apparent, at the midpoint between the lowest rib and the top of the iliac crest. Evaluators were instructed when recording to make sure the tape was not too tight or too loose, was lying
fl at on the skin and horizontal. WC was the average of two measures. Reliability measures were calculated as recommended by Ulijaszek & Kerr17 and Gore et al6
using technical measurement errors in percent point for both intra- and interevaluator errors. The inter- and intra-examiner technical error of measurement (TEM) was calculated according to the recommendations of Gore et al.6 The maximum inter-examiner TEM (1.86%)
and intra-examiner TEM (1.18%) was found in the WC measure, which indicated an adequate level of interviewers for anthropometric measurements. We analyzed two outcomes: general obesity using BMI as a binary variable (obese: ≥ 30 kg/m² and non-obese: < 30 kg/m²) and central obesity using WC (obese: ≥ 102 cm for men and ≥ 88 cm for women; non-obese: < 102 cm for men and < 88 cm for women).18 In
addition we used BMI and WC as continuous variables. The number of self-reported remaining natural teeth for each dental arch was recorded as follows: ≥ 10 natural teeth; one to nine natural teeth; no natural teeth. A variable was created to include those with ≥ 10 natural teeth in both arches, < 10 teeth at least in one arch,and those completely edentulous.
The controlling variables included: gender; age (years); education level (years of schooling); monthly per capita
income (in the Brazilian currency real: R$ 1.7 was U$ 1 at the time of data collection); self-reported skin color (white, black, brown); and self-reported diabetes. Skin color classifi cation followed the Instituto Brasileiro de Geografi a e Estatística (IBGE – Brazilian Institute of Geography and Statistics) recommendations. Monthly
per capita income was calculated as the sum of incomes of all family members divided by the number of people living in the household. It was classifi ed into tertiles
(1st: ≤ US$ 333.34; 2nd: US$ 333.35 to US$ 764.71;
3rd: ≥ US$764.72).Age was also considered an effect
modifi er variable.
All eligible adults were visited at least four times, with at least one visit on weekends and one in the evening. If an individual was not located or refused to partici-pate, it was considered a loss. We adopted a scheme of sampling with no replacement.
Data quality control consisted of applying a short version of the questionnaire (10 questions) through a telephone interview to 15% of the whole sample (n = 248). Among the variables investigated the intra-class correlation coeffi cient was 0.99 for age and the kappa value was 0.9 for self-reported diabetes. Data stored in the PDAs were entered into Stata 9.0 software. Data analysis included the sample description and bivariate cross-tabulation of two binary outcomes (BMI and WC) against the main explanatory variable (number of natural teeth) and other covariates. For comparisons among groups, we used Pearson χ2 tests
and linear trends when appropriate. P-values of less than 0.05 were statistically signifi cant. We used multivari-able Poisson regression models to estimate prevalence ratios and 95% confi dence intervals.In addition, we performed simple and multiple linear regressions using BMI and WC as continuous variables. The interaction between tooth loss and age was assessed using the heterogeneity test. All explanatory variables with a p-value of 0.20 or less were included in the multivari-able models. All analyses were performed considering the cluster sample design and sampling weight using the Stata svy command.
The research project was approved by the Research Ethics Committee of Universidade Federal de Santa Catarina (protocol #351/08, December 15th, 2008). All
respondents signed a consent before participating and for anthropometric and blood pressure measurements and examinations. Adults with high blood pressure levels or pain were referred to the nearest local health center.
RESULTS
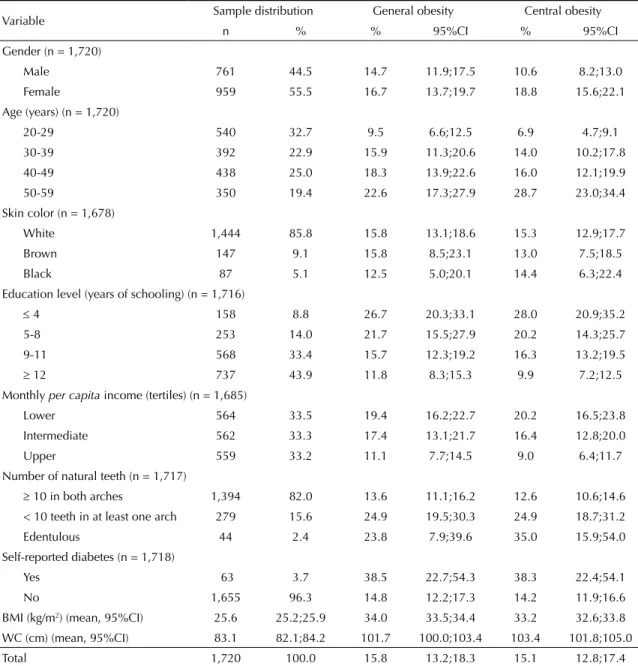
Of a total of 2,016 eligible adults, 85.3% were studied (n = 1,720). Female to male ratio was 1.26. Approximately one-third were between 20 and 29 years of age. Most reported having white skin color, and the great majority (82%) had 10 or more teeth in both arches. General obesity was found in 15.8% of the sample, and the prevalence of central obesity was quite similar (15.1%) (Table 1).
The mean BMI was 25.9 kg/m2 and 25.3 kg/m2 among
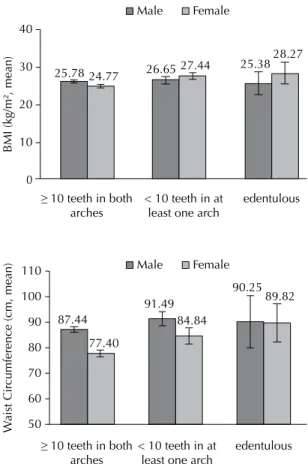
Figure 1 shows that the difference in mean BMIs among men with different numbers of teeth was not statistically signifi cant (p = 0.193). Women with less 10 teeth in at least one arch and edentulous women had higher mean BMI than those with 10 or more teeth on both arches (p < 0.001). The mean BMI was lower in women than men with 10 or more teeth on both arches (p < 0.001). Also, compared to men, women with 10 or more teeth in both arches (p < 0.001) and less than 10 teeth in at least one arch (p < 0.001) had a lower mean WC. Among men mean BMI was higher in those with less than 10 teeth in at least one arch than those with 10 or more teeth on both arches (p = 0.007). In addition, women with less than 10 teeth in both arches and edentulous women had
Table 1. Sample distribution and prevalence of general and central obesity according to independent variables in adults. Florianópolis, Southern Brazil, 2009.
Variable Sample distribution General obesity Central obesity
n % % 95%CI % 95%CI
Gender (n = 1,720)
Male 761 44.5 14.7 11.9;17.5 10.6 8.2;13.0
Female 959 55.5 16.7 13.7;19.7 18.8 15.6;22.1 Age (years) (n = 1,720)
20-29 540 32.7 9.5 6.6;12.5 6.9 4.7;9.1 30-39 392 22.9 15.9 11.3;20.6 14.0 10.2;17.8 40-49 438 25.0 18.3 13.9;22.6 16.0 12.1;19.9
50-59 350 19.4 22.6 17.3;27.9 28.7 23.0;34.4 Skin color (n = 1,678)
White 1,444 85.8 15.8 13.1;18.6 15.3 12.9;17.7 Brown 147 9.1 15.8 8.5;23.1 13.0 7.5;18.5
Black 87 5.1 12.5 5.0;20.1 14.4 6.3;22.4 Education level (years of schooling) (n = 1,716)
4 158 8.8 26.7 20.3;33.1 28.0 20.9;35.2 5-8 253 14.0 21.7 15.5;27.9 20.2 14.3;25.7 9-11 568 33.4 15.7 12.3;19.2 16.3 13.2;19.5
12 737 43.9 11.8 8.3;15.3 9.9 7.2;12.5 Monthly per capita income (tertiles) (n = 1,685)
Lower 564 33.5 19.4 16.2;22.7 20.2 16.5;23.8 Intermediate 562 33.3 17.4 13.1;21.7 16.4 12.8;20.0
Upper 559 33.2 11.1 7.7;14.5 9.0 6.4;11.7 Number of natural teeth (n = 1,717)
10 in both arches 1,394 82.0 13.6 11.1;16.2 12.6 10.6;14.6 < 10 teeth in at least one arch 279 15.6 24.9 19.5;30.3 24.9 18.7;31.2
Edentulous 44 2.4 23.8 7.9;39.6 35.0 15.9;54.0 Self-reported diabetes (n = 1,718)
Yes 63 3.7 38.5 22.7;54.3 38.3 22.4;54.1 No 1,655 96.3 14.8 12.2;17.3 14.2 11.9;16.6
BMI (kg/m2) (mean, 95%CI) 25.6 25.2;25.9 34.0 33.5;34.4 33.2 32.6;33.8
WC (cm) (mean, 95%CI) 83.1 82.1;84.2 101.7 100.0;103.4 103.4 101.8;105.0 Total 1,720 100.0 15.8 13.2;18.3 15.1 12.8;17.4 BMI: body mass index; WC: waist circumference
higher mean WC than those with 10 or more teeth on both arches (p < 0.001) (Figure 1).
per capita income, self-reported diabetes and education level (model 5). However, when the model was adjusted for age, the association between the number of teeth and WC lost its statistical signifi cance.
The multivariable Poisson regression analysis between number of teeth and prevalence of general obesity showed that the prevalence of general obesity was 50% higher in those with less than 10 teeth in at least one arch when compared with those with 10 or more teeth in both arches after adjusting for monthly per capita income, self-reported diabetes and education level (model 5). However, it lost its statistical signifi cance after control-ling for age (model 6)(Table 3). Very similar results were observed when the prevalence of central obesity was analyzed in the multivariable Poisson regression model. The prevalence of central obesity was 50% higher in indi-viduals with less than 10 teeth in at least one arch when compared with those with 10 or more teeth in both arches after adjusting for gender, monthly per capita income, self-reported diabetes and education level (model 5), but lost its statistical signifi cance after including age in the model (model 6) (Table 3). The interaction between tooth loss and age was identifi ed in adults with general and central obesity (p < 0.001) (Figure 2).
Figure 1. Distribution of mean body mass index (kg/m2) and
waist circumference (cm) and their 95% confi dence intervals according to number of natural teeth and gender among adults. Florianópolis, Southern Brazil, 2009.
10 teeth in both arches
BMI (kg/m², mean)
W
aist Cir
cumference (cm, mean)
10 0 20 30 40 25.78 24.77 87.44 77.40 91.49 84.84 90.25 89.82 26.65 27.44 25.38
28.27
< 10 teeth in at least one arch
edentulous
10 teeth in both arches
< 10 teeth in at least one arch
edentulous Male Female Male Female 50 60 70 80 90 100 110 Table 2.
Simple and multi
variable linear regression models of the association between bod
y mass index (kg/m
2) and w
aist cir
cumference (cm) and number of natur
al teeth in adults. Florianópolis,
Southern Br azil, 2009. V ariable Model 1 b Model 2 a Model 3 a Model 4 a Model 5 a Model 6 a Coeff.(95%CI) p-v alue Coeff.(95%CI) p -v alue Coeff.(95%CI) p -v alue Coeff.(95%CI) p-v alue Coeff.(95%CI) p -v alue Coeff.(95%CI) p-value BMI (kg/m 2)
Number of natur
al teeth < 0.001 < 0.001 < 0.001 < 0.001 0.005 0.748
10 in both ar
ches reference reference reference reference reference reference
< 10 in at least one ar
ch 1.9 (1.3;2.5) 1.9 (1.3;2.5) 1.8 (1.1;2.4) 1.7 (1.1;2.2) 1.4 (0.7;2.0) 0.4 (-0.4;1.1) edentulous 2.1 (-0.3;4.5) 2.1 (-0.3;4.5) 1.8 (-0.5;4.2) 1.4 (-0.8;3.7) 0.9 (-1.4;3.3) -0.4 (-2.7;1.9)
WC (cm)
Number of natur
al teeth < 0.001 < 0.001 < 0.001 < 0.001 < 0.001 0.512 ≥
10 in both ar
ches reference reference reference reference reference reference
< 10 in at least one ar
ch 5.6 (3.6;7.6) 6.0 (4.0;8.0) 5.7 (3.8;7.7) 5.5 (3.6;7.3) 4.6 (2.6;6.7) 0.7 (-1.4;2.9) edentulous 7.9 (2.8;13.1) 8.8 (3.2;14.5) 8.2 (2.6;13.9) 7.3 (1.9;12.7) 5.8 (0.3;11.2) 0.8 (-4.3;5.9) aAdjusted; b Unadjusted; Model 1: Crude analysis; Model 2: Number of natur
al teeth + gender; Model 3: Number of natur
al teeth + gender + mo
nthly
per capit
a
income; Model 4: Number
of natur
al teeth + gender + monthly
per capit
a
income + self-reported diabetes; Model 5:
Number of natur
al teeth + gender + monthly
per capit
a
income + self-reported diabetes + education
lev
el; Model 6: Number of natur
al teeth + gender + monthly
per capit
a
family income + self-reported diabetes + education lev
el + age. BMI: bod
y mass index;
WC: w
aist cir
Tooth loss and obesity in Br
azilian adults
Bernardo CO et al
DISCUSSION
T
o our know
le dge , t hi s i s t he fi rs t popul at ion-ba se d st udy c arri ed out out si de hi gh-i nc om e c ount ri es t ha t te ste d t he a ss oc ia tion be tw ee n t oot h l os s a nd ge ne ra l a nd ce nt ra l obe sit y a m ong a dul ts . W
e found t
ha t ge ne ra l a nd ce nt ra l obe sit y w as a ss oc ia te d w ith num be
r of t
ee th a ft er adj us
ting for m
ont hl y pe r c api ta i nc om e, s el f-re port ed di abe te s a nd e duc at ion l eve l i n bot h P oi ss on re gre ss ion and l ine ar re gre ss ion a na lys is . H ow eve r, w he n w e a dde d age in t he m ode l, t he a ss oc ia tion be tw ee n t oot h l os s a nd ge ne ra l a nd c ent ra l obe sit y l os t i ts s ta tis tic al s igni fi c anc e. W e c arri ed out a n a na lys is s tra ti fi e
d by a
ge de spi te t he ri
sk of l
os ing t he s ta tis tic al pow
er of t
he s am pl e a nd found i nc re as ed t oot h l os s w ith i nc re as ing a ge . T he as soc ia tions w ere s im ila r t o t hos e i n t he e nt ire s am pl e, so w e de ci de d t o s how the a na lys is for t he e nt ire s am pl e. A s im ila r s tudy c arri ed out i n S w ede n re port ed t ha t in a dul ts a ge
d 30 t
o 59 ye
ars t he re w as a n a ss oc ia tion be tw ee n t oot h l os s a nd bot h ge ne ra l a nd c ent ra l obe sit y re ga rdl es
s of s
oc ioe conom ic c ondi tion, l ife st yl e a nd com orbi di tie s.12 In t hi s s tudy t he num be
r of t
ee th w as al so s el f-re port ed. O ur s
tudy found a
hi ghe r proport ion of adul ts w ith l es s t ha
n 10 t
ee th i n a t l ea st one a rc h (25.7%) Figur e 2.
Heterogeneity test of the inter
action between tooth
loss and age in adults with gener
al and centr
al obesity
.
Flo-rianópolis, Southern Br
azil, 2009. 25 20 15 10 5 0 25 20 15 10 5 0 Age edentulous
<10 in at
least on
e ar
ch
10 teeth i
n
both ar
ches
edentulous
< 10 in at
least on
e ar
ch
10 teeth i
n
both ar
ches
Central obesity (%) General obesity (%)
40 to 49 y
ears
50 to 59 y
ears
30 to 39 y
ears
20 to 29 y
ears
Variable Model 1
b Model 2a Model 3a Model 4a Model 5a Model 6a
PR(95%CI) p-value PR(95%CI) p-value PR(95%CI) p-value PR(95%CI) p-value PR(95%CI) p-value PR(95%CI) p-value
General obesity Number of natural teeth < 0.001 < 0.001 0.001 0.003 0.037 0.510
10 in both arches reference reference reference reference reference reference
< 10 in at least one arch 1.8(1.4;2.4) 1.8(1.4;2.4) 1.7(1.3;2.3) 1.6(1.2;2.2) 1.5(1.1;2.0) 1.2(0.9;1.7)
Edentulous 1.7(0.9;3.4) 1.7(0.9;3.3) 1.6(0.8;3.0) 1.4(0.7;2.5) 1.2(0.6;2.3) 0.9(0.5;1.8)
Age*number of teeth p < 0.001
Central obesity Number of natural teeth < 0.001 < 0.001 < 0.001 < 0.001 0.002 0.933
10 in both arches reference reference reference reference reference reference
< 10 in at least one arch 2.0(1.5;2.6) 1.9(1.4;2.6) 1.8(1.3;2.4) 1.7(1.3;2.3) 1.5(1.1;2.1) 1.0(0.7;1.4)
Edentulous 2.8(1.6;4.7) 2.6(1.6;4.4) 2.2(1.3;3.6) 1.9(1.2;3.1) 1.6(1.0;2.6) 1.0(0.6;1.5)
Age*number of teeth p < 0.001
aAdjusted; b Unadjusted; Model 1: Crude analysis; Model 2: Number of natural teeth + “gender”; Model 3: Number of natural teeth + “gender” + monthly per capita income. Model 4:
Number of natural teeth + “gender” + monthly per capita income + self-reported diabetes; Model 5: Number of natural teeth + “gender” + monthly per capita income + self-reported diabetes
+ education level; Model 6: Number of natural teeth + “gender” + monthly per capita income + self-reported diabetes + education level + age. The between quotes variable showed a p-value
compared to the Swedish study (10.6%) associated with central obesity. In addition, 24.8% of adults with general obesity had less than 10 teeth in at least one arch, which is higher than the 11% found in the Swedish study.12
Despite similar data collection on weight, height and number of teeth, the differences between the fi ndings of these studies may be due to specifi c characteris-tics of the populations evaluated. For example, our sample comprised urban adults while rural adults were studied in the Swedish study. In addition, differences in cultural and socioeconomic characteristics and dietary patterns between these two populations should be taken into account.
Previous studies found an association between obesity and tooth loss in older people. Our purpose was to test whether this association occurs earlier in life so that prevention actions could be taken to prevent this health problem later.8,14
Obesity is a multifactorial, chronic, non-transmissible disease, and its etiology involves genetic and behavioral factors including inadequate food intake.9 Dietary data
were collected but were not included in this study because the food questionnaire was formulated only to compare with a national study that used the same questionnaire through telephone interviews. Therefore the issues of the food questionnaire did not represent the dietary pattern of the population and were inappropriate for this study. The effect of food intake on nutritional status and oral health is cumulative and requires a longer follow-up to capture trends and habits over time. It is well-known16
that tooth loss leads to consumption of foods that are easy to chew and usually high in calorie density.
Our results suggest the external validity of the study. The prevalence of general and central obesity in this study was almost 16%, identical to that found in the Brazilian Household Survey 2008-2009 in Southern Brazil.a General obesity rates were similar in both
men and women and higher in less educated, poorer, and older adults and those who self-reported diabetes. Similar central obesity results were found by age, education level, monthly per capita family income, and self-reported diabetes, but higher rates were seen in women than in men.
A comparison of our results with other studies is diffi -cult since studies evaluating the association between obesity and tooth loss among young adults are scarce. This study has some limitations. We relied on self-reported number of natural teeth. However, several validation studies showed there was no signifi cant difference between self-reported number of teeth and actual number of teeth determined by clinical examina-tion regardless of age and gender.3-5,13
Age was identifi ed as a confounder of the relationship betweennumber of teeth and obesity and was also an effect-modifying variable. We found an interaction between age and tooth loss in obesity. The prevalence of obesity varies across different age groups depending on the number of teeth. Individuals with less than 10 teeth in at least one arch and edentulous adults showed higher obesity rates by age, which suggests that age modifi ed the effect of tooth loss on obesity. This result is not straightforwardly understood and the main expla-nation for this fact lies on dietary changes with aging and tooth loss. Food intake pattern changes according to the presence and number of natural teeth.
The prevalence of obesity is increasing in Brazil. Its known association with tooth loss in older adults calls for further studies that also examine food intake in young adults. Thus it is possible to provide insight for the promotion of oral health and healthy eating habits and earlier prevention of tooth loss and obesity. A second wave of this study is to be carried out including a detailed dental examination, anthropometric measure-ments and dietary patterns to test the hypothesis formu-lated here. A longitudinal study can help better understand the complex relationship between tooth loss and obesity.
ACKNOWLEDGEMENTS
1. Barbato PR, Nagano HCM, Zanchet FN, Boing AF, Peres MA. Perdas dentárias e fatores sociais, demográfi cos e de serviços associados em adultos brasileiros: uma análise dos dados do Estudo Epidemiológico Nacional (Projeto SB Brasil
2002-2003).Cad Saude Publica. 2007;23(8):1803-14. DOI:10.1590/S0102-311X2007000800007
2. Barbato PR, Peres MA. Perdas dentárias em
adolescentes brasileiros e fatores associados: estudo de base populacional. Rev Saude Publica. 2009;43(1):13-25. DOI:10.1590/S0034-89102009000100003
3. Cyrino RM, Miranda Cota LO, Pereira Lages EJ, Bastos Lages EM, Costa FO. Evaluation of self-reported measures for prediction of periodontitis in a sample of Brazilians. J Periodontol. 2011;82(12):1693-704. DOI:10.1902/jop.2011.110015
4. Dietrich T, Stosch U, Dietrich D, Schamberger D, Bernimoulin JP, Joshipura K. The accuracy of individual self-reported items to determine periodontal disease history. Eur J Oral Sci. 2005;113(2):135-40. DOI:10.1111/j.1600-0722.2004.00196.x
5. Gilbert GH, Chavers LS, Shelton BJ. Comparison of two methods of estimating 48-month tooth loss incidence. J Public Health Dent. 2002;62(3):163-9. DOI:10.1111/j.1752-7325.2002.tb03438.x
6. Gore C, Norton K, Olds T, Whittingham N, Birchall K, Clough M, et al. Accreditation in anthropometry: an Australian model. In: Norton K, Olds T, editors. Anthropometrica. Sydney: University of New South Wales Press; 1996. p.395-411.
7. Hung H-C, Colditz G, Joshipura KJ. The association between tooth loss and the self-reported intake of selected CVD-related nutrients and foods among US women. Community
Dent Oral Epidemiol. 2005;33(3):167-73.
DOI:10.1111/j.1600-0528.2005.00200.x
8. Johansson I, Tidehag P, Lundberg V, Hallmans G. Dental status, diet and cardiovascular risk factors in middle-aged people in northern Sweden.
Community Dent Oral Epidemiol. 1994;22(6):431-6.
DOI:10.1111/j.1600-0528.1994.tb00792.x
9. Kant A, Graubard BI. Energy density of diets reported by American adults: association with
food group intake, nutrient intake, and body weight. Int J Obes (Lond). 2005;29(8):950-6. DOI:10.1038/sj.ijo.0802980
10. Kwok T, Yu CNF, Hui HW, Kwan M, Chan V. Association between functional dental state and dietary intake of Chinese vegetarian old age home residents. Gerodontology. 2004;21(3):161-6. DOI:10.1111/j.1741-2358.2004.00030.x
11. Lohman TG, Roche AF, Martolell R. Anthropometric standardization reference manual. Illinois: Human Kinetics Books; 1988.
12. Ostberg A, Nyholm M, Gullberg B, Råstam L,, Lindblad U. Tooth loss and obesity in a defi ned Swedish population. Scand J Public Health. 2009;37(4):427-33. DOI:10.1177/1403494808099964
13. Pitiphat W, Garcia RI, Douglass CW, Joshipura KJ. Validation of self-reported oral health
measures. J Public Health Dent. 2002;62(2):122-8. DOI:10.1111/j.1752-7325.2002.tb03432.x
14 Sahyoun NR, Lin C, Krall E. Nutritional status of the older adult is associated with dentition status. J Am Diet Assoc. 2003;103(1):61-6. DOI:10.1053/jada.2003.50003
15. Sheiham A, Steele JG, Marcenes W, Lowe C, Finch S, Bates CJ, et al. The relationship among dental status, nutrient intake, and nutritional status in older people. J Dent Res. 2001;80(2):408-13. DOI:10.1177/00220345010800020201
16. Suzuki K, Nomura T, Sakurai M, Sugihara N, Yamanaka S, Matsukubo T. Relationship between number of present teeth and nutritional intake in institutionalized elderly. Bull Tokyo Dent Coll. 2005;46(4):135-43. DOI:10.2209/tdcpublication.46.135
17. Ulijaszek SJ, Kerr DA. Anthropometrics measurement error and the assessment of nutritional status. Brit J Nut. 1999;82(3):165-77. DOI:10.1017/S0007114599001348
18. World Health Organization. Physical status: the use and interpretation of anthropometry. Geneva; 1995.
19. World Health Organization. Obesity: preventing and managing the global epidemic. Geneva; 2000. (Technical Report Series, 894).
REFERENCES
The project was supported by the Conselho Nacional de Desenvolvimento Científi co e Tecnológico (CNPq – National Council for Scientifi c and Technological Development, grant number 485327/2007-4). Bernardo CO was supported by CNPq Master’s grant and Peres KG, Vasconcelos FAG and Peres MA were supported by CNPq productivity in research grants.