O
ri
gi
na
l
a
rt
ic
le
s
Peripheral and central auditory assessment in among the elderly
Alessandra Giannella Samelli1 Carla Gentile Matas1 Camila Maia Rabelo1 Fernanda Cristina Leite Magliaro1 Natália Paião Luiz1 Lidiane Dias Silva1
1 Faculdade de Medicina da Universidade de São Paulo (FMUSP), Departamento de Fisioterapia,
Fonoaudiologia e Terapia Ocupacional, Curso de Fonoaudiologia. São Paulo, SP, Brasil.
Correspondence
Alessandra Giannella Samelli E-mail:[email protected]
Abstract
Introduction: Presbycusis can affect different portions of the auditory system, causing impacts of varying degrees of seriousness on the daily routine of elderly persons. It is essential that the extent of the deficit as well as the degree of handicap is evaluated, so that the hearing of the elderly can be effectively rehabilitated, improving their quality of life. Purpose: To characterize the peripheral and central hearing of elderly individuals and assess their auditory handicaps. Methods: A cross sectional observational study was performed. We evaluated 83 elderly persons (60-85 years; 33 men, 50 women) with normal hearing or sensorineural hearing loss. Individuals were divided into 3 groups according to the 3 to 6kHz hearing thresholds: G1 – mean of 0 to 39 dBHL (80 ears); G2 – mean of 40 to 59 dBHL (48 ears); G3 – mean of 60 to 120dBHL (38 ears). All individuals responded to the Hearing Handicap Inventory for the Elderly (HHIE), and underwent Pure Tone Audiometry, Auditory Brainstem Response (ABR) and Long Latency Response (P300) evaluation. Results: Men had higher auditory thresholds at frequencies from 500 to 12,000Hz (with a statistical difference between 2-8 kHz) and also significantly greater latencies for ABR components. There was no difference between genders for the P300 evaluation. Comparison between groups showed: a statistically significant difference for age; greater ABR wave latencies and interwave intervals; that questionnaire scores worsened as hearing threshold declined; and similar P300 latencies.
Conclusions: Elderly people have impairment throughout the auditory pathway (peripheral and central). The P300 was less accurate at identifying the losses that come with age. The HHIE demonstrated negative effects on the social life of elderly people, agreeing with the hearing thresholds found.
INTRODUCTION
The elderly population is currently undergoing a period of growth. Demographic projections for the coming years indicate that aging will intensify and will be accompanied by an increase in chronic diseases and presbycusis.1-3
Presbycusis is age-related hearing loss, and affects approximately 30% of the population aged over 65. Its etiology may be related to extrinsic and intrinsic factors, including exposure to noise, ototoxic agents, drug treatments, blood pressure, and smoking.4-6
It is known that aging may affect the peripheral and/or central portions of the auditory system. The peripheral component of presbycusis mainly relates to changes in the outer and inner hair cells, as well as degeneration of the stria vascularis. These changes can result in hearing loss, especially at high frequencies, with impaired speech recognition.7-9
In terms of the core component, meanwhile, changes in the temporal processing of complex acoustic stimuli have been described. This alteration may be related to the reduction of inhibitory neurotransmitters, which permeate the temporal processing of rapid complex acoustic stimuli.8,9
Hearing loss can limit or prevent the individual from fulfilling his or her social role, resulting in negative emotional and professional effects. Due to sensory deprivation, the individual becomes unable to communicate properly with others, causing frustration and leading to a deterioration in quality of life.10-12 The psychological and social
damage (participation restrictions) arising from hearing loss is described as a handicap.13,14
The evaluation of the impact of hearing loss on emotional and social aspects can be accomplished through the application of self-assessment questionnaires. These instruments can be used to quantify the subjective and qualitative dimensions of hearing loss. Such questionnaires can therefore provide a better understanding of the impact of
hearing loss on the elderly, and the needs of this population.6,12,15
As presbycusis can affect the auditory system as a whole (peripheral and/or central portion) in different ways and as the subsequent hearing loss can impact various aspects of the life of elderly persons to a greater or lesser extent,7 it is
essential that the extent of the hearing deficit and the degree of handicap are evaluated quantitative and qualitatively, so that the hearing rehabilitation of the elderly individual can occur in a specific and effective manner, aimed at improving quality of life.
Thus, taking into account the impact of hearing loss on the quality of life of the elderly, the need to understand how presbycusis affects the auditory system, and the fact that a review of literature did not identify studies simultaneously evaluating the overall auditory pathways of the elderly, the present study aimed to characterize the peripheral and central hearing of the elderly, as well as evaluating auditory handicap.
METHOD
The participants were 83 elderly people (33 men and 50 women) with normal hearing and sensorineural hearing loss, aged between 60 and 85 years, living in the Butantã region of São Paulo. Subjects were contacted by publicizing the study on the university campus, resulting in a convenience type sample. Data collection took place between April 2009 and April 2011, and was carried out by two researchers who performed all the evaluations together at the Centro de Docência e Pesquisa em Fisioterapia, Fonoaudiologia e Terapia Ocupacional of the Faculdade de Medicina of the Universidade de São Paulo (the Center for Research and Teaching in Physical, Speech and Occupational Therapy of the School of Medicine of the University of São Paulo). The evaluations were carried out on the same day, and lasted around 90 minutes.
Weinstein16 in 1983 and translated and adapted
for Brazilian Portuguese by Rosis et al in 2009, was applied.15 The questionnaire consists of 10
questions that assess the perception of the negative effects of hearing loss on the social and emotional life of the elderly. The results are quantified through the allocation of points, ranging from 0 to 4, and the answers to each question can be "yes" (4 points), "sometimes" (2 points) or "no" (0 Score). The degree of handicap is established from the total questionnaire score: 0-9 (no perception of handicap), 10-24 (mild/moderate perception) and above 24 (significant perception).
Otoscopy was then carried out, together with tympanometry and the evaluation of acoustic reflex with AT235h equipment (Interacoustics), to rule out the existence of harm to the middle ear, which was an exclusion criterion.
For the audiological evaluation, thresholds of hearing were evaluated with a GSI 61 audiometer, at the 250-12000 Hz frequency for air conduction and also at 500 to 4000 Hz for bone conduction, when the air thresholds exceeded 20 dB HL.
Following these evaluations, the long and short latency Auditory Evoked Potentials were recorded using the Travel Express System from Biologic.
To record brainstem auditory evoked potential (BAEP), the rarefied polarity click acoustic stimulus was used, presented monaurally at 80 dBnHL, at a 19.1 stimuli per second display speed and a duration of 0.1 millisecond. A total of 2,000 stimuli were employed. The electrodes were placed on the forehead (Fz) and the right and left mastoid (A2 and A1). Two registers were recorded for each side, so verifying the reproduction of the tracings and confirming response. The absolute latencies of the I, III and V waves, and the I-III, III-V and I-V interpeaks were evaluated.
Evaluation of Long Latency Brainstem Auditory Potential (P300), used the "tone-burst" stimulus presented monaurally at 75 dBnHL at a 1.1 stimuli per second display speed, employing a total of 300 stimuli. The electrodes were placed on the vertex
(Cz), the right and left mastoids (A2 and A1) and the forehead (Fpz). The frequent stimulus was presented at 1000 Hz and the rare stimulus at 1500 Hz, as of the 300 stimuli presented, 15% referred to the rare stimulus, and the rest to the frequent stimulus (85%). A 512 ms analysis window, gain of 15,000, low-pass filters of 30 Hz and a high pass filter of 1 Hz were used. The patient was advised to mentally count the rare stimuli presented. Wave latency of P300 was analyzed.
The positioning of the electrodes in both tests followed the IES 10-20 guidelines (International Electrode System).
For some comparisons, in order to verify whether there was interference of the auditory thresholds in the other evaluations (electrophysiological and HHIE), the 83 individuals were divided based on the average thresholds of hearing for the frequencies of 3 to 6 kHz per ear. The groups were divided as follows: G1 – mean 0-39 dB HL (80 ears); G2 - mean 40-59 dB HL (48 ears); G3 - mean of 60 to 120 dB HL (38 ears).
For the purposes of statistical analysis, ages were first compared between the genders were compared. Subsequently, the thresholds of hearing and latencies of the AEP components were compared first by gender, and later between the groups. The HHIE score was also compared between groups. For this, the non-paired ANOVA parametric test and the Tukey test were used, with a significance level of 5%.
The present study was approved by the Research Ethics Commission of the institution, under number 1024/09. All the participants signed a Free and Informed Consent Form.
RESULT
Initially, the right and left ears were compared with respect to thresholds of hearing and the components of auditory evoked potentials (AEP). None of the comparisons found statistically significant difference between the ears. For this reason, the ears were grouped together for the next comparison.
Gender
The thresholds of hearing and latencies of the AEP components were compared between genders. The descriptive statistics and p values are shown in Tables 1 and 2.
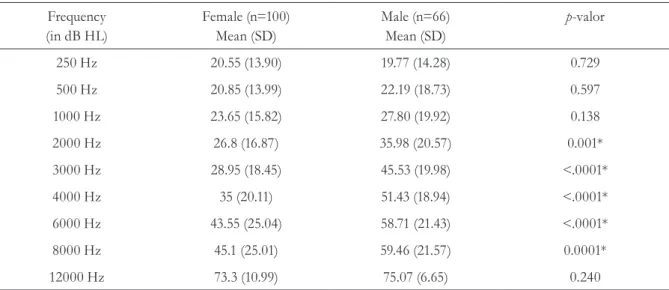
Table 1. Mean values of thresholds of hearing by frequency (in dB HL) between genders. São Paulo, state of São Paulo, 2015.
Frequency (in dB HL)
Female (n=100) Mean (SD)
Male (n=66) Mean (SD)
p-valor
250 Hz 20.55 (13.90) 19.77 (14.28) 0.729
500 Hz 20.85 (13.99) 22.19 (18.73) 0.597
1000 Hz 23.65 (15.82) 27.80 (19.92) 0.138
2000 Hz 26.8 (16.87) 35.98 (20.57) 0.001*
3000 Hz 28.95 (18.45) 45.53 (19.98) <.0001*
4000 Hz 35 (20.11) 51.43 (18.94) <.0001*
6000 Hz 43.55 (25.04) 58.71 (21.43) <.0001*
8000 Hz 45.1 (25.01) 59.46 (21.57) 0.0001*
12000 Hz 73.3 (10.99) 75.07 (6.65) 0.240
dB HL: decibel level hearing level; SD: standard deviation; *value of p≤0.05; n: total number of ears. ANOVA test.
Table 2. Mean latency values of components of ABR (in ms) between genders. São Paulo, state of São Paulo, 2015.
Latencies (in ms)
Female (n=100) Mean (SD)
Male (n=66) Mean (SD)
p-valor
Wave I 1.80 (0.32) 1.95 (0.39) 0.005*
Wave III 3.90 (0.32) 4.07 (0.37) 0.001*
Wave V 5.78 (0.32) 5.96 (0.42) 0.001*
I-III 2.26 (0.32) 2.42 (0.37) 0.002*
III-V 1.90 (0.21) 1.94 (0.34) 0.404
I-V 4.36 (0.89) 4.71 (1.09) 0.026*
P300 351.25 (40.52) 347.71 (42.42) 0.590
In terms of thresholds of hearing, it was noted that men exhibited lower thresholds for frequencies from 500 to 12,000 Hz than females, with a statistically significant difference from 2 to 8 kHz (Table 1). With respect to ABR, men exhibited greater latencies than women for all components, with statistically significant differences for all components except for the III-V range. In terms of P300, there was no statistically significant difference between the genders (Table 2).
Comparison between groups
(ears divided based on means of 3 to 6 kHz)
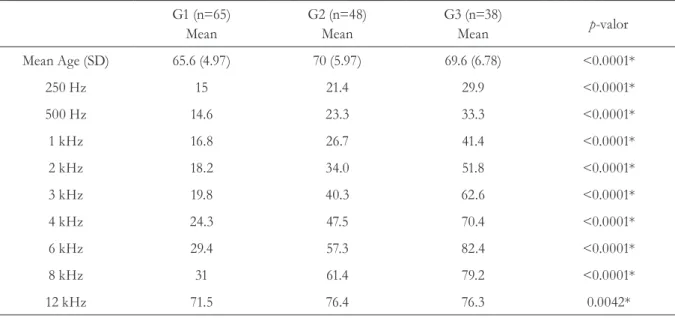
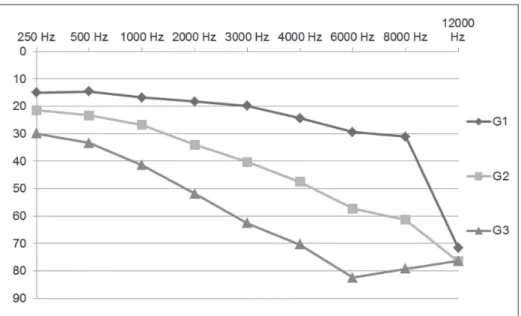
Table 3 and Figure 1 illustrate the thresholds of hearing by frequency for the ears divided within the groups. Obviously, it can be seen that the groups differ significantly in terms of mean thresholds of hearing, as the division by groups was based on exactly this criterion. It is worth noting that although
the division was made based on the frequencies of 3 to 6 kHz there were also differences at lower frequencies. It can also be observed that these groups showed a statistically significant difference with respect to age, with G1 the youngest group, although G2 did not differ from G3.
Based on the division by groups, the latency of the AEP components was compared (Table 4).
In terms of ABR, there was no absence of a response to any of the potential components. Table 4 shows that as the hearing threshold declined (according to the division by groups), the more the latencies of waves and interpeak intervals increased. The statistically significant differences between the three groups and within the groups after pairwise comparison are shown in Table 4. With respect to P300, statistically significant differences were observed between the groups G1, G2 and G3 (Table 4).
Table 3. Mean threshold of hearing values by frequency (in dB HL), comparing groups G1, G2 and G3. São Paulo, state of São Paulo, 2015.
G1 (n=65) Mean
G2 (n=48) Mean
G3 (n=38)
Mean p-valor
Mean Age (SD) 65.6 (4.97) 70 (5.97) 69.6 (6.78) <0.0001*
250 Hz 15 21.4 29.9 <0.0001*
500 Hz 14.6 23.3 33.3 <0.0001*
1 kHz 16.8 26.7 41.4 <0.0001*
2 kHz 18.2 34.0 51.8 <0.0001*
3 kHz 19.8 40.3 62.6 <0.0001*
4 kHz 24.3 47.5 70.4 <0.0001*
6 kHz 29.4 57.3 82.4 <0.0001*
8 kHz 31 61.4 79.2 <0.0001*
12 kHz 71.5 76.4 76.3 0.0042*
db HL: decibel Hearing Level; SD: standard deviation; Hz: Hertz; KHz: kilohertz; * value of p≤0.05; n: total number of ears. ANOVA test.
Figure 1. Mean thresholds of hearing by frequency (in db HL) for groups G1, G2 and G3. São Paulo, state of São Paulo, 2015.
Table 4. Mean latency values for ABR components (in ms), comparing groups G1, G2 and G3. São Paulo, state of São Paulo, 2015.
Latencies (in ms)
G1 (n=65) Mean
(SD)
G2 (n=48) Mean
(SD)
G3 (n=38)
Mean (SD) p-value
(Anova)
Pairwise comparison (Tukey)
Wave I 1.77 (0.28) 1.86 (0.34) 2.06 (0.43) <0.0001* G1 X G2 – n.s.
G1 X G3 - p<0.01* G2 X G3 - p<0.05*
Wave III 3.83 (0.02) 4.01 (0.12) 4.21 (0.24) <0.0001* G1 X G2 – p<0.05* G1 X G3 - p<0.01* G2 X G3 - p<0.01*
Wave V 5.70 (0.21) 5.91 (0.38) 6.08 (0.50) <0.0001* G1 X G2 – p<0.05* G1 X G3 - p<0.01*
G2 X G3 – n.s.
I-III 2.22 (0.30) 2.33 (0.32) 2.52 (0.40) <0.0001* G1 X G2 – n.s.
G1 X G3 - p<0.01* G2 X G3 - p<0.05*
III-V 1.87 (0.21) 1.95 (0.28) 1.97 (0.34) 0.114
-I-V 4.21 (0.74) 4.52 (0.93) 5.08 (1.24) <0.0001* G1 X G2 – n.s.
G1 X G3 - p<0.01* G2 X G3 - p<0.01*
P300 351.31 (39.52) 347.35 (44.50) 349.89 (41.27) 0.869
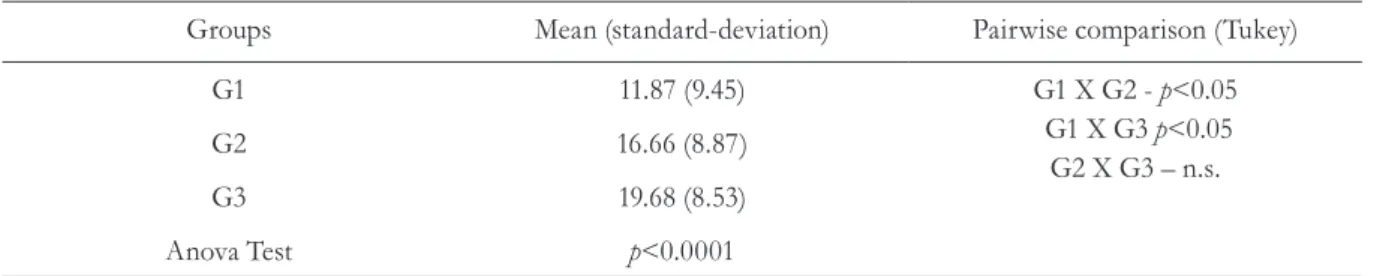
Handicap – HHIE score
Table 5 shows a statistically significant difference between the groups in terms of HHIE scores, which
diminished in accordance with the reduction in thresholds of hearing (in accordance with division by groups). It was also observed that the scores for G2 and G3 were not statistically significant different.
Table 5. Mean point score according to HHIE questionnaire, comparing groups G1, G2 and G3. São Paulo, state of São Paulo, 2015.
Groups Mean (standard-deviation) Pairwise comparison (Tukey)
G1 11.87 (9.45) G1 X G2 - p<0.05
G1 X G3 p<0.05 G2 X G3 – n.s.
G2 16.66 (8.87)
G3 19.68 (8.53)
Anova Test p<0.0001
SD: standard deviation; ms: millisecond; * value of p≤0.05; n: total number of ears, n.s: not significant.
DISCUSSION
It was observed that men had lower thresholds of hearing at frequencies from 500 to 12,000 Hz than women, with a statistically significant difference from 2 to 8 kHz. These findings agree with previous studies,11,17,20 which reported lower
thresholds of hearing, especially at high frequencies, for men. Factors such as high blood pressure, smoking and exposure to noise contributes to the worsening of hearing with age.18
Similarly, just as males had lower thresholds of hearing in pure tone audiometry than women, in terms of ABR, men had greater latencies than women for all components, with a statistically significant difference for all components except for the III-V range.
It is known that the prolongation of ABR wave latencies can be caused by sensorineural hearing loss. Literature shows that in cochlear hearing
loss, for thresholds higher than 50 dB HL at high frequencies, an increase of 0.1 to 0.2 ms in the latency of the V wave is expected for every 10 dB of hearing loss.21 As the stimulus used in this study
was the click (frequency range between 3 and 6 kHz) and as the elderly participants had increased thresholds of hearing in this frequency range, the increase in latency of the ABR components was expected, as well as the difference between the sexes, because of the difference in thresholds of hearing observed in audiometry.
It is noteworthy that the P300 averages found for both genders are within the expected range for this age range.23 Moreover, a difference between
the genders is not expected for P300.22
When the groups were divided according to the mean thresholds of hearing for the frequencies from 3 to 6 kHz per ear, they were found to differ significantly. This finding was expected, aa the division of the groups used exactly this criterion, or in other words, the thresholds of hearing.
It was also observed that the groups exhibited a statistically significant difference with respect to age, with G1 being the youngest group, although G2 did not differ from G3. This suggests that, as the ages of G2 and G3 were similar, it was not this variable that determined the difference between thresholds of hearing for these two groups. Possibly other intrinsic and extrinsic variables, including exposure to noise, ototoxic agents, drug treatments, blood pressure, smoking, among others4-6 may have
influenced the determination of higher thresholds of hearing for G3.
In terms of ABR, it was observed that as hearing threshold declined (according to the division by groups), so the wave latencies and interpeaks intervals increased, with statistically significant differences for most comparisons. Taking into consideration the similar ages of G2 and G3, and the fact that even with similar ages the two groups showed significant differences in the ABR components, it can be suggested that the factor that determined this difference was in fact a higher auditory threshold in G3. Thus, it should be considered that age can have an influence on the wave latencies of ABR, but that the degree of hearing loss seems to have a larger impact on this characteristic.22
Similar results were found by Boettcher,24
in a study of elderly persons with presbycusis, which observed increased absolute latencies for all ABR waves. Ulf et al.,25 in a study of subjects
from different age groups, also found an increase in absolute latencies of all ABR waves with
increasing age.
With respect to P300, statistically significant differences were observed between the groups G1, G2 and G3. This finding shows that the differences in thresholds of hearing between the three groups did not influence P300 latency because, as it is likely that the stimuli used in the assessment can be heard and discriminated,22 the degree of hearing
loss does not interfere as much with P300 latency as with ABR.
Regarding age and P300 latency, as G1 was younger than G2 and G3, it can be considered that this variable was not decisive. The average latencies obtained in this study are close to those obtained by McPherson23 among individuals aged
50-70 years (350-470 ms), which coincides with the average age of the three groups studied. Goodin26
found, for an age group between 6 and 76 years, an increase of 1.8 ms per year in the latency of the P300 wave. A study by Syndulko27 found a
lower P300 wave latency for individuals younger than 45 years (mean of 330 ms) and an increase in this value for individuals older than this age (mean of 368 ms).
According to Verleger,28 the increase in P300
latency may be related to a delay in information processing that can occur in elderly individuals, due to the decrease of cognitive functions observed in this age group.
In addition, it is worth mentioning that the P300 is a potential component with great inter-subject and lesser intra-subject latency variability. This may also have contributed to the great variability in the present study and the absence of a significant difference between groups.
this difference was not significant. It is important to note that the mean points obtained for the three groups fell within the classification of "mild to moderate handicap", indicating that despite the difference in thresholds of hearing between groups, most individuals exhibited handicap arising from hearing loss.
This data indicates that there is some agreement among most of the thresholds of hearing found (normal hearing and mild to moderate hearing loss) and the handicap (without handicap or mild to moderate handicap) presented in greater numbers in this population. These findings were also found in the study by Calviti and Pereira.29
It should be mentioned that 56.6% of 83 elderly subjects had some degree of handicap (according to HHIE), or in other words, had scores above 10, while 68.7% of 83 elderly subjects had some degree of hearing loss. For most of the elderly persons studied in this survey, we suggest that any degree of hearing loss generates some kind of negative social or emotional effect, detected through the HHIE.
As such the importance of using tools such as self-assessment questionnaires in clinical practice, as a form of initial screening to identify elderly persons who require a more complete audiological evaluation, including, in addition to the evaluation of the peripheral auditory pathway, the investigation of how acoustic stimulation is transmitted and
processed along the central auditory pathway, should be stressed.
It should be noted that the present study has some limitations, especially with regard to the sample size. Being a relatively lengthy assessment, some individuals were not interested in participating. With a larger number of participants, the differences observed may be more robust. Nevertheless, the study results have clinical and scientific importance, as they describe the operation of the peripheral and central auditory pathways of the elderly, and correlate possible changes in the auditory system with the restrictions to daily life experienced by this population.
CONCLUSION
It can be concluded that the elderly persons exhibited damage to the auditory pathway as a whole (peripheral and central). The P300 was less sensitive to the changes arising from age. The HHIE questionnaire identified negative effects on the social life of the elderly, displaying agreement with the thresholds of hearing assessed. From these findings, the importance of using tools such as self-assessment questionnaires in clinical practice for screening purposes as well as a complete audiological evaluation (peripheral and central auditory pathways) in this population, can be seen.
REFERENCES
1. Gomes I, Nogueira EL, Engroff P, Ely LS, Schwanke CHA, De Carli GA,. The multidimensional study of the elderly in the family health strategy in Porto Alegre, Brazil (EMI-SUS). PAJAR- Pan Am J Aging Res 2013;1(1):20-4.
2. Veras R. Garantir a saúde e o bem-estar dos idosos: desafios de hoje e amanhã. Rev Bras Geriatr Gerontol 2015;18(3):473-4.
3. Veras RP. Experiências e tendências internacionais de modelos de cuidado para com o idoso. Ciênc Saúde Coletiva 2012;17(1):231-8.
5. Cruz MS, Lima MCP, Santos JLF, Duarte YAO, Lebrão ML, Ramos-Cerqueira ATA. Deficiência auditiva referida por idosos no Município de São Paulo, Brasil: prevalência e fatores associados (Estudo SABE, 2006). Cad Saúde Pública 2012;28(8):1479-92.
6. Roth TN, Hanebuth D, Probst R. Prevalence of age-related hearing loss in Europe: a review. Eur Arch Oto-Rhino-Laryngol 2011;268(8):1101-7.
7. Howarth A, Shone JR. Ageing and the auditory system. Postgrad Med J 2006;82:166-71.
8. Caspary DM. Inhibitory neurotransmission, plasticity and aging in the mammalian central auditory system. J Exp Biol 2008;211(Pt 11):1781-91.
9. Burianova J, Ouda L, Profant O, Syka J. Age-related changes in GAD levels in the central auditory system of the rat. Exp Gerontol 2009;44(3):161-9.
10. Ruschel CV, Carvalho CR, Guarinello AC. A eficiência de um programa de reabilitação audiológica em idosos com presbiacusia e seus familiares. Braz J Otorhinolaryngol 2007;12:95-8.
11. Cruz MS, Lima MCP, Santos JLF, Duarte YAO, Lebrão ML, Ramos-Cerqueira ATA. Uso de aparelho de amplificação sonora individual por idosos: estudo SABE - saúde, bem- estar e envelhecimento. Audiol, Commun Res 2013;18(2):133-42.
12. Mesquita LG, Pereira LD. Processamento temporal em idosos: o efeito da habilidade de resolução temporal em tarefas de ordenação de série de sons. Rev CEFAC 2013;15(5):1163-9.
13. Guarinello AC, Marcelos SB, Ribas A, Marques JM. Análise da percepção de um grupo de idosos a respeito de seu handicap auditivo antes e após o uso do aparelho auditivo. Rev Bras Geriatr Gerontol 2013;16(4):739-45.
14. Magalhães R, Iório MCM. Avaliação da restrição de participação, em idosos, antes e após a intervenção fonoaudiológica. Rev CEFAC 2012;14(5):816-25.
15. Rosis ACA, Souza MRF, Iório MCM. Questionário Hearing Handicap Inventory for the Elderly – Screening version (HHIE-S): estudo da sensibilidade e especificidade. Braz J Otorhinolaryngol 2009;14:39-45.
16. Ventry IM, Weinstein BE. Identification of elderly people with hearing problems. ASHA. 1983;25(7):37-42.
17. Kiely KM, Gopinath B, Mitchell P, Luszcz M, Anstey KJ. Cognitive, health, and sociodemographic predictors of longitudinal decline in hearing acuity among older adults. J Gerontol Ser A Biol Sci Med Sci 2012;67(9):997-1003.
18. Kaya KH, Karaman KA, Sayın I, Güneş S, Canpolat
S, Şimşek B, et al. Etiological classification of presbycusis in Turkish population according to audiogram configuration. Kulak Burun Bogaz Ihtisas Derg 2015;25(1):1-8.
19. Baraky LR, Bento RF, Raposo NR, Tibiriçá SH, Ribeiro LC, Barone MM, et al. Disabling hearing loss prevalence in Juiz de Fora, Brazil. Braz J Otorhinolaryngol 2012; 78(4):52-8.
20. Samelli AG, Andrade CQ, Pereira MB, Matas CG. Hearing complaints and the audiological profile of the users of an academic health center in the western region of São Paulo. Int Arch Otorhinolaryngol 2013;17(2):125-30.
21. Selters WA, Brackmann DE. Acoustic tumor detection with brainstem electric response audiometry. Arch Otolaryngol 1977;103(4):181-7.
22. Hall III JW. New Handbook of auditory evoked responses. Boston: Pearson Education; 2007.
23. McPherson DL. Late potentials of the auditory system (evoked potentials). San Diego: Singular Press; 1996.
24. Boettcher FA. Presbiacusis and auditory brainstem response. J Speech Lang Hear Res 2002;45:1249-61.
26. Goodin DS, Squire KC, Henderson BH, Starr A. Age-related variation in evoked potentials to auditory stimuli in normal human subjects. Eletroencephalograph Clin Neurophysiol 1978;44(4):447-58.
27. Syndulko K, Hansch EC, Cohen SC, Pearce JW, Goldberg Z, Montan B, et al. Long-latency event-related potentials in normal aging and dementia. In: Courian J, Mauguiere F, Revol M, editors. Clinical applications of evoked potentials in neurology. New York: Raven Press; 1982. p.279-85.
28. Verleger R, Neukäter W, Kömpf D, Vieregge P. On the reasons for the delay of P3 latency in healthy elderly subjects. Eletroencephalogr Clin Neurophysiol 1991;79(6):488-502.
29. Calviti KCFK, Pereira LD. Sensibilidade,
especificidade e valores preditivos da queixa auditiva comparados com diferentes médias audiométricas. Braz J Otorhinolaryngol 2009;75(6):794-800.