O
ri
gi
na
l
a
rt
ic
le
s
Taste sensitivity of adults and elderly persons
Luisa Neumann1
Bianca Coletti Schauren1
Fernanda Scherer Adami1
1 Centro Universitário Univates, Centro de Ciências Biológicas e da Saúde, Curso de Nutrição. Lajeado,
RS, Brasil.
Correspondence Fernanda Scherer Adami
E-mail: [email protected]
Abstract
Objective:To compare the taste sensitivity of adults and elderly people, considering nutritional status, smoking and alcohol consumption. Method: Forty-six volunteers participated in the research, thirteen of whom were adult employees of a company from the food industry and thirty-three of whom were elderly residents of three Long-Term Care Facilities for the Elderly from the Vale do Taquari (Taquari Valley). They responded to a structured questionnaire about their socioeconomic data and use of medication, smoking and alcohol consumption, and underwent a nutritional evaluation and a taste sensitivity test. The taste sensitivity test was applied at three different concentrations for every flavor, with 4 drops dripped on the tongue of the volunteer, who described the level of perceived palatability, giving a score of 0-5. Data was analyzed through statistical analysis using the Statistical Package SPSS 20.0, considering a value of significance of p<0.05. Result: a reduction in the taste sensitivity of the elderly persons was noted for the sweet and sour solutions, in comparison with adults, as the majority of the elderly people demonstrated lower sensitivity scale scores for the citric acid solution in concentration 1 (p=0.004) and concentration 2 (p=0.049) and sucrose in concentration 3 (p=0.026). Conclusion: Elderly people had a lower perception of the sweet and sour flavors than adults. Moreover, nutritional status, gender, alcohol consumption, smoking and medication use were not significantly associated with the taste perception of the individuals evaluated.
INTRODUCTION
According to the 2010 Demographic Census,1
the Brazilian population aged 40-59 years was 43,259,335, and 12.1% of Brazilians were aged below 60.2 According to projections for 2050, the
elderly portion of Brazilian society will reach 38 million, exceeding the young population.3
Aging can be biologically considered to be a morphofunctional involution, variably affecting major physiological systems.4 Biofunctional
changes begin in the second decade of life, albeit imperceptibly. At the end of the third decade functional and structural changes occur and after 40 years of age there is a loss of about 1% of function per year in different bodily systems.5 From
the age of 40 onwards functional decline ranges from 10 to 30% in relation to young adulthood.6
The physiology of the elderly changes on structural, functional and molecular levels, in addition to the physiological alterations that the organs suffer over the years.7 Different age groups
have different taste perceptions; for example, the level of flavor perceived by children differs from adults, and may also differ between groups of people.8 To have the same perception of taste,
individuals aged over 80 require a more intense taste stimulus than people aged 20.9
Even though aging is a natural process, there are limitations on the selection and intake of food due to reduced physical capacity. The reduction of masticatory function may also result in malnutrition and an unbalanced diet.10 During the process of
senescence a decline in the perception of smell and taste is common. The reduction of these senses can cause a loss of appetite, food monotony, decreased dietary intake and malnutrition.11 Simchen et al.
found that taste perception is reduced in individuals older than 65 years.12 Mojet, Heidema and Christ
showed that the taste perception of the five basic flavors in young people aged 19-33 years was more preserved than among those aged 60 to 75 years.13
The perception of taste occurs through the taste buds which form part of the gustatory system and
are primary receivers, hosting a heterogeneous collection of taste receptor cells, which translate the five basic tastes (sweet, bitter, salty, sour and umami) into electrochemical signals transmitted via sensory neurons to the brain.14
Taste is attributed to the non-volatile compounds present in foods such as sugars, salts, acids and limonin, which determine the basic flavors such as sweet, salty, bitter and acidic.15 Individuals with
decreased taste sensitivity present difficulties in enjoying the taste of food, which can in some cases result in a reduction of diet and an underweight condition.16
Population aging presents political, social and economic challenges, as Brazil currently has a lower rate of population growth and is undergoing a significant increase in its elderly population. In this context, the purpose of this study was to compare the taste sensitivity of adults with that of elderly persons and relate gustatory levels to nutritional status, smoking and alcohol consumption.
METHOD
taste sensitivity scale, as well as those who were not physically able to undergo nutritional assessment.
The participants responded to a structured quest ionnaire set by t he researcher on socioeconomic data and use of medication, smoking and alcohol consumption, as well as a nutritional assessment and a taste sensitivity test between the months of July and August 2015.
The application of the structured questionnaire was conducted in interview form in a private room in the company or LTCF to which the participant was attached, ensuring privacy and the confidentiality of the data collected.
For the anthropometric measurements weight, height and waist circumference were measured. Body weight was measured by properly calibrated Plenna® brand scales with a capacity of 150 kg, with the individual in an orthostatic position and wearing light clothing. To estimate the weight of elderly persons who were unable to remain in an upright position, the Chumlea et al. formula was used, based on arm circumference (AC) and knee height (KH). The AC was measured at the midpoint between the acromion and the humerus-radial joint of the arm, with the muscles relaxed.17
KH was measured with the volunteer sitting with his or her feet flat on the floor at 90 degrees. The length between the heel and the anterior surface of the leg (fibular head) was measured.
Height was measured using an Avanutri® brand 20-210 cm portable stadiometer, with the
individual barefoot and positioned facing the evaluator with weight distributed on both feet, the head in the Frankfurt plane position, and the heels, calves, buttocks, back and back of the head against the wall. To estimate the height of elderly people unable to remain upright, the Chumlea, Roche and Steinbaugh formula was used, which takes into consideration age and knee height, measured as described above.18 For the classification of body
mass index (BMI) the World Health Organization (WHO 1998) classification for individuals aged 40-59 years19 and the Pan American Health
Organization (PAHO) classification for the elderly were used.20
For the measurement of waist circumference (WC) the volunteer remained standing and was measured at the midpoint between the iliac crest and the lower costal margin.21 A FisioStore®
inelastic tape measure with a precision of 1 mm was used. Waist circumference was classified according to the WHO for all subjects, according to gender.21
Waist/height was classified using the 0.5 cut-off point as a reference, with a single cut-off applied to the general population, regardless of gender, age and ethnicity.22
The weighing for the preparation of the solutions was performed using an ACS model LC-C1 digital scale. Verification of the pH of solutions with citric acid was carried out using a Digimed® DM-20 brand pH-meter in the Univates Chemical Laboratory.
Before beginning the taste sensitivity test, adapted from Mueller et al.,23 the individual was
advised to drink a small quantity of water. Then, four drops of each solution were dripped onto the center of the tongue of the volunteer, who within one minute described the degree of taste sensitivity perceived, allocating a score of 0 to 5 on the taste sensitivity scale.
The options for classification were: 0- no flavor; 1- very weak flavor; 2- weak flavor; 3- moderate flavor; 4- strong flavor; 5- very strong flavor. For statistical analysis, the answers to the taste test were grouped into the categories 0, 1 and 2, considered as no, very low, or low taste sensitivity and the categories 3, 4 and 5, considered as moderate, high or very high taste sensitivity.
Firstly, the three concentrations of the solution containing sucrose (sweet) were tested, followed by the solutions with sodium chloride (salty), citric acid (sour) and caffeine (bitter). A glass of water was provided between each sample tested, as well as a recipient for the volunteer to expel the solutions, if so desired. The procedure was the same for all flavors and concentrations, with an interval of 1 to 3 minutes between each sample tested.
The results were analyzed through average descriptive statistics and standard deviation for the quantitative variables and absolute and relative frequency for the qualitative variables. The comparison between the degrees of palatability of different concentrations of the test solutions was performed using the chi-squared test, which was also used to evaluate the association between degree of palatability and sample characteristics such as gender, age, smoking, alcohol consumption, frequent consumption of the tested substances and nutritional status. Statistical analysis was performed with the SPSS 20.0 statistical package, with values
p<0.05 being considered significant.
Chart 1. Concentration of aqueous solutions of sucrose, sodium chloride, citric acid and caffeine, Vale do Taquari, Rio Grande do Sul, 2015.
FLAVOR CONCENTRATION 1 CONCENTRATION 2 CONCENTRATION 3
Sugar Solution 1
(1g of sugar/ 100ml)
Solution 2 (2g sugar /100ml)
Solution 3 (4g sugar /100ml)
Concentration of sucrose 1g of sucrose 2 g of sucrose 4g of sucrose
Salt Solution 1 (1g of salt/ 100ml) Solution 2 (2g salt/100ml) Solution 3 (4g salt/100ml)
Concentration of sodium 0.39g of Na 0.78g of Na 1.57g of Na
Lemon Solution 1
(1ml of lemon/ 100ml)
Solution 2
(2ml of lemon/100ml)
Solution 3 (4ml lemon/100ml)
Concentration of citric acid
0.06 ml citric acid 0.12 ml citric acid 0.24 ml citric acid
pH 3.20 3.0 2.90
Coffee Solution 1
(1g of coffee/ 100ml)
Solution 2 (2g coffee /100ml)
Solution 3 (4g coffee/100ml)
Concentration of caffeine 0.05g of caffeine 0.1g of caffeine 0.2g of caffeine
The present study was approved by the Ethics Research Committee of the Centro Universitário da Univates (Univates University Center), under protocol 934.818 registered on 09/01/2015.
RESULT
The mean age of the participants of the present study was 67.33±15.98 years, with the majority being female (n=27; 58.7%), widowed (n=17; 37%), literate (n=40; 87%) and retired (n=32; 69.6%). The majority of the participants (n=33; 71.7%) reported never having smoked and (n=33; 71.7%) never having consumed alcohol. The majority of participants described using some type of medication (n=34; 73.9%), with the most commonly used being antidepressants (n=19; 41.3%) and anti-hypertensives (n=18; 39.1%).
A total of 20 participants (43.5%) were classified as eutrophic, nine volunteers (19.6%) were underweight, eight individuals (17.4%) were overweight and nine (19.6%) were overweight. In terms of anthropometric indicators of cardiovascular risk, the majority of participants, (n=32; 69.6%) exhibited an elevated/extremely elevated cardiovascular risk and (n=14; 30.4%) of the volunteers were classified as not being at cardiovascular risk based on waist circumference and waist/height ratio.
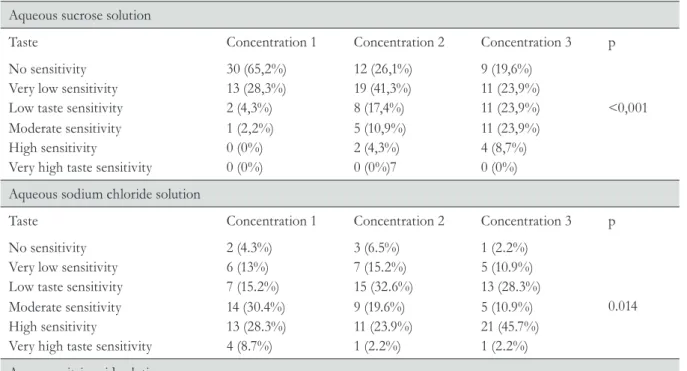
Table 1 shows the characteristics relating to the taste sensitivity test for the solutions studied. Significant differences were observed for the degree of palatability of all the solutions, depending on concentration. The majority of participants described higher levels of palatability for solutions with a greater concentration of substances tested.
Table 1. Association between level of palatability and different concentrations of sucrose, sodium chloride, citric acid and caffeine solutions in adults and elderly persons. Vale do Taquari, Rio Grande do Sul, 2015.
Aqueous sucrose solution
Taste Concentration 1 Concentration 2 Concentration 3 p
No sensitivity Very low sensitivity Low taste sensitivity
30 (65,2%) 13 (28,3%) 2 (4,3%)
12 (26,1%) 19 (41,3%) 8 (17,4%)
9 (19,6%) 11 (23,9%)
11 (23,9%) <0,001
Moderate sensitivity High sensitivity
Very high taste sensitivity
1 (2,2%) 0 (0%) 0 (0%)
5 (10,9%) 2 (4,3%) 0 (0%)7
11 (23,9%) 4 (8,7%) 0 (0%)
Aqueous sodium chloride solution
Taste Concentration 1 Concentration 2 Concentration 3 p
No sensitivity Very low sensitivity Low taste sensitivity
2 (4.3%) 6 (13%) 7 (15.2%)
3 (6.5%) 7 (15.2%) 15 (32.6%)
1 (2.2%) 5 (10.9%) 13 (28.3%)
0.014 Moderate sensitivity
High sensitivity
Very high taste sensitivity
14 (30.4%) 13 (28.3%) 4 (8.7%)
9 (19.6%) 11 (23.9%) 1 (2.2%)
5 (10.9%) 21 (45.7%) 1 (2.2%)
Aqueous citric acid solution
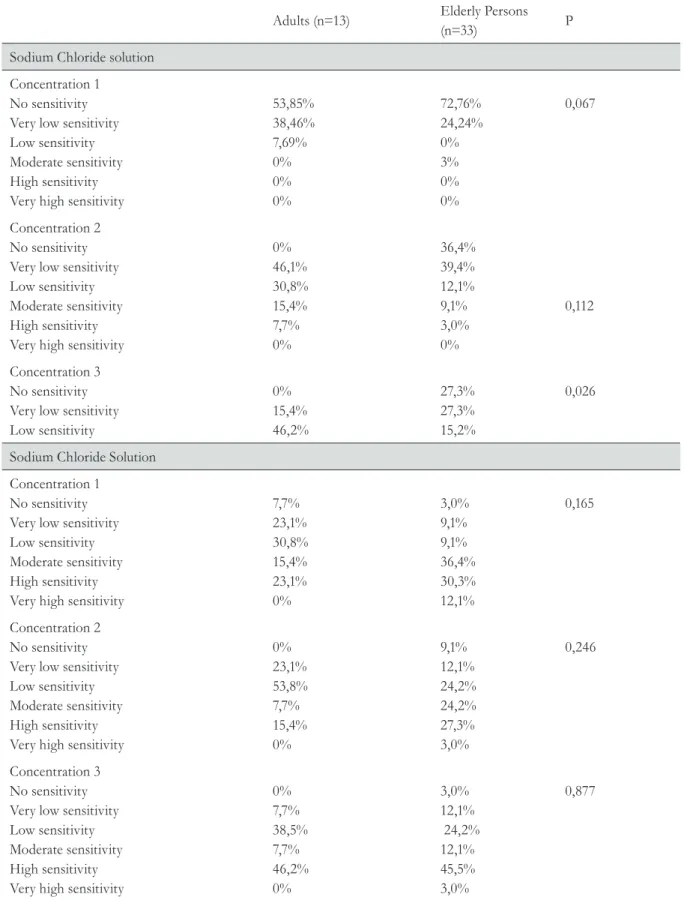
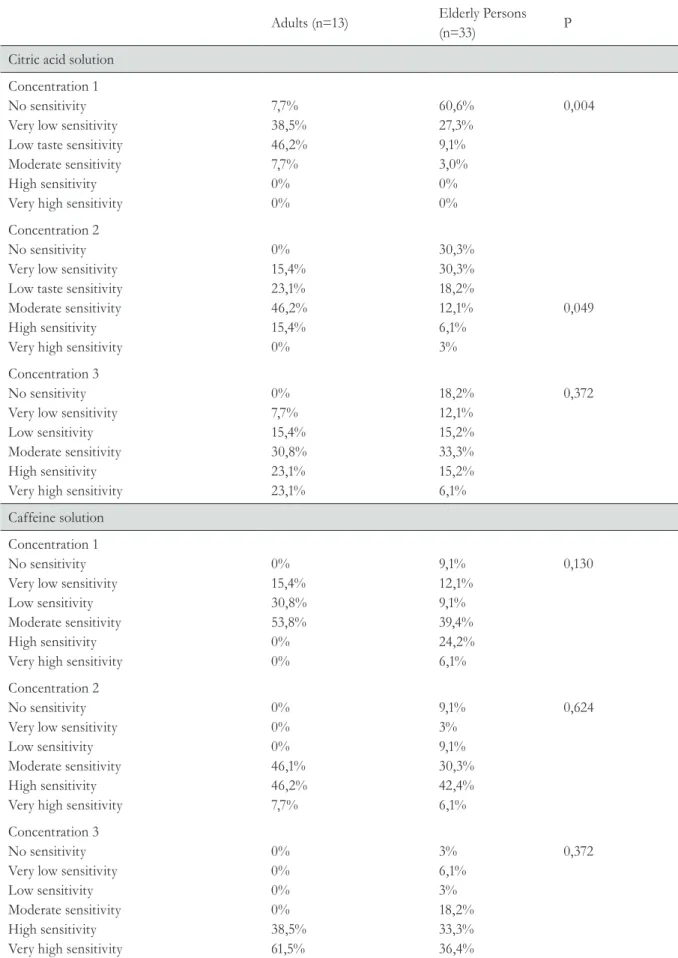
The association between the degree of palatability of the solutions and age, gender, smoking, alcohol consumption and frequency of consumption of the test foods was evaluated. A significant difference was observed in the degree of taste sensitivity between adults and elderly persons for the citric acid solution at concentration 1 (p=0.004) and 2 (p=0.049) and for the sucrose
solution at concentration 3 (p=0.026). A higher proportion of elderly persons than adults exhibited lower sensitivity values for the citric acid and sucrose solutions. The degree of palatability did not differ between adults and elderly persons, regardless of concentration, for the caffeine and sodium chloride solutions, as shown in Table 2 and Table 3.
Taste Concentration 1 Concentration 2 Concentration 3 p
No sensitivity Very low sensitivity Low taste sensitivity
21 (45.7%) 14 (30.4%) 9 (19.6%)
10 (21.7%) 12 (26.1%) 9 (19.6%)
6 (13.0%) 5 (10.9%) 7 (15.2%)
<0.001 Moderate sensitivity
High sensitivity
Very high taste sensitivity
2 (4.3%) 0 (0%) 0 (0%)
10 (21.7%) 4 (8.7%) 1 (2.2%)
15 (32.6%) 8 (17.4%) 5 (10.9%)
Aqueous caffeine solution
Taste Concentration 1 Concentration 2 Concentration 3 p
No sensitivity Very low sensitivity Low taste sensitivity
3 (6.5%) 6(13%) 7 (15.2%)
3 (6.5%) 1 (2.2%) 3 (6.5%)
1 (2.2%) 2 (4.3%)
1 (2.2%) <0.001
Moderate sensitivity High sensitivity
Very high taste sensitivity
20 (43.5%) 8 (17.4%) 2 (4.3%)
16 (34.8%) 20 (43.5%) 3 (6.5%)
6 (13%) 16 (34.8%) 20 (43.5%)
Chi-squared test; Values of p≤0.05 considered statistically significant; Data expressed in absolute and relative frequency.
Table 2. Association between degree of taste sensitivity for solutions of sucrose and sodium chloride at different concentrations and by age range. Vale do Taquari, Rio Grande do Sul, 2015.
Adults (n=13) Elderly Persons
(n=33) P
Sodium Chloride solution
Concentration 1 No sensitivity Very low sensitivity Low sensitivity Moderate sensitivity High sensitivity Very high sensitivity
53,85% 38,46% 7,69%
0% 0% 0%
72,76% 24,24% 0%
3% 0% 0%
0,067
Concentration 2 No sensitivity Very low sensitivity Low sensitivity Moderate sensitivity High sensitivity Very high sensitivity
0% 46,1% 30,8% 15,4% 7,7% 0%
36,4% 39,4% 12,1% 9,1% 3,0% 0%
0,112
Concentration 3 No sensitivity Very low sensitivity Low sensitivity
0% 15,4% 46,2%
27,3% 27,3% 15,2%
0,026
Sodium Chloride Solution
Concentration 1 No sensitivity Very low sensitivity Low sensitivity Moderate sensitivity High sensitivity Very high sensitivity
7,7% 23,1% 30,8% 15,4% 23,1%
0%
3,0% 9,1% 9,1% 36,4% 30,3% 12,1%
0,165
Concentration 2 No sensitivity Very low sensitivity Low sensitivity Moderate sensitivity High sensitivity Very high sensitivity
0%
23,1% 53,8%
7,7%
15,4% 0%
9,1%
12,1%
24,2%
24,2%
27,3%
3,0%
0,246
Concentration 3 No sensitivity Very low sensitivity Low sensitivity Moderate sensitivity High sensitivity Very high sensitivity
0%
7,7% 38,5% 7,7% 46,2% 0%
3,0% 12,1% 24,2% 12,1% 45,5% 3,0%
0,877
Table 3. Association between degree of taste sensitivity for citric acid and caffeine solutions for different concentrations and ages. Vale do Taquari, Rio Grande do Sul, 2015.
Adults (n=13) Elderly Persons
(n=33) P
Citric acid solution
Concentration 1 No sensitivity Very low sensitivity Low taste sensitivity Moderate sensitivity High sensitivity Very high sensitivity
7,7% 38,5% 46,2% 7,7% 0% 0% 60,6% 27,3% 9,1% 3,0% 0% 0% 0,004 Concentration 2 No sensitivity Very low sensitivity Low taste sensitivity Moderate sensitivity High sensitivity Very high sensitivity
0% 15,4% 23,1% 46,2% 15,4% 0% 30,3% 30,3% 18,2% 12,1% 6,1% 3% 0,049 Concentration 3 No sensitivity Very low sensitivity Low sensitivity Moderate sensitivity High sensitivity Very high sensitivity
0% 7,7% 15,4% 30,8% 23,1% 23,1% 18,2% 12,1% 15,2% 33,3% 15,2% 6,1% 0,372 Caffeine solution Concentration 1 No sensitivity Very low sensitivity Low sensitivity Moderate sensitivity High sensitivity Very high sensitivity
0% 15,4% 30,8% 53,8% 0% 0% 9,1% 12,1% 9,1% 39,4% 24,2% 6,1% 0,130 Concentration 2 No sensitivity Very low sensitivity Low sensitivity Moderate sensitivity High sensitivity Very high sensitivity
0% 0% 0% 46,1% 46,2% 7,7% 9,1% 3% 9,1% 30,3% 42,4% 6,1% 0,624 Concentration 3 No sensitivity Very low sensitivity Low sensitivity Moderate sensitivity High sensitivity Very high sensitivity
0% 0% 0% 0% 38,5% 61,5% 3% 6,1% 3% 18,2% 33,3% 36,4% 0,372
When the degree of palatability of men and women was compared, no significant difference was observed, regardless of the solution and the concentration of the substance. When the degree of literacy of participants was compared, palatability for sucrose, caffeine, sodium chloride and citric acid did not differ between literate and illiterate individuals, regardless of the concentration of the solution (p>0.05 for all analyses).
There was no association between smoking, alcohol consumption and frequent use of the tested substances and the palatability of the solutions, independent of concentration. There was also no significant difference between the degree of palatability of the solutions based on the nutritional status of the study participants, regardless of the solution concentration.
DISCUSSION
The aging process causes functional changes, including a reduction in lean body mass and increased central adiposity.24,25 Teixeira et al.
conducted a study to identify cardiovascular risk in adults and elderly persons and found an increased waist circumference in 92.23% of those examined.26 In the present study, we found that
69.6% of participants had an increased or greatly increased waist circumference, a relevant result as these risk factors are directly associated with the genesis and progression of cardiovascular disease (CVDs).21 Among CVDs, Laks et al. stated that
atherosclerosis is the main cause of morbidity and mortality in the elderly population.27,28
There was no significant correlation between nutritional status and palatability, regardless of the concentration of the solutions evaluated. The results of a study by Skrandies and Zschieschang were contrary to the findings of the present study, identifying the influence of body weight on the gustatory and olfactory perception of 66 healthy adults surveyed, with a greater BMI related to a decrease in the perception of taste and smell.29
A ratio between the degree of taste sensitivity and the concentration of the tested solution was
found, with the participants achieving greater scores on the sensitivity scale for solutions with higher concentrations. A higher gustatory perception in more concentrated solutions can be explained by the fact that as concentrations increase, the amount of solute doubles from one to another. Evaluating the three concentrations of each flavor, it was observed that even in cases of no, low or very low sensitivity, most people were able to notice changes in the concentrations, with taste sensitivity increasing with more intense solutions.
In addition to the increased taste sensitivity of the participants at greater concentrations, there was a significant difference in the degree of taste sensitivity between adults and elderly persons. Compared to adults, the elderly group showed a reduction in taste sensitivity for two flavors. This may be related to the number of gustatory corpuscles present in the tongue. While in younger people more than 250 corpuscles are found in each papilla, in elderly persons aged over 70 years this number is reduced to less than 100 corpuscles. This has consequences for the detection and identification of taste, which is related to the number of corpuscles present in the gustatory corpuscles present in the lingual papillael.30
Several authors have observed this fact in their studies, including Anhe et al., Nordin et al., and Landis, Welge and Brämerson, who studied the taste perception of different age groups, including young people, adults and elderly persons. These studies demonstrated a significant reduction in palatability with advancing age, and found the elderly have less sensitivity to flavors than young individuals.31-33 Simchen et al.evaluated the smell
and taste of two age groups, one group aged under 65 years and the other over 65 years, and concluded that the perception of flavor decreased with increasing age.12 Additionally, Mojet, Heidema
and Christ, as well as Davenport, reported that sensory abilities suffer a sharp decline with age.13,34
It is important to note that although there is reduced taste sensitivity in elderly persons compared to adults, this did not occur for all the flavors tested in this study. The palatability of the caffeine and sodium chloride solutions did not differ between the age groups, regardless of the concentration tested. This result can be explained by the preserved sensitivity for salty and bitter tastes, both in adults and among the elderly, which can be related to the low consumption of these substances in everyday life. Therefore, when there is an intake of these flavors, even in a less concentrated form, they are more easily perceived. Another aspect that may be related to the greater perception of salty and bitter flavors is the part of the tongue with which the solutions made contact. In this case, the sodium and caffeine chloride solutions may have come into contact with parts of the tongue with more receptors for these flavors, allowing more intense identification of the salty and bitter flavors than the other flavors tested.35
Regardless of the concentration assessed, no significant associations were found in the present study between taste sensitivity and factors such as smoking, alcohol consumption, use of medication, gender and nutritional status. These findings may be associated with the similar life habits of the adults and elderly persons studied. Similar results were found by Passos, Venzke and Bós, who did not identify a significant association between palatability and consumption of alcohol, medication use, gender, nutritional status and smoking.36 However, a recent study obtained a
different result from that of the present study and the study by Passos, Venzke and Bós in relation to smoking. Santos, Echeveste and Vidoridentified a relationship between palatability and smoking in their study, when, in evaluating the taste perception of 48 volunteers divided among smokers and non-smokers, they concluded that smokers had a lower gustatory perception than the group of non-smokers.37 The current study obtained contrasting
results, as there was no significant difference in taste perception among smokers and non-smokers
when compared with the other volunteers.
There was no significant difference in the degree of palatability of men and women in the present study, independent of concentration and flavor, demonstrating similarity in the degree of palatability between the genders of the population in question. Similar findings were reported by Passos, Venzke and Bós, who also found no relationship between taste sensitivity and gender.36 A different result, however, was
described by Simchen et al., who observed an association between gender and olfactory and gustatory abilities, finding that women had greater gustatory and olfactory skills than men.12 Mojet,
Heidema and Christ; Anhe et al.; Nordin et al., and Landis, Welge and Brämersonalso found that women are more perceptive to flavors than men.13, 31-33 These findings differ from those of the
present study, where no significant differences in taste sensitivity were identified between men and women in the sample studied.
The present study suggests a reduction in palatability for the sweet and bitter flavors with the passing of the years. However, the study has certain limitations in relation to the low number of individuals surveyed and the cross-sectional design, variables which may have influenced the results of the study. The present study highlights the need for more studies with a larger sample size and the follow-up of individuals over time.
CONCLUSION
REFERENCES
1. Instituto Brasileiro de Geografia e Estatística. Sinopse do Censo Demográfico 2010: distribuição da população por sexo, segundo os grupos de idade [Internet]. Rio de Janeiro: IBGE; 2010 [acesso em 02 out 2015]. Disponível em: http://www.censo2010.ibge. gov.br/sinopse/index.php?dados=12#topo_piramide.
2. Instituto Brasileiro de Geografia e Estatística. Pesquisa Nacional por Amostra de Domicílios: PNAD 2011 [Internet]. Rio de Janeiro: IBGE; 2012 [acesso em 02 set 2015]. Disponível em: http://www. ibge.gov.br/home/presidencia/noticias/imprensa/ppts /00000010135709212012572220530659.pdf
3. Brasil, Secretaria de Direitos Humanos da Presidência da República. Informe Nacional sobre a implementação na América Latina e Caribe da Declaração de Brasília sobre Envelhecimento. In: 3ª Conferência Regional sobre Envelhecimento na América Latina e Caribe; 8-12 mai 2012; São José, Costa Rica. São José: CEPAL; 2012 [acesso em 02 set 2015]. Disponível em : http://www.cepal.org/celade/ noticias/paginas/9/46849/Brasil.pdf
4. Pereira MT, Martins RAS. Organização e gestão de um programa de exercício físico e qualidade de vida em homens idosos [tese]. Coimbra: Universidade de Coimbra, Faculdade de Ciências do Desporto e Educação Física; 2012.
5. Ciosak SI, Braz E, Costa MFBNA, Nakano NGR, Rodrigues J, Alencar RA, et al. Senescência e senilidade: novo paradigma na atenção básica de saúde. Rev Esc Enferm USP 2011;45(2):1763-8.
6. Fechine BRA, Trompieri N. O processo de envelhecimento: as principais alterações que acontecem com o idoso com o passar dos anos. InterSciencePlace 2015;20(1):1-27.
7. Alvis BD, Hughes CG. Physiology considerations in geriatric patients. Anesthesiol Clin 2015;33(3):447-56.
8. Negri R, Di Feola M, Di Domenico S, Scala MG, Artesi G, Valente S, et al. Taste perception and food choices. J Pediatr Gastroenterol Nutr 2012;54(5):624-9.
9. Douglas CR. Tratado de fisiologia aplicada à fonoaudiologia. São Paulo: Robe Editorial; 2002.
10. Soojeong K, Nami J. The study on development of easily chewable and swallowable foods for elderly. Nutr Res Pract 2015;9(4):420-4.
11. Alves LMT, Dantas RO. Percepção de sabores em pessoas normais. GED Gastroenterol Endosc Dig 2014;33(3):102-5.
12. Simchen U, Koebnick C, Hoyer S, Issanchou S, Zunft HJF. Odour and taste sensitivity is associated with body weight and extent of misreporting of body weight. Eur J Clin Nutr 2006;60(6):698-705.
13. Mojet J, Christ-Hazelhof E, Heidema J. Taste perception with age: generic or specific losses in threshold sensitivity to the five basic tastes? Chem Senses 2001;26(7):845-60.
14. Palheta Neto FX, Targino MN, Peixoto VS, Alcântara FB, De Jesus CC, De Araújo DC, et al. Anormalidades sensoriais: olfato e paladar. Arq Int Otorrinolaringol 2011;15(3):350-8.
15. Douglas CR. Fisiologia aplicada à nutrição. 2 ed. Rio de Janeiro: Guanabara Koogan; 2011.
16. Boyce JM, Shone GR. Effects of ageing on smell and taste. Postgrad Med J 2006;966(82):239-41.
17. Chumlea WC, Guo SS, Roche AF, Steinbaugh ML. Prediction of body weight for the nonambulatory elderly from anthropometry. J Am Diet Assoc 1988;88(5):564-8.
18. Chumlea WC, Roche AF, Steinbaugh ML. Estimating stature from knee height for persons 60 to 90 years of age. J Am Geriatr Soc 1985;33(2):116-20.
19. World Health Organization.. Geneva: WHO;1998 [acesso 12 set 2015]. Disponível em: http://www.who. int/en/
20. Organização Pan Americana de saúde. COLOCAR O TÍTULO [Internet]. Brasília, DF: OPAS; 2002 [acesso em 21 ago 2015]. Disponível em: http://www. paho.org/bra/.
21. Sociedade Brasileira de Cardiologia, Sociedade Brasileira de Endocrinologia e Metabologia. 1ª Diretriz Brasileira de Diagnóstico e tratamento da síndrome metabólica. Arq Bras Cardiol 2005;84(1):3-28.
22. World Health Organization. Obesity: preventing and managing the global epidemic. Geneva: WHO; 1997.
23. Mueller C, Kallert S, Renner B, Stiassny K, Temmel AFP, Hummel T, et al. Quantitative assessment of gustatory function in a clinical context using impregnated "taste strips"." Rhinology 2003;41(1): 2-6.
24. Silva Pícoli T, Figueiredo LL, Patrizzi LJ. Sarcopenia e envelhecimento. Fisioter Mov 2011;24(3):455-62.
25. De Araújo APS, Bertolini SMMG, Martins J Junior. Alterações morfofisiológicas decorrentes do processo de envelhecimento do sistema musculoesquelético e suas consequências para o organismo
Received: December 11, 2015 Revised: June 30, 2016 Accepted: August 03, 2016
26. Teixeira AMNC, Sachs A, Santos GMS, Asakura L, Coelho LC, Da Silva CVD. Identificação de risco cardiovascular em ambulatório de nutrição. Rev Bras Cardiol 2010;23(2):116-23.
27. Laks R, Araújo LMQ, Almada CM Filho, Cendoroglo MS. A importância do HDL-C e da PCR na avaliação do risco cardiovascular em idosos longevos. Einstein 2011;9(3 Pt 1):397-403.
28. Xavier HT, Izar MC, Faria JR Neto, Assad MH, Rocha VZ, Sposito AC, et al. 5ª Diretriz brasileira de dislipidemias e prevenção da aterosclerose. Arq Bras Cardiol 2013;101(4):1-20.
29. Skrandies W, Zschieschang R. Olfactory and gustatory functions and its relation to body weight. Physiol Behav 2015;142:1-4.
30. Nogués R. Factores que afectan la ingesta de nutrientes em el anciano y que condicionan su correcta nutrición. Nutr Clín 1995;15(2):39-44.
31. Ahne G, Erras A, Hummel T, Kobal G. Assessment of gustatory function by means of tasting tablets. Laryngoscope 2000;110(8):1396-401.
32. Nordin S, Brämerson A, Bringlöv E, Kobal G, Hummel T, Bende M. Substance and tongue-region specific loss in basic taste-quality identification in elderly adults. Eur Arch Otorhinolaryngol 2007;264(3):285-9.
33. Landis BN, Welge LA, Brämerson A. “Taste Strips”: a rapid, lateralized, gustatory bedside identification test based on impregnated filter papers. J Neurol 2009;256(2):242-8.
34. Davenport RJ. The flavor of aging. Sci Aging Knowledge Environ 2004;2004(12):1.
35. Strapasson GC, Lopez ACM, Basso T, Santos DF, Mulinari RA, Wille GMFC, et al. Percepção de sabor: uma revisão. Visão Acadêmica 2011;(12)1:65-73.
36. Passos DR, Venzke JG, Bós AJG. Avaliação do paladar de idosos e sua relação com o estado nutricional [tese]. Porto Alegre: Universidade Federal do Rio Grande do Sul; 2010.