Copyright
© ABE&M todos os dir
eitos r
eser
vados.
HOMA1-IR and HOMA2-IR indexes
in identifying insulin resistance and
metabolic syndrome – Brazilian
Metabolic Syndrome Study (BRAMS)
Índices HOMA1-IR e HOMA2-IR para identificação deresistência à insulina e síndrome metabólica – Estudo Brasileiro de Síndrome Metabólica (BRAMS)
Bruno Geloneze1, Ana Carolina Junqueira Vasques2, Christiane França Camargo
Stabe2, José Carlos Pareja1, Lina Enriqueta Frandsen Paez de Lima Rosado3,
Elaine Cristina de Queiroz2, Marcos Antonio Tambascia1, BRAMS Investigators4
ABSTRACT
Objective: To investigate cut-off values for HOMA1-IR and HOMA2-IR to identify insulin resis-tance (IR) and metabolic syndrome (MS), and to assess the association of the indexes with components of the MS. Methods: Nondiabetic subjects from the Brazilian Metabolic Syndrome Study were studied (n = 1,203, 18 to 78 years). The cut-off values for IR were determined from the 90th percentile in the healthy group (n = 297) and, for MS, a ROC curve was generated for
the total sample. Results: In the healthy group, HOMA-IR indexes were associated with central obesity, triglycerides and total cholesterol (p < 0.001). The cut-off values for IR were: HOMA1-IR > 2.7 and HOMA2-IR > 1.8; and, for MS were: HOMA1-IR > 2.3 (sensitivity: 76.8%; specificity: 66.7%) and HOMA2-IR > 1.4 (sensitivity: 79.2%; specificity: 61.2%). Conclusions: The cut-off values identified for HOMA1-IR and HOMA2-IR indexes have a clinical and epidemiological ap-plication for identifying IR and MS in Westernized admixtured multi-ethnic populations. Arq Bras Endocrinol Metab. 2009;53(2):281-287.
Keywords
Homeostasis model assessment; metabolic syndrome; insulin resistance; abdominal obesity
RESUMO
Objetivo: Determinar pontos de corte para os índices HOMA1-IR e HOMA2-IR na identificação de resistência à insulina (RI) e síndrome metabólica (SM), além de investigar a associação de ambos os índices com os componentes da SM. Métodos: Foram avaliados indivíduos não diabéticos (n = 1.203, 18 a 78 anos) participantes do Estudo Brasileiro de Síndrome Metabólica. Os pontos de corte para RI foram determinados com base no percentil 90 do grupo saudável (n = 297) e, para SM, foi construída uma curva receiver operating characteristic (ROC) para toda a amostra. Resultados: No grupo saudável, os índices HOMA-IR associaram-se à obe-sidade central, aos triglicérides e ao colesterol total (p < 0,001). Os pontos de corte para RI foram: HOMA1-IR > 2,7 e HOMA2-IR > 1,8; e, para SM, foram: HOMA1-IR > 2,3 (sensibilidade: 76,8%; especificidade: 66,7%) e HOMA2-IR > 1,4 (sensibilidade: 79,2%; especificidade: 61,2%). Conclusões: Os pontos de corte identificados para os índices HOMA1-IR e HOMA2-IR possuem aplicação clínica e epidemiológica na identificação de RI e SM em populações miscigenadas multiétnicas ocidentalizadas. Arq Bras Endocrinol Metab. 2009;53(2):281-287.
Descritores
HOMA; síndrome metabólica; resistência à insulina; obesidade abdominal
1 Laboratório de Investigação em Metabolismo e Diabetes (Limed), Instituto Nacional de Ciência e Tecnologia, Brasil 2 Laboratório de Investigação em Metabolismo e Diabetes (Limed), Universidade Estadual de Campinas (Unicamp), Campinas, SP, Brasil 3 Departamento de Nutrição e Saúde, Universidade Federal de Viçosa (UFV), Viçosa, MG, Brasil 4 Brazilian Metabolic Syndrome Study Group (BRAMS) – Investigators: Ada Letícia Murro, Ana Carolina Junqueira Vasques, Ana Claudia Felici, Antonio Calixto, Aurea Oliveira Silva, Bruno Geloneze, Carla Possolo Coghi, Carla Fiori, Christiane Stabe, Daniela Schiavo, Elaine Queiroz, Enrico Maluf Repetto, Fernanda Filgueira Hirsch, Giselle Lambert, José Carlos Pareja, José Roberto Matos-Souza, Marcelo Miranda de Oliveira Lima, Marcos Antonio Tambascia, Mariana Narbot Ermetice, Sylka Rodovalho Geloneze
Correspondence to: Bruno Geloneze
Limed, Gastrocentro, Universidade de Estadual de Campinas Rua Carlos Chagas, 420 13081-970 – Campinas, SP, Brasil [email protected]
Copyright
© ABE&M todos os dir
eitos r
eser
vados.
INTRODUCTION
T
he metabolic syndrome (MS) is a cluster of obesity, low HDL cholesterol, hypertension, impaired fast-ing glucose andelevated triglycerides, among other dys-metabolic conditios, reflecting underlying insulin resis-tance. MS and insulin resistance are risk factors for type 2 diabetes and are associated with cardiovascular disease morbidity and mortality (1). Insulin resistance and relat-ed metabolic conditions are becoming increasingly fre-quent, and a substantial proportion of apparently healthy people are reported to be insulin resistant (2,3).The homeostatic model assessment (HOMA) is a validated method to measure insulin resistance from fasting glucose and insulin. The original model HO-MA1-IR, first published by Mattews and cols. in 1985 (4), has been widely used, especially in epidemiological and clinical studies. Recently, the model was updated with some physiological adjustments to a computer version (HOMA2-IR) providing a more accurate index (5). Previously, our group identified the cut-off value of 2.71 for insulin resistance based on the HOMA1-IR index distribution in the Brazilian admixtured popula-tion (6). However, there is a lack of reference values for the new model. The spectrum of HOMA-IR indexes in populations is ethnic dependence, and specific cut-off values should be established to allow its use in differen-tiating normal from impaired insulin sensitivity (7).
Expert groups have developing a unifying definition for the MS. The International Diabetes Federation (IDF) established a simple diagnostic tool that is convenient to use in clinical practice and can be used and compared worldwide (8). The prevalence of MS in Brazilian popula-tion has been investigated (9-11). Nonetheless, no study has evaluated the optimal cut-off values for HOMA-IR indexes in identify MS in Brazilian adults.
In light of these observations, the present study aimed: to investigate the optimal cut-off values for HOMA1-IR and HOMA2-IR to identify insulin resistance and MS in Brazilian adults; to compare the ability of both indices to identify MS; and to evaluate clinical and metabolic char-acteristics according to HOMA-IR indexes distribution in healthy subjects and in the total studied population, including a wide body mass index (BMI) range.
METHODS
Subjects
This study was performed as part of the Brazilian Metabolic Syndrome Study (BRAMS), a population
survey on metabolic disorders. The data of 2,322 sub-jects were examined from the central database, and 1,203 of them attended the eligible criteria for the de-sired analyses: adult (age ≥ 18 years), non-diabetics, and fasting glucose (54.1 to 450.5 mg/dL) and specific in-sulin ranges (2.9 to 43.8 mU/L) in order to allow the HOMA2-IR calculations. Afterward, the healthy group (n = 297) was defined as: BMI < 30 kg/m², HDL cho-lesterol ≥ 40 mg/dL, triglycerides ≤ 200 mg/dL, LDL cholesterol < 160 mg/dL, fasting plasma glucose < 100 mg/dL and normotensive status. This study was approved by the Ethics Committee of the School of Medical Sciences of Universidade Estadual de Campinas (Unicamp), and informed consent was obtained from each participant.
Clinical and biochemical analysis
The anthropometrical measures were assessed by trained observers. Weight and height were measured with the subjects wearing light clothing and without shoes on. The waist circumference was assessed at the mid point between the lowest rib and the iliac crist at the end of a normal expiration (12). The BMI was calculated and classificated according the World Health Organization (WHO) recommendation (12).
Blood pressure measurement was taken according to the recommendations of the 5th Brazilian Guide-lines on Hypertension (13). The auscultatory meth-od was employed using a suitably calibrated mercury sphygmomanometer. The volunteers were in the sitting position and at rest for ten minutes.
Blood samples were obtained after a 12-hour over-night fast and stored in a freezer at -30ºC. Plasma insu-lin was determined using a specific radioimmunoassay kit (Linco Research Inc.). Glucose was determined by the oxidase method. Total cholesterol, HDL cholesterol and tryglicerides were measured using the colorimetric enzy-matic method. LDL cholesterol fraction was calculated by the Friedwald’s formula (14). The HOMA1-IR in-dex was calculated by the formula: HOMA1-IR = fasting plasma insulin (µU/ml) x fasting plasma glucose (mmol/ L)/22.5 (4). The HOMA2-IR index was obtained by the program HOMA Calculator v2.2.2 (15).
Definition of metabolic syndrome
fac-Copyright
© ABE&M todos os dir
eitos r
eser
vados.
tors: raised triglycerides level (≥ 150 mg/dL) or cur-rent treatment for this; reduced HDL cholesterol (< 40 mg/dL in males and < 50 mg/dL in females), or current treatment for this lipid; raised blood pressure (systolic blood pressure ≥ 130 or diastolic blood pres-sure ≥ 85 mmHg), or current treatment with an anti-hypertensive drug (of previously diagnosed hyperten-sion); raised fasting plasma glucose (≥100 mg/dL) or previously diagnosed type 2 diabetes.
Statistical analysis
Statistical analysis was performed with the SPSS pro-gram for Windows (version 12.0). A p value < 0.05 was considered statistically significant. The Kolmogo-rov-Smirnov test was applied to assess the assumption of normality for the data. Data were reported as mean ± standard deviation (SD) or median/interquartile range, according with the normal distribution status. The lower and upper HOMA-IR indexes quartiles were compared using the Mann-Whitney test, once the HO-MA-IR indexes were not normally distributed. The cat-egories of BMI were compared by the Kruskal-Wallis test. The Dunn’s post hoc test was applied for multiple comparisons. The cut-off values for insulin resistance were based on the 90th percentile in the healthy group. For MS, a receiver operating characteristic (ROC) curve was generated for the total studied population. The ar-eas under the ROC curve (AUC) were calculated (16) to evaluate the accuracy of the HOMA-IR indexes. The greater the AUC, the greater the discriminatory power of them for MS. The optimal cut-off value was denoted by the value that had the largest sum of sensitivity and specificity (17), and, at the same time, sensitivity and specificity ≥ 60%. The Z statistic pairwise comparison was used to compare the AUC.
RESULTS
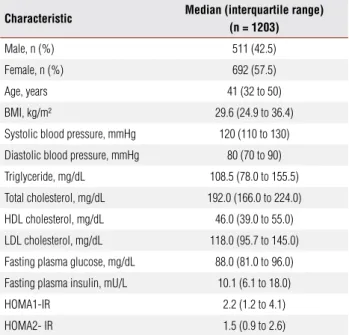
A total of 1,203 subjects aged 18 to 78 years participat-ed in this study. The main characteristics of the study population are presented in Table 1. It is observed a balanced distribution of gender; a comprehensive range of BMI, concerning eutrophic and obese subjects; and a different distribuition for the HOMA-IR indexes, that is, the HOMA2-IR presented lower values com-pared with the first published index. Table 2 shows the healthy group caracterization. All of them did not have any clinical and metabolic characteristics of MS. They
were normotensive, normolipidemic, non obese and normal glucose tolerants.
In Figure 1, it is possible to compare the distribu-tion of anthropometric and metabolic variables accord-ing the HOMA-IR indexes quartiles in the healthy group. The values for waist circumference, BMI, to-tal cholesterol and triglycerides increased in the upper quartiles for both HOMA-IR indexes (p < 0.05). LDL
Table 1. Clinical and metabolic characteristics of the total studied population
Characteristic Median (interquartile range) (n = 1203)
Male, n (%) 511 (42.5)
Female, n (%) 692 (57.5)
Age, years 41 (32 to 50)
BMI, kg/m² 29.6 (24.9 to 36.4)
Systolic blood pressure, mmHg 120 (110 to 130)
Diastolic blood pressure, mmHg 80 (70 to 90)
Triglyceride, mg/dL 108.5 (78.0 to 155.5)
Total cholesterol, mg/dL 192.0 (166.0 to 224.0)
HDL cholesterol, mg/dL 46.0 (39.0 to 55.0)
LDL cholesterol, mg/dL 118.0 (95.7 to 145.0)
Fasting plasma glucose, mg/dL 88.0 (81.0 to 96.0)
Fasting plasma insulin, mU/L 10.1 (6.1 to 18.0)
HOMA1-IR 2.2 (1.2 to 4.1)
HOMA2- IR 1.5 (0.9 to 2.6)
BMI = body mass index.
Table 2. Clinical and metabolic characteristics of the healthy group
Characteristic
Mean ± SD or median (interquartile range)
(n = 297)
Male, n (%) 130 (43.8)
Female, n (%) 167 (56.2)
Age, years 36.0 (27.0 to 46.0)
BMI, kg/m² 23.9 ± 2.9
Systolic blood pressure, mmHg 120 (110 to 120)
Diastolic blood pressure, mmHg 80 (70 to 80)
Triglyceride, mg/dL 78.0 (59.5 to 104.5)
Total cholesterol, mg/dL 177.1 ± 30.9
HDL cholesterol, mg/dL 52.0 (47.0 - 62.0)
LDL cholesterol, mg/dL 104.2 ± 26.7
Fasting plasma glucose, mg/dL 82.7 ± 7.5
Fasting plasma insulin, mU/L 5.9 (4.6 to 8.9)
HOMA1-IR 1.23 (0.92 to 1.93)
HOMA2- IR 0.87 (0.66 to 1.30)
Copyright
© ABE&M todos os dir
eitos r
eser
vados.
cholesterol values were higher in the fourth quartile only for HOMA1-IR distribuition, and HDL choles-terol presented no statistically significant difference be-tween quartiles.
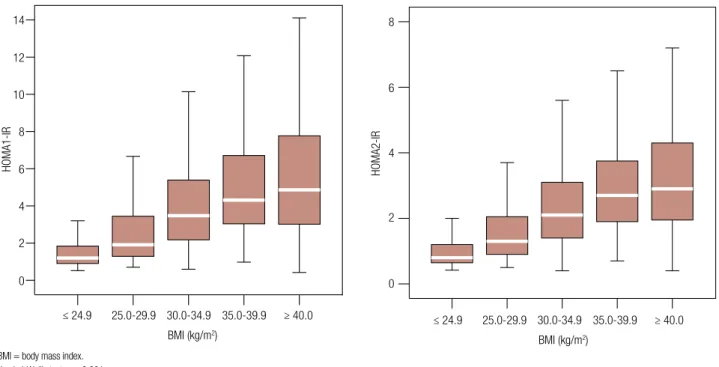
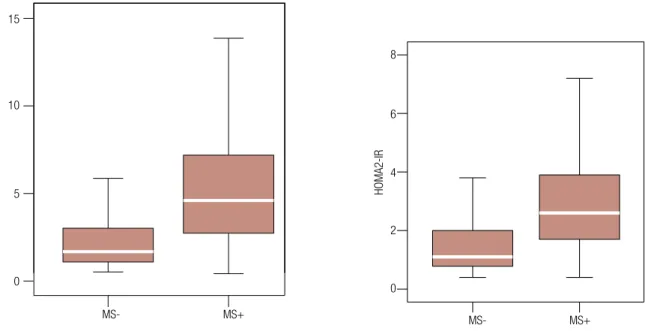
The comparison of HOMA-IR indexes distribution accross the BMI categories in the total studied popula-tion is presented in Figure 2. The multiple comparisons showed a parallel increasing in HOMA-IR indexes with a rising in BMI categories (p < 0.001), with an excep-tion for the highest degress of obesity (obesity grade I/ II versus grade III). The distribuition of HOMA-IR in-dexes according to MS diagnostic is presented in Figure
3. Subjects with a positive diagnostic for MS presented higher HOMA-IR indexes values (p < 0.001).
ROC analyse is presented in Figure 4. The AUC for the two HOMA-IR indexes were statisticaly significant (p < 0.001). HOMA1-IR index presented the largest AUC, if compared with HOMA2-IR. Both values were slightly different (p < 0.001), with overlapping 95% confidence intervals. Table 3 shows the optimal cut-off values identified for insulin resistance, considering the healthy subjects whose HOMA1-IR values were above the 90th percentile, and for MS, taking into account the optimal cut-off values in the ROC curve.
Q1 = first quartile; Q4 = fourth quartile; BMI = body mass index; WC = waist circumference; TG = triglyceride; TC = total cholesterol; HDL-C = HDL-cholesterol; LDL-C = LDL-cholesterol; t-test for BMI, WC, TC and LDL-C (presented as mean) and Mann-Whitney test for TG and HDL-C (presented as median); * p < 0.05; ** p < 0.001.
Figure 1. Comparison of clinical and metabolic characteristics according to HOMA-IR indexes quartiles in the healthy group.
BMI = body mass index. Kruskal-Wallis test. p < 0.001.
Figure 2. Box plot comparison of HOMA-IR indexes distribution accross the BMI categories in the total studied population. HOMA1-IR
22.5
79.3 85.2** 75.0
BMI
(kg/m2)
WC (cm)
TG (mg/dL)
TC (mg/dL)
HDL-C (mg/dL)
LDL-C (mg/dL) 93.0**
170.5182.9* Q1 Q4
51.5 52.0
99.7108.4*
25.1**
HOMA2-IR
22.4
79.2 85.1** 70.0
BMI
(kg/m2)
WC (cm)
TG (mg/dL)
TC (mg/dL)
HDL-C (mg/dL)
LDL-C (mg/dL) 95.0**
171.7183.2* Q1 Q4
50.0 52.0
102.6 108.5*
25.3**
14
HOMA1-IR
12
10
8
6
4
2
0
≤ 24.9 25.0-29.9 30.0-34.9 35.0-39.9 ≥ 40.0
BMI (kg/m2)
HOMA2-IR
8
6
4
2
0
≤ 24.9 25.0-29.9 30.0-34.9 35.0-39.9 ≥ 40.0
Copyright
© ABE&M todos os dir
eitos r
eser
vados.
MS- = subjects without metabolic syndrome; MS+ = subjects with metabolic syndrome; Mann-Whitney test; p < 0.001.
Figure 3. Box plot comparison of HOMA-IR indexes distribution according to metabolic syndrome diagnostic in the total studied population.
AUC = area under the curve; CI = confidence interval; ** p < 0.001 for null hypothesis: true area = 0.5; Z statistic for pairwise comparison of AUC: HOMA1-IR > HOMA2-IR; p < 0.001
Figure 4. Receiver operating characteristic (ROC) curves comparing HOMA-IR indexes as discriminators of metabolic syndrome in the total studied population.
8
6
4
2
0
MS- MS+
HOMA2-IR
15
10
5
0
MS- MS+
HOMA1-IR
1.0
HOMA1-IR
HOMA2-IR
Reference line 0.8
0.6
Sensitivity 0.4
0.0 0.2 0.4 0.6 0.8 1.0
0.2
1 - Specificity 0.0
Table 3. Cut-off values of HOMA1-IR and HOMA2-IR indexes to identify insulin resistance and metabolic syndrome
Index Insulin resistance Metabolic syndrome
Cut-off value* Cut-off value ** Sensibility (95%CI) Specificity (95%CI)
HOMA1-IR 2.7 2.3 76.8 (72.1 - 80.5) 66.7 (63.3 - 70.0)
HOMA2-IR 1.8 1.4 79.2 (74.7 - 82.8) 61.2 (57.6 - 64.6)
CI = confidence interval; * the 90th percentile in the healthy group; ** the optimal cut-off value verified in ROC analysis.
DISCUSSION
The present study investigated the optimal cut-off val-ues for HOMA1-IR and HOMA2-IR to identify insulin resistance and MS in an admixtured population. It was also demonstrated that insulin resistance, assessed by both HOMA-IR indexes, is associated with an elevated BMI, with a worse lipoprotein profile and with a posi-tive diagnostic for MS. Furthermore, it was verified that in the apparently healthy subjects, HOMA-IR indexes were positively associated with BMI and abdominal obesity, and with triglycerides and total cholesterol.
HOMA1-IR, the first described model, is a vali-dated method to evaluate insulin resistance. However, according to Levy and cols. (5), the original equation is now superseded by the new model. The HOMA2-IR is a more accurate representation of the metabolic process because it models the feedback relationship between in-sulin and glucose in the various organs in the body (7). HOMA1-IR: AUC = 0.78** (CI 95% = 0.76 - 0.81)
Copyright
© ABE&M todos os dir
eitos r
eser
vados.
On the other hand, the HOMA2-IR has the inconve-nience that only a specific range of values are acceptable for calculation. In clinical practice, this limitation makes difficult the management of insulin results outside the limits and the need for a computer to run the program. In this study, the HOMA1-IR showed an AUC statisti-cally higher than the area verified for the new model, but without major clinical relevance, because the values of the areas were quite similar (0.77 and 0.78) with an overlapping confidence intervals.
Most of the published cut-off points for the HO-MA-IR indexes are based on measures of dispersion. In the past, our group identified the cut-off value of 2.71 for insulin resistance evaluated by the HOMA1-IR in an admixture population (6). In this study, with an up-dated database and a larger sample, the value of 2.7 found was equivalent, reinforcing the concept that it is a useful reference for the Brazilian adult population. The cut-off value of 2.7 shows a hight similarity to early reports. Evaluating subjects apparently healthy, Buccini and Wolfthal (18) identified the cut-off value of 2.64 in Argentinians; Bonora and cols. (19) found the value of 2.77 in Italians and Yeni-Komshian and cols. (20) veri-fied the value of 2.7 in North Americans. In contrast, Ascaso and cols. (21) found the cut-off value of 3.8 in Spanish population.
For MS, the optimal cut-off value of 2.3 identified in the present study was smaller than the value for insu-lin resistance, probably because the MS involves the di-agnostic of multiple disorders simultaneously, not only the insulin resistance itself, but also main underlying pathophysiological condition, the central adiposity. In Korean non-diabetic adults Lee and cols. (22) identi-fied a very similar value of 2.34. Recentely, the cut-off value of 2.5 was established for assessing MS in a co-hort of Brazilian children (23).
Hence, for HOMA2-IR, there are no stabilished reference values for both, insulin resistance and MS, in the literature. We identified the cut-off value of 1.8 to detect insulin resistance, and of 1.4 for MS. The study of Buccini and Wolfthal (18) suggested the value of 1.67 to detect insulin resistance.
Obese individuals tend to be insulin resistant (24), what was demonstrated with the increasing HOMA-IR indexes gradient across the growing categories of BMI. On the other hand, some associations between HOMA-IR indexes and components of MS were iden-tified in the nonobese healthy group. In this group, the presence of higher values of BMI, triglycerides, total
cholesterol and LDL cholesterol in the upper HOMA-IR indexes quartiles could be explained by the body fat distribution, since the waist circumference was also increased in the upper HOMA-IR indexes quartiles. Waist circumference is a surrogate marker of abdominal fat mass. It correlates with subcutaneous and visceral fat mass and is related to increased cardiometabolic risk (25,26).
In conclusion, the cut-off values identified in both models, HOMA1-IR and HOMA2-IR, for insulin re-sistance and MS, have a clinical and epidemiological application for Westernized admixtured multi-ethnic populations. Given the association between insulin re-sistance, obesity and classical components of MS in the total population and in apparently healthy individuals, the early detection of insulin resistance and MS using a simple tool like HOMA models is attractive. Effec-tive interventions for improving insulin sensitivity and reducing abdominal obesity primarely by weight reduc-tion and physical activity may help in preventing type 2 diabetes and cardiovascular disease.
Disclosure: No potential conflict of interest relevant to this article was reported.
REFERENCES
Wilson PW, D’Agostino RB, Parise H, Sullivan L, Meigs JB. Met 1.
Syn as a precursor of cardiovascular disease and type 2 diabetes mellitus. Circulation. 2005;112(20):3066-72.
Ezenwakan CE, Kalloo R. Indices of obesity, dyslipidemia, and in-2.
sulin resistance in apparently healthy Caribbean subjects. J Clin Lab Anal. 2003;17(1):6-11.
Conus F, Allison DB, Rabasa-Lhoret R, St-Onge M, St-Pierre DH, 3.
Tremblay-Lebeau A, et al. Metabolic and behavioral characteris-tics of metabolically obese but normal-weight women. J Clin En-docrinol Metab. 2004;89(10):5013-20.
Matthews DR, Hosker JP, Rudenski AS, Naylor BA, Treacher DF, 4.
Turner RC. Homeostasis model assessment: insulin resistance and beta-cell function from fasting plasma glucose and insulin concentrations in man. Diabetologia. 1985;28(7):412-9.
Levy JC, Matthews DR, Hermans MP. Correct homeostasis model 5.
assessment (HOMA) evaluation uses the computer program. Dia-betes Care. 1998;21(12):2191-2.
Geloneze B, Repetto EM, Geloneze SR, Tambascia MA, Ermetice 6.
MN. The threshold value for insulin resistance (HOMA-IR) in an admixtured population IR in the Brazilian Metabolic Syndrome Study. Diabetes Res Clin Prac. 2006;72(2):219-20.
Wallace TM, Levy JC, Matthews DR. Use and abuse of HOMA 7.
modeling. Diabetes Care. 2004;27(6):1487-95.
Alberti KG, Zimmet P, Shaw J. Metabolic syndrome – a new 8.
world-wide definition. A Consensus Statement from the Interna-tional Diabetes Federation. Diabet Med. 2006;23(5):469-80. Oliveira EP, Souza MLA, Lima MDA. Prevalência de síndrome 9.
Copyright
© ABE&M todos os dir
eitos r
eser
vados.
Salaroli LB, Barbosa GC,
10. Mill JG, Molina MCB. Prevalência de síndrome metabólica em estudo de base populacional, Vitória, ES, Brasil. Arq Bras Endocrinol Metab. 2007;51(7):1143-52. Velásquez-Meléndez G, Gazzinelli A, Côrrea-Oliveira R, Pimenta 11.
AM, Kac G. Prevalence of metabolic syndrome in a rural area of Brazil. Sao Paulo Med J. 2007;125(3):155-62.
World Health Organization. Obesity: preventing and managing 12.
the global epidemic. Report of a WHO Consultation. Geneva: World Health Organization, 2000.
Sociedade Brasileira de Cardiologia; Sociedade Brasileira de Hi-13.
pertensão; Sociedade Brasileira de Nefrolo. V Diretrizes Brasilei-ras de Hipertensão Arterial. Arq BBrasilei-ras Cardiol. 2007;89(3):24-79. Friedwald WT, Levy RI, Fredrickson DS. Estimation of the concentra-14.
tion of low-density lipoprotein cholesterol in plasma, without use of the preparative ultracentrifuge. Clin Chem. 1972;18(6):499-502. The Oxford Centre for Diabetes. Endocrinology & Metabolism. 15.
Diabetes Trial Unit. HOMA Calculator. Available from: http://www. dtu.ox.ac.uk/ Acessed March 2009.
Hanley JA, McNeil BJ. A method of comparing the areas under 16.
receiver operating characteristic curves derived from the same cases. Radiology. 1983;148(3):839-43.
Van der Schouw YT, Verbeek AL, Ruijs JH. ROC curves for the initial 17.
assessment of new diagnostic tests. Fam Pract. 1992;9(4):506-11. Buccini GS, Wolfthal DL. Valores de corte
18. para índices de insu-linorresistencia, insulinosensibilidad e insulinosecreción deriva-dos de la fórmula HOMA y del programa HOMA2. Interpretación de los datos. Rev Argent Endocrinol Metab. 2008;45(1):3-21. Bonora E, Kiechl S, Willeit J, Oberhollenzer F, Egger G, T 19. argher G,
et al. Prevalence of insulin resistance in metabolic disorders: the Bruneck Study Diabetes. 1998;47(10):1643-9.
Yeni-Komshian H, Carantoni M, Abbasi F, Reaven GM. Rela-20.
tionship between several surrogate estimates of insulin resistan-ce and quantification of insulin-mediated glucose disposal in 490 healthy nondiabetic volunteers. Diabetes Care. 2000;23(2):171-5. Ascaso JF, Romero P, Real JT, Priego A, Valdecabres C, Carmena 21.
R. Cuantificación de insulinoresistencia con los valores de insuli-na basal e índice HOMA en uinsuli-na población no diabética. Med Clin. 2001;117(x):530-3.
Lee S, Choi S, Kim HJ, Chung YS, Lee KW, Lee HC, et al. Cutoff 22.
values of surrogate measures of insulin resistance for metabo-lic syndrome in Korean non-diabetic adults. J Korean Med Sci. 2006;21(4):695-700.
Madeira IR, Carvalho CNM, Gazolla FM, Matos HJ, Borges MA, 23.
Bordallo MAN. Ponto de corte do Índice Homeostatic Model As-sessment for Insulin Resistance (HOMA-IR) avaliado pela curva Receiver Operating Characteristic (ROC) na detecção de síndro-me síndro-metabólica em crianças pré-púberes com excesso de peso. Arq Bras Endocrinol Metab. 2008;52(9):1466-73.
Reaven GM. Insulin resistance: the link between obesity and 24.
cardiovascular disease. Endocrinol Metab Clin North Am. 2008;37(3):581-601.
McLaughlin T, Allison G, Abbasi F, Lamendola C, Reaven G. Pre-25.
valence of insulin resistance and associated cardiovascular di-sease risk factors among normal weight, overweight, and obese individuals. Metabolism. 2004;53(4):495-9.
Pouliot MC, Després JP, Lemieux S, Moorjani S, Bouchard C, 26.