ABSTRACT
The Metabolic Syndrome (MS) constitutes an independent risk factor of car-diovascular disease. There is evidence that proinsulin blood levels and the proinsulin/insulin ratio are associated to the MS. The purpose of this study was to compare proinsulin and insulin, insulin resistance index, and the proinsulin/insulin ratio as predictors of MS. This is a cross-sectional study involving 440 men and 556 women with a mean age of 24 years. Diagnosis of MS was made according to the National Cholesterol Education Program Adult Treatment Panel III. Blood levels of insulin and proinsulin were mea-sured, and the insulin resistance status was estimated using the homeostat-ic model assessment (HOMA-IR). The prevalence of MS was 10.1%. HOMA-IR was the best MS risk factor for both women and men (OR = 2.04; 95% CI: 1.68–2.48 and 1.09; 95% CI: 1.05–1.13, respectively). HOMA-IR presented the best positive predictive value for MS: 22% and 36% for men and women, respectively, and was the best MS indicator. The proinsulin/insulin ratio did not show significant association with MS. HOMA-IR, proinsulin, and insulin presented good negative predictive values for both genders that could be used to identify an at-risk population. (Arq Bras Endocrinol Metab 2007;51/7:1128-1133)
Keywords: Metabolic syndrome; Proinsulin; Insulin; Insulin resistance; HOMA-IR
RESUMO
Associação entre Proinsulina, Insulina, Fator Proinsulina/Insulina e Índice de Resistência Insulínica com a Síndrome Metabólica. A síndrome metabólica (SM) constitui um fator de risco independente para doenças cardiovasculares. Existem evidências de que níveis sangüíneos de proinsulina e o índice proinsulina/insulina estão associados com a presença da SM. O objetivo deste trabalho foi comparar proinsulina e insulina, índice de resistência insulínica e o fator proinsulina/insulina para predizer a presen-ça da SM. Este é um estudo transversal envolvendo 440 homens e 556 mu-lheres com média de 24 anos de idade. O diagnóstico da SM foi feito de acor-do com o Painel III acor-do programa de tratamento nacional educacional de colesterol para adultos. Níveis sangüíneos de insulina e proinsulina foram medidos, o índice de resistência insulínica foi estimado através do modelo de avaliação hemostático (IR). A prevalência da SM foi de 10%. HOMA-IR demonstrou ser o melhor fator de risco da SM em homens e mulheres (OR = 2,04; 95% CI: 1,68–2,48 e 1,09; 95% CI: 1,05–1,13, respectivamente). HOMA-IR apresentou o melhor valor preditivo positivo para SM: 22% e 36% para homens e mulheres, respectivamente, e foi o melhor indicador da SM. O índice proinsulina/insulina não apresentou associação significativa com SM. HOMA-IR, proinsulina e insulina apresentaram bons valores preditivos negativos para ambos sexos, o que poderia ser usado para identificar uma população de risco. (Arq Bras Endocrinol Metab 2007;51/7:1128-1133)
Descritores: Síndrome metabólica; Proinsulina; Insulina; Resistência insulínica; HOMA-IR
artigo original
Ivana Pivatto Patricia Bustos Hugo Amigo Ana Maria Acosta Antonio Arteaga
Department of Nutrition, Diabetes and Metabolism (IP, AMA & AA), Pontifical Catholic University of Chile, and Department of Nutrition (PB & HA), University of Chile, Santiago, Chile.
T
HE TERM METABOLIC SYNDROME (MS) refers to aclinical entity characterized by the co-occurrence of a group of conditions commonly associated with increased risk of type 2 diabetes and coronary heart dis-ease (CHD). MS is highly prevalent in the general pop-ulation worldwide, and likely to be present in young CHD individuals (1). In 2001, the National Cholesterol Education Program Adult Treatment Panel III (NCEP ATP III) Report defined MS on the basis of cut-points for physical and metabolic characteristics long recog-nized to be associated to insulin resistance (IR) (2).
Little is known about the exact nature of the rela-tionship between MS components, including abdominal obesity, elevated levels of blood pressure, elevated triglycerides, decreased HDL-C and elevated fasting glu-cose; however, there is strong evidence that IR is the underlying link or cause of MS (3). The observation that not all subjects with IR develop MS could be explained by the intensity of exposure to environmental factors. This hypothesis is supported by the finding of increased prevalence of MS over time in people with IR (4,5).
Several studies have suggested that proinsulin blood concentrations and the proinsulin/insulin ratio may be better related to cardiovascular risk factors (in particular, increased blood pressure and higher triglyc-erides levels) as compared to insulin blood concentra-tions (6,7). Previous prospective studies have shown positive evidence for association between fasting proinsulin and insulin levels with CHD or type 2 dia-betes in both men and women (8-10). The objective of this study is to compare insulin and proinsulin blood levels, insulin resistance status, and proin-sulin/insulin ratio as MS predictors in young, non-dia-betic adults from both genders.
MATERIALS AND METHODS
This is a cross-sectional analysis of 996 men and women selected from a sampling frame of 3,096 infants born between 1974 and 1978 in Limache, a city of 50,000 inhab-itants approximately 120 km from Santiago, Chile. The study sample was randomly selected (440 men and 556 women) between the years 2000 to 2003. This study received ethical approval from the ethic committee of the Faculty of Medicine, University of Chile. Participants were asked to sign a consent form after reading and listening to explanatory notes regarding the study.
All participants completed a questionnaire outlining their socio-demographic characteristics, personal history of disease and lifestyle information, including education status, cigarette and alcohol consumption. Data collection also included an international physical activity questionnaire-short form (11).
Waist circumference, body weight, and height were measured by trained nurses according to international rec-ommendation (12). Body weight was recorded using a stan-dard beam balance scale, with subjects barefoot and wearing light clothing. Blood pressure was measured three times, as used in other epidemiological studies (13,14). Waist circum-ference was measured on bare skin, midway between the lowest rib and the iliac crest, during mild respiration on standing subjects. Anthropometric and blood pressure data were obtained in local hospitals and health centers, using cal-ibrated equipment and standardized methodology. Body mass index (BMI) was estimated as the ratio of body weight to body height squared and expressed as kg/m2.
A 12-hour fasting blood sample was collected and serum was obtained for the measurement of insulin, proin-sulin, and lipids. For measurement of glucose levels, a plasma sample with sodium fluoride was used. Proinsulin concentra-tion was measured by radioimmunoassay using a commercial kit (Linco Research Inc., St. Charles, MO, USA), which allowed for an accurate assessment with little or no C-peptide or insulin cross-reactivity (< 0.2%) and a coefficient of varia-tion of 3.5%. Insulin was determined by radioimmunoassay (Insulin kit, DPC, Los Angeles, USA) with a coefficient of variation of 7.9%. High-density lipoprotein cholesterol (HDL-C) was determined by the Seigler and Wu technique (15), with a coefficient of variation of 4.6%. Triglycerides were determined by an enzymatic method with clarifying factor (Human Diagnostic, Germany) with a coefficient of variation of 4.8%. Plasma glucose was measured using an enzymatic method (GOD/PAP method, Human Diagnostic, Germany) with a coefficient of variation of 4.2%. Insulin resistance status was estimated using the Homeostatic Model Assessment (HOMA-IR) method (16) with a cut-point of 2.53 in accor-dance to the distribution of those values in Chilean population (17). All analytical measurements were done by trained pro-fessionals within the same laboratory using validated and stan-dardized methodology according to the international quality control program of Bio-Rad Laboratories, Inc. Hercules, CA. Lipid evaluation methods are in accordance with the Nation-al Reference System for Cholesterol established by the Center for Disease Control and Prevention (CDC) (18).
MS was diagnosed according to the ATP III guide-lines, which recommends that a case of MS must present three or more of the following components: abdominal obe-sity (waist circumference > 102 cm in men and > 88 cm in women), elevated blood pressure level (systolic blood pres-sure ≥130 mmHg or diastolic blood pressure ≥85 mmHg), elevated triglycerides (≥150 mg/dL), decreased HDL-C (< 40 mg/dL in men and < 50 mg/dL in women), and elevat-ed fasting glucose (≥110 mg/dL) (2). Only 2 subjects were excluded from this study due to diabetes treatment.
such as age, physical activity, cigarette and alcohol consump-tion, as well as educational status. Positive and negative pre-dictive values of MS were calculated; the cut-off points for each indicator were estimated according to the values of diag-nostic sensitivity and specificity in a Receiver Operating Char-acteristic (ROC) curve. The overall predictive values were also evaluated by area under ROC curve analysis (19). An area under the ROC curve of 1.0 indicates perfect classifica-tion of cases, whereas 0.5 means that the classificaclassifica-tion is not better than by chance. To evaluate the correlation between proinsulin and insulin, the Pearson’s test was used and the agreement was estimated by the Bland-Altman graph (20). Bayes’ theorem (21) was used to project the indicators using the positive predictive value for the prevalence of MS in Chile according to the National Health Survey conducted in 2003 (22). All tests were 2-tailed, and p < 0.05 was considered sta-tistically significant with a 95% confidence interval (CI). Data were analyzed with SPSS version 12.0.
RESULTS
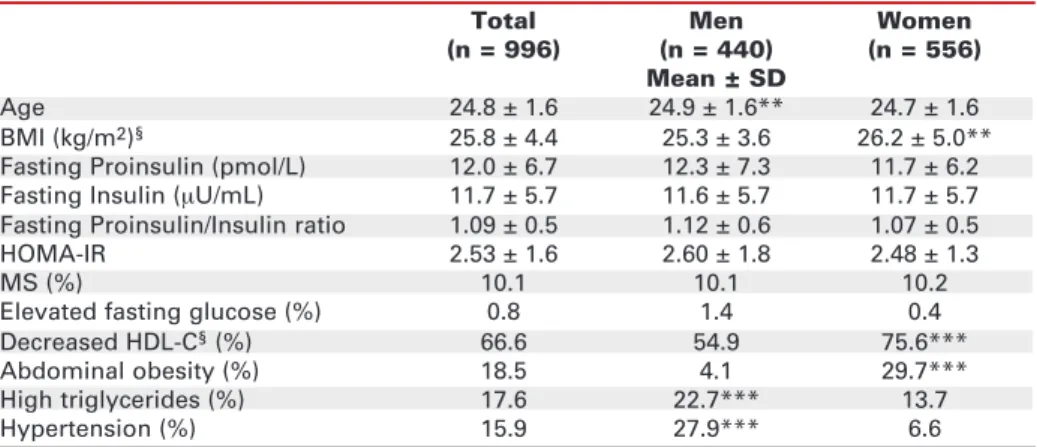
Table 1 summarizes the general characteristics of male and female groups, including anthropometric and bio-chemical parameters. Mean age value for the study group was 24 years. General BMI mean value was close to the overweight limit, higher in the female group as compared to the male group (p < 0.01). There were no significant differences between genders for blood levels of insulin, proinsulin, the proin-sulin/insulin ratio, and HOMA-IR. The prevalence of IR (34.5%) was higher than MS (10.1%) within the entire sample, and the prevalence of insulin resistance was 74.3% in those with MS. Elevated fasting glucose blood levels were detected in less than 1% of MS cases.
Decreased HDL-C and abdominal obesity were the most prevalent attributes of MS in females, while hypertension and elevated triglycerides were the most prevalent attributes in males.
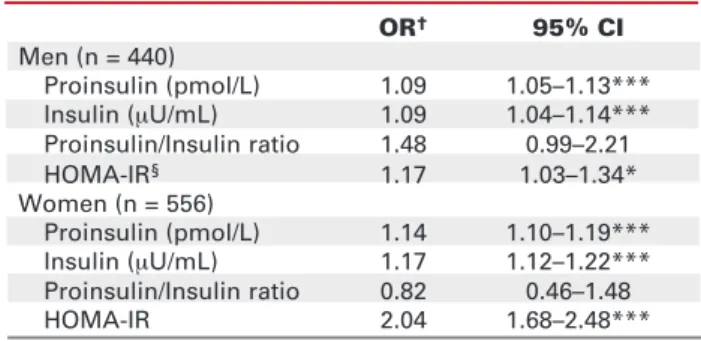
Proinsulin and insulin were positively associated with MS in the adjusted multivariate model, with low but significant odds ratio (OR) (p < 0.001). HOMA-IR was also positively associated with MS, especially in women (p < 0.001). The proinsulin/insulin ratio was in the limit of significance in men (p = 0.06) (table 2). The positive and negative MS predictive values for both genders are shown in table 3. All variables showed low positive predictive values for males and females. However, HOMA-IR and proinsulin present-ed the highest levels of positive prpresent-edictive values for both genders. Men and women presented good nega-tive predicnega-tive values (≥93%) for all studied variables.
Figure 1A shows the correlation between proinsulin and insulin, evidencing a positive but not strict correlation of both indicators (r = 0.52, p < 0.001). Figure 1B shows the degree of agreement between proinsulin and insulin, according to the Bland-Altman graph. The graph shows a strict limit of agreement (-12.4 to +11.7), with the majority of the values close to the average (-0.25), indicating a good agreement. However, this is not observed for higher, out of the limit values of both indicators, which can pos-sibly indicate the difference between the two molecules. Figure 2 shows a projection of all variables using the positive predictive value according to the current MS prevalence in Chile, as published by the National Health survey in 2003. MS prevalence in individuals aged 45–64 years was 36.5%, while accord-ing to the projection, the positive predictive value of
Table 1.Anthropometric and metabolic characteristics of the sample, by gender.
Total Men Women
(n = 996) (n = 440) (n = 556)
Mean ± SD
Age 24.8 ± 1.6 24.9 ± 1.6** 24.7 ± 1.6
BMI (kg/m2)§ 25.8 ± 4.4 25.3 ± 3.6 26.2 ± 5.0**
Fasting Proinsulin (pmol/L) 12.0 ± 6.7 12.3 ± 7.3 11.7 ± 6.2
Fasting Insulin (µU/mL) 11.7 ± 5.7 11.6 ± 5.7 11.7 ± 5.7
Fasting Proinsulin/Insulin ratio 1.09 ± 0.5 1.12 ± 0.6 1.07 ± 0.5
HOMA-IR 2.53 ± 1.6 2.60 ± 1.8 2.48 ± 1.3
MS (%) 10.1 10.1 10.2
Elevated fasting glucose (%) 0.8 1.4 0.4
Decreased HDL-C§(%) 66.6 54.9 75.6***
Abdominal obesity (%) 18.5 4.1 29.7***
High triglycerides (%) 17.6 22.7*** 13.7
Hypertension (%) 15.9 27.9*** 6.6
** p < 0.01, *** p < 0.001
§BMI, body mass index; HDL-C, high-density lipoprotein cholesterol; HOMA-IR,
levels of insulin, proinsulin, and HOMA-IR could reach up to 60% of cases.
When comparing the MS predictors using the ROC curve analysis, HOMA-IR was the best MS pre-dictor (area under the ROC curve of 0.805), followed by insulin (area of 0.800), proinsulin (0.740), and the proinsulin/insulin ratio, for which the area analysis was not significant.
DISCUSSION
The present study demonstrates that proinsulin, insulin, and HOMA-IR in young non-diabetic sub-jects are significant risk factors for MS in both men
and women. This is not the case for the proinsulin/ insulin ratio. HOMA-IR demonstrated to be the strongest MS risk factor.
Differences observed between genders could be explained by the diverse prevalence of clinical attribut-es and their association with the studied indicators, since abdominal obesity and decreased HDL-C are significantly more prevalent in women and elevated blood pressure and elevated triglycerides are signifi-cantly more prevalent in men. However, all analyzed variables yielded high negative predictive values that could be useful in identifying subjects without MS at the moment of the study, and the low positive predic-tive values could be explained by the low MS preva-lence in this young population.
Table 2.Proinsulin, insulin, the proinsulin/insulin ratio,
HOMA-IR, and the metabolic syndrome for men and women.
OR† 95% CI
Men (n = 440)
Proinsulin (pmol/L) 1.09 1.05–1.13***
Insulin (µU/mL) 1.09 1.04–1.14***
Proinsulin/Insulin ratio 1.48 0.99–2.21
HOMA-IR§ 1.17 1.03–1.34*
Women (n = 556)
Proinsulin (pmol/L) 1.14 1.10–1.19***
Insulin (µU/mL) 1.17 1.12–1.22***
Proinsulin/Insulin ratio 0.82 0.46–1.48
HOMA-IR 2.04 1.68–2.48***
* p < 0.05, *** p < 0.001.
†Adjusted for age, smoking, physical activity, alcohol
con-sumption, and educational status.
§HOMA-IR, homeostatic model assessment-insulin
resis-tance; OR, odds ratio; CI, confidence interval.
Table 3.Positive and negative predictive values of
metabolic syndrome for men and women.
Positive Negative
predictive predictive
value value
% Men
Proinsulin (pmol/L) 21 93
Insulin (µU/mL) 18 95
Proinsulin/Insulin ratio 12 94
HOMA-IR† 22 95
Women
Proinsulin (pmol/L) 32 94
Insulin (µU/mL) 29 96
Proinsulin/Insulin ratio 11 93
HOMA-IR 36 95
†HOMA-IR, homeostatic model assessment-insulin
resis-tance.
60 50 40 30 20 10 0
Proinsulin (pmol/L)
60 50 40 30 20 10 0
Difference (Proinsulin-Insulin)
0 10 20 30 40 50 60 70
Insulin (µU/mL) Mean value (Proinsulin + Insulin)/2
0 20 40 60
Figure 1. A.Pearson’s correlation between proinsulin and
insulin (r = 0.52, p < 0.001), evidencing a positive but not strict
correlation of both indicators. B. Bland-Altman plot for
com-parison between proinsulin and insulin indicating a reason-able agreement with extreme values out of the agreement limit of 95% indicating biological differences between the two indicators.
23-26 years 10.1%
45-64 years 36.5%
65 and + years 48%
Positive Predictive Value
%
80 70 60 50 40 30 20 10 0 Current MS§
prevalence in Chile
HOMA-IR Insulin Proinsulin Proinsulin/ Insulin ratio
Figure 2. Projection of HOMA-IR, insulin, proinsulin, and
proinsulin/insulin ratio using the positive predictive value according to the current MS prevalence in Chile.
§MS, metabolic syndrome; HOMA-IR, homeostatic model
assessment-insulin resistance.
There has been controversy regarding the defin-ition of MS as well as the determination of the cut-points for some of its diagnostic components (23,24). If the new MS definition is considered, the prevalence of the syndrome would increase in this population sam-ple. According to the latest national report regarding the prevalence of MS components in Chile (22), the prevalence of the syndrome in this population would increase by 15% along with the predictive values.
One of the main strengths of this study is the population-based design. In addition, the enrolled population sample incorporates young subjects of both genders. All analytical measurements were con-ducted by trained professionals from the same labora-tory, using validated and standardized methodology and international quality control. However, the high number of young subjects, reflected by the low preva-lence of MS and insulin resistance in the population sample, may have caused some degree of loss by statis-tical power. Furthermore, it is known that individuals presenting abnormal values for one or more compo-nent of the MS or insulin resistance at young age are at risk of developing MS later, since there is evidence that this condition increases with age (4,5).
Insulin is synthesized from its precursors, pre-proinsulin and pre-proinsulin, in the β cells of the Islets of Langerhans. Within the βcell granules, proinsulin is con-verted by a process of enzymatic cleavage to insulin and C-peptide. Although they are both part of a synthesis sequence, proinsulin and insulin differ in 4 amino acids that are lost during the fragmentation process of proin-sulin, thus justifying separated quantifications (25,26).
We were somewhat surprised by the lack of asso-ciation between the proinsulin/insulin ratio and MS, given that both components of the ratio, when isolated, are good MS predictors. The observation could be due to the different biological effects of each molecule. Pro-jecting our results to the current MS prevalence in Chile, proinsulin, insulin, proinsulin/insulin ratio and HOMA-IR improved their positive predictive values, suggesting that those indicators could be useful in pre-dicting MS in an epidemiologic environment with high-er metabolic prevalence.
Prospective studies analyzing different indica-tors as predicindica-tors of type 2 diabetes and CHD proved proinsulin as the best predictor (9,10,27). Apart from our data, we have been able to find only one study that evaluated the importance of proinsulin as a MS pre-dictor. Palaniappan et al. (28), in a prospective study including 714 subjects, found that the best MS pre-dictors were abdominal circumference and proinsulin in nondiabetic adults.
Our results, based on ROC curve analysis for best prediction indicator, show that the best MS pre-dictor is HOMA-IR, which could also be useful as a risk factor for type 2 diabetes and CHD. In the entire study population, proinsulin did not add predictive value compared with other indicators. As a result, at the moment we do not recommend proinsulin as a routine indicator of MS. Currently, there are too many different methods to determine intact proinsulin and its fractions, and we believe that future standardized methods could make possible the use of proinsulin in the clinical diagnosis of MS.
In the present study, fasting proinsulin, insulin, and HOMA-IR were significantly associated with MS for both genders. This report evaluated the potential different effects of proinsulin and proinsulin/insulin ratio in men and women. Prospective evaluation of proinsulin as a MS predictor in older men and women is needed to confirm the gender differences observed, as well as to elucidate the mechanism for the associa-tion between proinsulin levels and CHD risk factors.
ACKNOWLEDGMENTS
We gratefully acknowledge Dr. Jaime Rozowski for his support and performing revision of this manuscript’s English version.
REFERENCES
1. Milani RV, Lavie CJ. Prevalence and profile of metabolic syn-drome in patients following acute coronary events and effects of therapeutic lifestyle change with cardiac rehabilita-tion. Am J Cardiol 2003;92:50-4.
2. Expert Panel on Detection, Evaluation, and Treatment of High Blood Cholesterol in Adults: Executive summary of the third report of the National Cholesterol Education Program (NCEP) Expert Panel on Detection, Evaluation, and Treatment, of High Blood Cholesterol in Adults (Adult Treatment Panel III).
JAMA 2001;285:2486-97.
3. Reaven GM. Banting lecture 1988. Role of insulin resistance in human disease. Diabetes 1988;37:1595-607.
4. Grundy SM, Brewer HB Jr, Cleeman JI, Smith SC Jr, Lenfant C; American Heart Association; National Heart, Lung, and Blood Institute. Definition of metabolic syndrome: Report of the National Heart, Lung, and Blood Institute/American Heart Association conference on scientific issues related to defini-tion. Circulation 2004;109:433-8.
5. Grundy SM. Obesity, metabolic syndrome, and coronary ath-erosclerosis. Circulation 2002;105:2696-8.
6. Zethelius B, Byberg L, Hales CN, Lithell H, Berne C. Proin-sulin is an independent predictor of coronary heart disease: report from a 27-year follow-up study. Circulation 2002;105:2153-8.
7. Haffner SM, Mykkanen L, Valdez RA, Stern MP, Holloway DL, Monterrosa A, et al. Disproportionately increased proinsulin levels are associated with the insulin resistance syndrome. J
8. Pradhan AD, Manson JE, Meigs JB, Rifai N, Buring JE, Liu S, et al. Insulin, proinsulin, proinsulin:insulin ratio, and the risk of developing type 2 diabetes mellitus in women. Am J Med 2003;114:438-44.
9. Haffner SM, D’Agostino R, Mykkänen L, Hales CN, Savage PJ, Bergman RN, et al. Proinsulin and insulin concentrations in relation to carotid wall thickness: the insulin resistance ather-osclerosis study. Stroke 1998;29:1498-503.
10. Oh J-Y, Barrett-Connor E, Wedick NM. Sex differences in the association between proinsulin and intact insulin with coro-nary heart disease in nondiabetic older adults: the Rancho Bernardo study. Circulation 2002;105:1311-6.
11. Craig CL. International physical activity questionnaire (IPAQ): 12 – country reliability and validity. Med Sci Sports Exerc 2003;35:1381-95.
12. Guidelines for data Processing and Analysis of the Interna-tional physical activity questionnaire (IPAQ) – Short Form. IPAQ Research Committee, April 2003.
13. de Onis M, Onyango AW, Van den Broeck J, Chumlea WC, Martorell R. Measurement and standardization protocols for anthropometry used in the construction of a new internation-al growth reference. Food Nutr Bull 2004;25:S27-36. 14. Hense HW, Koivisto AM, Kuulasmaa K, Zaborskis A, Kupsc W,
Tuomilehto J. Assessment of blood pressure measurement quality in the baseline surveys of the WHO MONICA project.
J Hum Hypertens 1995;9:935-46.
15. Reynolds K, Gu D, Muntner P, Wu X, Chen J, Huang G, et al. For the Inter ASIA Collaborative Group. Geographic varia-tions in the prevalence, awareness, treatment and control of hypertension in China. J Hypertens 2003;21:1273-81. 16. Seigler L, Wu WT. Separation of serum high-density
lipopro-tein for cholesterol determination: ultracentrifugation vs. pre-cipitation with sodium phosphotungstate and magnesium chloride. Clin Chem 1981;27:838-41.
17. Katsuki A. Homeostasis model assessment is a reliable indi-cator of insulin resistance during folow-up of patients with type 2 diabetes. Diabetes Care 2001;24:362-5.
18. Acosta AM, Escalona M, Maiz A, Pollak F, Leighton F. Deter-minación del índice de resistencia insulínica mediante HOMA en una población de la región metropolitana de Chile. Rev
Med Chil 2002;130:1227-31.
19. Fallest-Strobl P, Olafsdottir E, Wiebe D, Westgard J. Compari-son of NCEP performance specifications for triglycerides, HDL, and LDL-cholesterol with operating specifications based on NCEP clinical and analytical goals. Clin Chem 1997;43:2164-8.
20. Zweig MH, Campbell G. Receiver-operating characteristics (ROC) plots: a fundamental evaluation tool in clinical medi-cine. Clin Chem 1993;39:561-77.
21. Bland JM, Altman DG. Statistical methods for assessing agreement between two methods of clinical measurement.
Lancet 1986;8476:307-10.
22. Fletcher RH, Fletcher SW, Wagner EH. Epidemiología Clíni-ca. 2aed. Madrid: Masson, Willans and Wilkins, 1998.
23. Ministerio de salud (Chile). Encuesta nacional de salud-Chile 2003 [on line]: Departamento de epidemiología. Departamen-to de salud pública de la pontificia universidad católica de Chile. Dec 2003. Chile: may 2004. Available at: <http://epi.min-sal.cl/epi/html/invest/ENS/ENS.htm>. Accessed in July 2005. 24. Reaven GM. The metabolic syndrome: requiescat in pace.
Clin Chem 2005;51:931-8.
25. Grundy SM. The metabolic syndrome still lives. Clin Chem 2005;51:1352-4.
26. Given BD, Cohen RM, Shoelson SE, Frank BH, Rubenstein AH, Tager HS. Biochemical and clinical implications of proinsulin conversion intermediates. J Clin Invest 1985;76:1398-405. 27. Steiner DF, Oyer PE. The biosynthesis of insulin and a
proba-ble precursor of insulin by a human islet cell adenoma. Proc
Natl Acad Sci USA 1967;57:473-80.
28. Nijpels G, Popp-Snijders C, Kostense PJ, Bouter LM, Heine RJ. Fasting proinsulin and 2-h post-load glucose levels pre-dict the conversion to type 2 diabetes in subjects with impaired glucose tolerance: the Hoorn study. Diabetologia 1996;39:113-8.
29. Palaniappan L, Carnethon MR, Wang Y, Hanley AJ, Fortmann SP, Haffner SM, et al. Predictors of the incident metabolic syndrome in adults. Diabetes Care 2004;27:788-93.
Endereço para correspondência:
Ivana Pivatto