ABSTRACT
ORIGINAL AR
with correlated factors
Language-Speech-Hearing Sciences Course, Department of Physiotherapy,
Language-Speech-Hearing Sciences and Occupational Therapy, Faculdade
de Medicina da Universidade de São Paulo (FMUSP)
CONTEXT AND OBJECTIVE: Some factors seem to infl uence speech impairment among phonologi-cally disordered children. The aim was to compare severity indices with some correlated factors. DESIGN AND SETTING: Observational, analytical and cross-sectional study conducted within the Language-Speech-Hearing Sciences Course, Universidade de São Paulo.
METHOD:Fifty phonologically disordered chil-dren with ages ranging from 4 to 11 years took part. The indices were calculated from phonology tests and were correlated with anamnesis and au-diological data. Student’s t test and Spearman’s correlation were used to compare percentages of consonants correct (PCC) and process den-sity index (PDI) for children with and without otitis, upper respiratory histories and audio-logical abnormalities, with regard to whether or not they were comprehended during assessment, their ages when they started to speak and their ages at the assessment.
RESULTS: The higher the age at the assessment was, the higher the PCC (imitation: 0.468; naming: 0.431; Spearman’s correlation) and the lower the PDI (imitation: 0.459; naming: 0.431); the later the child started to speak, the lower the PCC (imitation p = 0.064; naming p = 0.050) and the higher the PDI (imitation p = 0.067; naming p = 0.042). There were differences between groups with and without upper respiratory history (PCC: imitation p = 0.016, naming p = 0.005; PDI: imitation p = 0.014, naming p = 0.008). There was no difference between the groups regarding otitis, comprehension during the assessment and audiological data.
CONCLUSIONS: Children with upper respiratory histories who began to speak later presented more severe speech impairment indices. KEY WORDS:Diagnosis. Language development disorders. Respiratory tract infections. Otitis. Severity of illness index.
INTRODUCTION
Despite the great occurrence of phonological disorders among children, their cause has not yet been defi ned. These disorders are characterized by abnormal sound production and inadequate use of the phonological rules of the language regarding sound distribution and syllable types. Furthermore, they present varying degrees of severity and speech intelligibility.1 Several studies
have tried to correlate the linguistic symptoms presented by such subjects with possible variables that would interfere with the acquisition and mastery of phonological rules, and which could be the cause of these disorders.
The relationship between otitis and pho-nological disorders has also been studied. This is of interest because otitis is common in early infancy and decreases with increasing age. Otitis may occur in repeated episodes in many of these children.2 Researchers who have claimed that
otitis has no effect on language have argued that, during otitis episodes, the conductive hearing loss ranges from mild to moderate and fl uctu-ates, and that, immediately after the episode, the hearing returns to normal and the effects of the otitis are compensated by normal hearing.
Speech and language impairment is as-sociated with the presence of otitis media with effusion, particularly when it appears during the fi rst two years of life. Some authors have also expressed concern that other upper respiratory disorders, such as rhinitis, may interfere in the acquisition of language and speech.3Otitis has
been separated from upper respiratory infec-tions in the present paper becauseas described the temporary hearing loss caused by otitis does not allow some sounds to be heard. This abnormality in the sound signal quality leads to abnormalities with regard to distinguishing the phonetic coding. Other infections of the respiratory tract do not cause such disorders.
On the other hand, some researchers4,5
have shown that children who start to speak later and also present repeated episodes of otitis
have a higher risk of presenting phonological disorder at 4:0 years (four years, zero months). This would occur because the temporary hear-ing loss that comes together with the otitis makes some sounds inaudible, since this loss is not the same for all frequencies.6 Despite the
transitory nature of the hearing loss, it alters the sound perception quality because the audi-tory signal may be incomplete or inconsistent, thus inducing abnormalities in distinguishing the phonetic coding.7
The severity of phonological disorders may be manifested to differing degrees and thus give rise to variations in speech intelligibility.1 Another
matter that has been the subject of much discus-sion among phonological disorder researchers is the extent to which its severity can be measured by indices. One of the purposes of such indices would be to measure the subject’s improvement during the treatment and to indicate more pre-cisely when the patient should be discharged.
There are many ways to quantify the sever-ity of phonological disorders and to assist in differentiating the subtypes of phonological disorders in the literature.8 In 1982, two authors1
developed a procedure for evaluating the severity of phonological disorders called the percentage of consonants correct (PCC). This procedure investigates the number of correct consonants produced in a sample of continuous speech, in relation to the total number of consonants in this sample. These authors found that, for mild phonological disorders, the PCC was from 85 to 100%, while for mild-moderate disorders it was 65 to 85%, for moderate-severe disorders it was 50 to 65% and for severe disorders it was lower than 50%. In this method of counting, omissions, substitutions and common and un-common distortions are considered incorrect.
Another way of measuring the severity of phonological disorders is the phonological den-sity index (PDI).9 For this, the total number of
calculated and divided by the number of words analyzed in the sample. The PDI is unrelated to any specifi c type of speech sample and it can be used with any test or evaluation procedure. Although the PDI needs more refi nement and more tests, it can be seen to have great clinical potential for measuring the severity and/or phonological intelligibility.
In 2002, the PCC and PDI were validated for Brazilian children.11 Other population
studies using these severity indices have been carried out in the English language.1,8,9
In the Portuguese language, one study was performed, in which 22 subjects with phono-logical disorder were distributed according to the PCC severity classifi cation. Only one occurrence of severe degree was observed; the majority of the occurrences were of mild-mod-erate degree (8 subjects), followed by modmild-mod-erate- moderate-severe degree (7 subjects) and mild degree (6 subjects). A negative correlation was observed between the two indices, thus showing that the PCC and the PDI were inversely propor-tional.12 Some other studies have also used the
PCC in the Portuguese language.11,13,14
OBJECTIVE
The aim of the present study was to in-vestigate the variation in the PCC and PDI according to factors correlating with phonol-ogy disorders.
The hypothesis was that children with oti-tis and upper respiratory histories who began speaking later, were older at the time of the as-sessment period and were not comprehended would present worse severity indices.
METHOD
This study was approved by the Ethics Committee for Research Project Analysis (CAPPesq) of the Clinical Board of Hospi-tal das Clínicas, Universidade de São Paulo (protocol 286/99). The legal guardians of all the participating subjects signed an informed consent statement. This study was observa-tional, analytical and transversal.
Fifty children with phonological disorders, aged between 4 and 11 years old, took part in this study. All the subjects were being attended by the Speech Language and Phonology Labo-ratory of the Department of Communication Disorder Sciences, Fa culdade de Medicina da Universidade de São Paulo (FMUSP).
Regarding age, there were large numbers of subjects between 4:1 and 7:6 years old. The gender proportions were that 70% of the subjects were males (35) and 30% females (15), i.e. 2.33:1 (boys to girls). Moreover, most of the male subjects were between 4:7 and 5:0
years old, while the females were between 5:7 and 6:0 years old.
Firstly, the subject’s parents were inter-viewed and an anamnesis was obtained, with some relevant data on the child’s development. This included information such as whether the child was understood at the beginning of speech development and at the time when the disorder was diagnosed, history of respiratory diseases, history of otitis and age at which speech devel-opment began, among other data.
An audiological evaluation was carried out on all the children at the Audiology Service of the Speech and Hearing Department. The equipment used consisted of acoustic cabins, a Grason-Standler middle ear analyzer (model GSI-33), a Maico Hearing Instruments audi-ometer (model MA-21) and a Grason-Standler audiometer (model GSI-16).
All the subjects underwent speech assess-ment, including all the tests that form part of the Child Language Test (ABFW),15 an
oro-facial structure assessment and phonological awareness tests.
The phonology tests of imitation and naming were part of the Child Language Test (ABFW).15 These tests were recorded on a
CD recorder with a Quicksound microphone connected. The recordings were made in an acoustically treated environment. The assess-ments were also recorded on digital video in order to enable better data analysis.
The PCC and PDI were calculated from the imitation and naming tests. These severity indices were calculated for each child.
For the PCC calculation, omissions, substitutions and common and uncommon distortions were considered to be errors for each subject. In the proposed classifi cation,1
PCC scores over 85% were taken to be mild, scores between 65% and 85% were taken to be mild-moderate, scores between 50% and 65% were taken to be moderate-severe and scores less than 50% were taken to be severe.
The other severity measurement method was the phonological density index (PDI). This was calculated as the mean for the pho-nological processes of each word. The PDI took into account the fact that one incorrect sound might result in the application of one or more processes.9
Following data analysis, the group was di-vided into children with and without otitis and upper respiratory disorder histories; audiometric failure; whether they were or were not intelligible at the time of the assessment; age of onset of speech; and age at the time of the assessment.
The PCC and PDI were calculated and compared with the anamnesis data. The
data were analyzed by means of calculating the PCC and PDI from the naming and imitation14 tasks, and these were compared
with the anamnesis and audiological data that had been collected when the disorder was diagnosed.
In order to compare the children’s per-formance in the tests, Student’s t test for com-paring means was used, with a signifi cance level of 0.05. For associations of variables, Spearman’s correlation was used.
RESULTS
Association between age and
Association between age and
performance in the tests, performance in the tests,
using PCC and PDI using PCC and PDI
In relation to the children’s ages (in months) at the time of the phono-logical assessment, for the PCC, Spearman’s correlation was 0.468 in the imitation task (p = 0.001) and 0.431 in the naming task (p = 0.002); for the PDI, the correlation was 0.459 in the imitation task (p = 0.001) and 0.431 in the naming task (p = 0.002). There-fore, there was evidence for an association between the index values in the two tasks and the age at the time of the assessment, such that the higher the age was, the higher the PCC and the lower the PDI were.
In relation to the age at which the child began to speak, for the PCC, Spearman’s correlation was 0.295 in the imitation task (p = 0.064) and 0.312 in the naming task (p = 0.050). For the PDI, the correlation was 0.292 in the imitation task (p = 0.067) and 0.323 in the naming task (p = 0.042). This showed that there was a correlation between the indices and the age at which the child started to speak. Therefore, the later that speech development began, the lower the PCC and the higher the PDI were. It is important to stress that the p values were very close to 0.05, thus indicating that in a larger sample, the p values could be < 0.05. If a signifi cance level of 0.10 were taken, these values would be signifi cant.
Difference between PCC and
Difference between PCC and
PDI among subjects with and PDI among subjects with and
without upper respiratory without upper respiratory
tract infection and otitis tract infection and otitis
history in the tests history in the tests
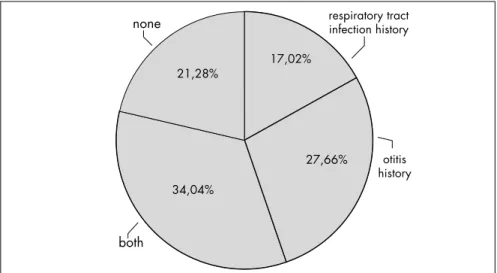
Figure 1 shows the subject distribution regarding histories of otitis and respiratory abnormalities.
and otitis history. Slight variation in the indi-ces analyzed was seen.
The mean PCC and PDI obtained in the imitation and naming tasks were calculated and compared with the presence and absence of respiratory abnormalities. Firstly, Levene’s variance comparison test was used to choose which would be the most appropriate version of Student’s t test. Thus, the values found in Levene’s comparison were: for the PCC in the imitation task, p = 0.136, and in the naming, p = 0.530. Then, the equal variance Student’s t test was applied with the following results: p = 0.016 and p = 0.005 respectively. For the PDI, the values obtained in Levene’s test were p = 0.032 in the imitation task and p = 0.018 in the naming task; the unequal variance Stu-dent’s t test was also applied with the following results: p = 0.014 and p = 0.008, respectively. Thus, Student’s t test showed that there were differences in the mean performance of the groups with and without upper respiratory tract infections, in relation to both the PDI and the PCC, in both tasks.
The same kind of analysis was performed for the history of otitis media. For the PCC, Levene’s test gave p = 0.493 for imitation and p = 0.594 for naming, and for the PDI, this test gave p = 0.600 for imitation and p = 0.734 for naming. Thus, the equal variance Student’s t test was applied and the values found were: for the PCC, p = 0.466 in the imitation task and p = 0.318 in the naming task, and for the PDI, p = 0.460 in the imitation task and p = 0.507 in the naming task. Taking a sig-nifi cance level of 0.05, there was no difference between the means, in either group.
Differences between mean
Differences between mean
PCC and PDI for subjects PCC and PDI for subjects
with and without audiological with and without audiological
abnormalities abnormalities
Table 3 indicates the mean PCC and PDI for subjects with audiological abnormalities.
The mean PCC and PDI in the naming and imitation tasks were compared between the subjects with and without audiological abnormalities. For the PCC, Levene’s test gave p = 0.122 for imitation and p = 0.200 for naming, and for the PDI, p = 0.256 for imitation and p = 0.209 for naming. Therefore the equal variance Student’s t test was applied and the following values were found: for the PCC, p = 0.831 in the imitation task and p = 0.936 in the naming task, and for the PDI, p = 0.900 in the imitation task and p = 0.967 in the naming task. Taking a signifi cance level of 0.05, there was no evidence of differences in the naming and imitation task performance
between the groups with and without audio-logical alteration.
Comparison between the mean
Comparison between the mean
PCC and PDI for subjects PCC and PDI for subjects
with and without problems of with and without problems of
being understood when they being understood when they
started to speak started to speak
Table 4 shows the mean PCC and the PDI according to the comprehension of the subjects’ speech when they started to speak.
Levene’s test gave the following values: for the PCC, p = 0.408 in the imitation task and p = 0.895 in the naming task, and for the PDI, p = 0.501 in the imitation task and p = 0.794 in the naming task. The equal vari-ance Student’s t test did not show any evidence of differences between the performances of the two groups: for the PCC, p = 0.621 in the imi-tation task and p = 0.871 in the naming task, and for the PDI, p = 0.920 in the imitation task and p = 0.959 in the naming task.
Difference between the mean
Difference between the mean
PCC and PDI for subjects PCC and PDI for subjects
with and without problems of with and without problems of
being understood at the time being understood at the time
of the assessment of the assessment
Table 5 shows the mean PCC and PDI for the subjects according to the comprehension of their speech at the time of the speech-language assessment and when they started to speak. Slight variation in the indices analyzed can be seen.
Levene’s test for the PCC gave p = 0.232 for imitation and p = 0.947 for naming, and for the PDI, p = 0.379 for imitation and p = 0.883 for naming. Therefore, the equal variance Student’s t test was applied, which did not show any evidence of differences between the subjects whose speech was and was not comprehended at the time of the assessment: for the PCC, p = 0.212 in the imitation task and p = 0.276 in the naming task, and for the PDI, p = 0.351 in the imitation task and p = 0.264 in the naming task.
17,02%
27,66% 34,04%
21,28%
respiratory tract infection history
otitis history
both none
Figure 1. Subject distribution according to otitis and history of respiratory tract abnormalities.
Table 1.Percentage of consonants correct and phonological density index descriptions according to the presence/absence of history of respiratory abnormalities
Was the subject understood? n Mean Standard deviation Maximum Minimum
Yes PCC imitation 35 84 11.6 97.2 45.8
PCC naming 35 83.5 12.3 97.7 40.2
PDI imitation 35 0.5 0.4 2 0.1
PDI naming 35 0.5 0.4 1.9 0.1
No PCC imitation 10 79.1 6.6 92.5 69.2
PCC naming 10 78.7 10.8 97.8 65.6
PDI imitation 10 0.6 0.2 1 0.1
PDI naming 10 0.6 0.3 1 0.1
Total PCC imitation 45 82.9 10.8 97.2 45.8
PCC naming 45 82.4 12.1 97.8 40.2
PDI imitation 45 0.5 0.4 2 0.1
PDI naming 45 0.5 0.4 1.9 0.1
DISCUSSION
Since phonological disorders may be identifi ed and treated before children reach four years old, this places a great responsibil-ity on the health professionals that deal with this population. It must also be stressed that, according to the DSM-IV (Diagnostic and Statistical Manual of Mental Disorders),16
there is a great possibility that children with phonological disorders will develop problems in learning to read and write. Therefore, early detection of such disorders would improve the chances of better aca-demic performance.
The results found from this study indi-cate that certain factors that correlate wi th phonological disorders are associated wi th increased severity of such disorders. A relation-ship could be seen between the PCC and the PDI obtained from the naming and imitation tasks of the Child Language Test (ABFW)15
and the following factors that correlate with phonological disorders: age when speech development began, history of otitis and up-per respiratory tract infections, audiometry data and understanding of the child’s speech at the beginning of speech development and at the time of the evaluation.
The subjects’ age at the time when the phonological disorder was diagnosed had a signifi cant correlation with the PCC and PDI, such that the greater the age was, the higher the PCC and the lower the PDI were. This indicates that younger children present a more severe picture and suggests that a certain degree of speech normalization takes place among children who are thus diagnosed later on.17,18 However, it also indicates that, without
speech-language intervention, children with phonological disorders do not attain adult speech patterns.
A signifi cant correlation was found between the PCC and PDI and the age at which the child started to speak, thus demonstrating that the later that the child started to speak, the lower the PCC and the higher the PDI were. This same fi nding was observed in another study,19 on the
PCC-R index, in which the results showed that children classifi ed as presenting delayed speech development had lower performances than did children with typical development.
The presence of otitis media and/or up-per respiratory tract infections was observed in 79% of the population. According to the data in the literature, this is a common fi nding and is probably indicative of a phonological disorder subtype.20,21
With regard to upper respiratory tract abnormalities, a statistically signifi cant
differ-Table 2.Percentage of consonants correct and phonological density index descriptions according to the presence/absence of otitis history
Otitis n Mean Standard deviation Maximum Minimum
Yes PCC imitation 30 82.2 11.3 97.2 45.8
PCC naming 30 82.2 12.74 97.7 40.2
PDI imitation 30 0.5 0.37 2 0.1
PDI naming 30 0.5 0.4 1.9 0.1
No PCC imitation 18 79.6 12.29 96.3 56.1
PCC naming 18 78.3 12.65 97.8 56.3
PDI imitation 18 0.58 0.38 1.6 0.1
PDI naming 18 0.58 0.36 1.2 0.1
Total PCC imitation 48 81.2 11.61 97.2 45.8
PCC naming 48 80.7 12.71 97.8 40.2
PDI imitation 48 0.52 0.37 2 0.1
PDI naming 48 0.53 0.38 1.9 0.1
PDI = phonological density index1; PCC = percentage of consonants correct.18
Table 4. Percentage of consonants correct and phonological density index descriptions according to the comprehension of the subject’s speech at the beginning of speech
Was the subject understood? n Mean Standard deviation Maximum Minimum
Yes PCC imitation 22 81.9 12.5 96.3 45.8
PCC naming 22 80.4 13.3 95.6 40.2
PDI imitation 22 0.5 0.5 2 0.1
PDI naming 22 0.5 0.4 1.9 0.1
No PCC imitation 14 79.9 9.3 92.5 57.9
PCC naming 14 81.1 12.2 97.8 56.6
PDI imitation 14 0.5 0.3 1.2 0.1
PDI naming 14 0.5 0.4 1.5 0.1
Total PCC imitation 36 81.1 11.3 96.3 45.8
PCC naming 36 80.7 12.7 97.8 40.2
PDI imitation 36 0.5 0.4 2 0.1
PDI naming 36 0.5 0.4 1.9 0.1
PDI = phonological density index1; PCC = percentage of consonants correct.18
Table 3. Percentage of consonants correct and phonological density index descriptions according to the audiological evaluation result
Audiological evaluation abnormality n Mean Standard deviation Maximum Minimum
Yes PCC imitation 3 82.9 2.2 84.1 80.4
PCC naming 3 82.4 4.8 87.8 78.4
PDI imitation 3 0.5 7.6 0.5 0.4
PDI naming 3 0.5 0.1 0.5 0.3
No PCC imitation 28 84.2 10.8 97.2 45.8
PCC naming 28 83 12.6 97.8 40.2
PDI imitation 28 0.4 0.36 2 0.1
PDI naming 28 47 0.39 1.9 0.1
Total PCC imitation 31 84.1 10.3 97.2 45.8
PCC naming 31 83 12 97.8 40.2
PDI imitation 31 0.4 0.3 2 0.1
PDI naming 31 0.5 0.4 1.9 0.1
PDI = phonological density index1; PCC = percentage of consonants correct.18
Table 5. Percentage of consonants correct and phonological density index descriptions according to the comprehension of the subject’s speech during the speech-language evaluation period
Was the subject understood? n Mean Standard deviation Maximum Minimum
Yes PCC imitation 35 84 11.6 97.2 45.8
PCC naming 35 83.5 12.3 97.7 40.2
PDI imitation 35 0.5 0.4 2 0.1
PDI naming 35 0.5 0.4 1.9 0.1
No PCC imitation 10 79.1 6.6 92.5 69.2
PCC naming 10 78.7 10.8 97.8 65.6
PDI imitation 10 0.6 0.2 1 0.1
PDI naming 10 0.6 0.3 1 0.1
Total PCC imitation 45 82.9 10.8 97.2 45.8
PCC naming 45 82.4 12.1 97.8 40.2
PDI imitation 45 0.5 0.4 2 0.1
PDI naming 45 0.5 0.4 1.9 0.1
ence was found between the groups with and without such histories, for both the PCC and the PDI. The descriptive analysis showed that there was better performance, as shown by the PCC and PDI, in the group without upper respiratory tract abnormalities.
No signifi cant differences were found in relation to previous otitis history between the mean PCC and PDI for the groups with and without such histories. Some authors22-26 did
not fi nd any direct relationship between such abnormalities and phonological performance or the severity of the phonological disorder. In the present study, the descriptive analysis showed that children with a previous history of otitis presented lower PCC and PDI, thus indicating the presence of more phonological disorders in those children.
A study using the PCC-R19 severity index
revealed that English-speaking children classi-fi ed as presenting delayed speech development were on average 15% behind children with typical development.
In a previous study,27 the PDI was used
to investigate the severity of phonological dis-orders among children with histories of otitis media or upper respiratory tract infections. The analysis indicated that the mean PCC in the phonology tasks of the Child Language Test (ABFW)15 did not present signifi cant
dif-ferences between the groups with and without histories of otitis and/or upper respiratory tract infections.
No statistically signifi cant differences in PCC and PDI values were found between subjects with and without abnormalities in the audiological evaluation at the time when their phonological disorder was diagnosed. This result was expected, since the otitis episodes occur most frequently during the fi rst two years of life, and the mean age of the subjects in the present study was six years and fi ve months. Therefore, the time when the greater disorders are found in audiological evaluations had already passed.
There was no statistically signifi cant dif-ference with regard to comprehension or lack of comprehension of the child’s speech by his family at the time the child started to speak or at the time of the evaluation, i.e. no difference in the PCC and PDI between children who were or were not understood. Despite this, the descriptive analysis indicated that chil-dren who were not understood at the time of their diagnosis had a lower PCC and a higher PDI than did those who were understood. This shows that the segmental features that are added to the supra-segmental features of prosody and voice contribute towards a certain degree of speech unintelligibility perceived by the listener, as stated by some authors.1
The present study corroborates the fi nd-ing from other studies3,22,28-32 that children
with several otitis and upper respiratory tract infection episodes show phonological disorders characterized by different degrees of speech
un-intelligibility. Early intervention in cases in which phonological disorders are perceived speeds the normalization of the phonological system and decreases the harm caused by such disorders.
The results from the present study corroborate the opinion expressed in other studies22,28 that further studies on the causal
factors associated with phonological disor-ders are needed.
CONCLUSION
Certain factors studied, which correlate with phonological disorders, showed associa-tions with the severity indices. The greater the age at the time of the assessment was, the higher the PCC and the lower the PDI were. On the other hand, the later that speech development began, the lower the PCC and the higher the PDI were. Also, the severity indices differed be-tween the groups of subjects with and without histories of upper respiratory tract infections. The other factors studied did not show any associations with the severity indices.
AUTHOR INFORMATION
Haydée Fiszbein Wertzner, MD, PhD.Associate professor in theDepartment of Physiotherapy, Language-Speech-Hear-ing Sciences and Occupational Therapy, and Coordinator of the Phonology Laboratory, Faculdade de Medicina da Universidade de São Paulo (FMUSP), São Paulo, Brazil. Luciana Amaro, MSc.Speech andLanguage Pathologist in
the School of Philosophy, Literacy and Human Sciences, Universidade de São Paulo (USP), São Paulo, Brazil. Daniela Evaristo dos Santos, MSc.Speech andLanguage
Pathologist and doctoral student in Semiotics and General Lin-guistics, School of Philosophy, Literacy and Human Sciences, Universidade de São Paulo (USP), São Paulo, Brazil.
Address for correspondence:
Haydée Fiszbein Wertzner
Rua Albuquerque Lins, 928 — Apto. 71 — Higienópolis São Paulo (SP) — Brasil — CEP 01230-000 Tel. (+55 11) 3825-9311
E-mail: [email protected]
Work presented at the Congress of the International Associa-tion of Logopedics and Phoniatrics (IALP), Brisbane, Australia, from August 29 to September 2, 2004.
Copyright © 2007, Associação Paulista de Medicina
RESUMO
Desempenho fonológico medido por índices de gravidade de fala em relação aos fatores correlatos
CONTEXTO E OBJETIVO: Alguns fatores parecem infl uenciar a gravidade dos distúrbios de fala em crianças com transtorno fonológico. O objetivo foi comparar índices de gravidade e fatores correlatos.
DESENHO E LOCAL:Observacional, analítico, transversal. Curso de Fonoaudiologia, Universidade de São Paulo.
MÉTODO: Cinqüenta crianças com transtorno fonológico, entre 4 e 11 anos. Calcularam-se os índices nos testes de fonologia e correlacionaram-nos com dados de anamnese e audiometria. O teste t de Student e a correlação de Spearman compararam a Porcentagem de Consoantes Corretas (PCC) e a Densidade de Processos Fonológicos (DPF) em crianças com e sem otite e história de infecções de vias aéreas superiores, alteração de audiometria, se eram ou não compreendidas na época da avaliação e quando começaram a falar e a idade em que começaram a falar e na avaliação.
RESULTADOS:Quanto mais velha a criança na avaliação, maior a PCC (correlação de Spearman: 0,468, imitação; 0,431, nomeação) e menor a DPF (0,459, imitação; 0,431, nomeação); quanto mais tarde a criança começou a falar, menor a PCC (imitação p = 0,064; nomeação p = 0,050) e maior a DPF (imita-ção p = 0,067; nomea(imita-ção p = 0,042). Observaram-se diferenças nas crianças com e sem infecções de vias aéreas (PCC: imitação: p = 0,016; nomeação: p = 0,005; DPF: imitação: p = 0,014 e nomeação: p = 0,008). Não houve diferença quanto à otite, compreensão na avaliação e audiometria.
CONCLUSÃO: Crianças com história de infecções de vias aéreas e que começaram a falar mais tarde apresentaram maior comprometimento de índices de gravidade.
PALAVRAS-CHAVE: Diagnóstico. Transtornos do desenvolvimento da linguagem. Infecções respiratórias. Otite. Índice de gravidade de doença.
1. Shriberg LD, Kwiatkowski J. Phonological disorders III: a procedure for assessing severity of involvement. J Speech Hear Disord. 1982;47(3):256-70.
2. Miccio A, Yont K, Vernon-Feagans L. Effects of otitis media on phonological development: infancy to age 3. ASHA Convention Abstract Archive. Available from: http://search.asha.org/db/ convention.html?col=conv&tb=Paper&trackingid=60780&c harset=iso-8859-1. Accessed in 2007 (Sep 20).
3. Shriberg LD. Four new speech and prosody-voice measures for genetics research and other studies in developmental phonologi-cal disorders. J Speech Hear Res. 1993;36(1):105-40. 4. Abraham SS, Wallace IF, Gravel JS. Early otitis media and
phonological development at age 2 years. Laryngoscope. 1996;106(6):727-32.
5. Mody M, Schwartz RG, Gravel JS, Ruben RJ. Speech perception and verbal memory in children with and without histories of otitis media. J Speech Lang Hear Res. 1999;42:(5):1069-79. 6. Pereira LD, Schochat E. Processamento auditivo central - manual
de avaliação. São Paulo: Lovise; 1997.
7. Gravel JS, Wallace IF. Listening and language at 4 years of age: effects of early otitis media. J Speech Hear Res. 1992;35(3):588-95. 8. Shriberg LD. Four new speech and prosody-voice measures for
genetics research and other studies in developmental phonologi-cal disorders. J Speech Hear Res. 1993;36(1):105-40. 9. Edwards ML. In support of phonological processes. Lang Speech
Hear Serv Sch. 1992;23:233-40 [abstract]. Available from: http://lshss.asha.org/cgi/content/abstract/23/3/233. Accessed in 2007 (Sep 20).
10. Ingram D. Phonological disability in children. London: Edward Arnold; 1976.
11. Wertzner HF. O distúrbio fonológico em crianças falantes do português: descrição e medidas de severidade. [Phonological disorders in Brazilian children : characteristics (description) and severity measures] [thesis]. São Paulo: Faculdade de Medicina da Universidade de São Paulo São Paulo; 2002.
12. Wertzner HF, Herrero SF, Ideriha PN, Pires SCF. Classifi cação do distúrbio fonológico por meio de duas medidas de análise: porcentagem de consoantes corretas (PCC) e índice de ocor-rência dos processos (PDI). [Phonological impairment assess-ment through the use of two measureassess-ments: percent of correct consonants (PCC) and process density index (PDI)]. Pró-Fono Revista de Atualização Científi ca. 2001;13(1):90-7.
13. Wertzner HF, Ramos ACO, Amaro L. Índices fonológicos aplicados ao desenvolvimento fonológico típico e ao transtorno fonológico. Rev Soc Bras Fonoaudiol. 2004;9(4):199-204. 14. Wertzner HF, Ortigoso FT, Amaro L. Análise comparativa
do índice PCC em sujeitos com transtorno fonológico não submetidos à intervenção fonoaudiológica. Temas Desenvolv. 2005;14(80):33-9.
15. Wertzner HF. Fonologia. In: Andrade CRF, Befi -Lopes DM, Fernandes FDM, Wertzner HF, editors. ABFW: teste de lin-guagem infantil nas áreas de fonologia, vocabulário, fl uência e pragmática. Carapicuíba: Pró-Fono; 2000. p. 5-40. 16. DSM-IV: Phonological disorder. Available from: http://www.
behavenet.com/capsules/disorders/phondis.htm Accessed in 2007 (Oct 15).
17. Gruber FA. Probability estimates and paths to consonant nor-malization in children with speech delay. J Speech Lang Hear Res. 1999;42(2):448-59.
18. Gruber FA. Variability and sequential order of consonant nor-malization in children with speech delay. J Speech Lang Hear Res. 1999;42(2):460-72.
19. Shriberg LD, Austin D, Lewis BA, McSweeny JL, Wilson DL. The percentage of consonants correct (PCC) metric: extensions and reliability data. J Speech Lang Hear Res. 1997;40(4):708-22.
20. Roberts JE, Burchinal MR, Davis BP, Collier AM, Henderson FW. Otitis media in early childhood and later language. J Speech Hear Res. 1991;34(5):1158-68.
21. Gordon-Brannan M. Assessing intelligibility: children’s expressive phonologies. Topics in Language Disorders. 1994;14(2):17-25.
22. Shriberg LD, Flipsen P Jr, Thielke H, et al. Risk for speech disorder associated with early recurrent otitis media with effusion: two retrospective studies. J Speech Lang Hear Res. 2000;43(1):79-99.
23. Churchill JD, Hodson BW, Jones BW, Novak RE. Phonological systems of speech-disordered clients with positive/negative histo-ries of otitis media. Lang Speech Hear Serv Sch. 1988;19:100-107 [abstract]. Available from: http://lshss.asha.org/cgi/content/ abstract/19/1/100. Accessed in 2007 (Sep 20).
24. Shriberg LD, Kwiatkowski J. Developmental phono-logical disorders I: A clinical profi le. J Speech Hear Res. 1994;37(5):1100-26.
25. Harsten G, Nettelbladt U, Schalén L, Kalm O, Prellner K. Language development in children with recurrent acute otitis media during the fi rst three years of life. Follow-up study from birth to seven years of age. J Laryngol Otol. 1993;107(5):407-12.
26. Pagel-Paden E. Otitis media and disordered phonologies: some concerns and cautions. Topics in Language Disorders. 1994;14(2):72-83. Available from: http://eric.ed.gov/ERIC-WebPortal/Home.portal?_nfpb=true&eric_viewStyle=list&E RICExtSearch_SearchValue0=Otitis+media+and+disordered+ phonologies&searchtype=basic&ERICExtSearch_SearchType_ 0=ti&eric_submitNtriever=true&pageSize=10&eric_displayN triever=false&eric_displayStartCount=1&_pageLabel=Record Details&objectId=0900019b800dc13d&accno=EJ479400&_ nfl s=false. Accessed in 2007 (Sep 20).
27. Wertzner HF, Rosal CAR, Pagan LO. Ocorrência de otite média e infecções de vias aéreas superiores em crianças com distúrbio fonológico. Rev Soc Bras Fonoaudiol. 2002;7(1):31-7. 28. Wertzner HF, Oliveira MMF. Existem semelhanças entre os
sujeitos com distúrbio fonológico? Pró-Fono Revista de Atual-ização Científi ca. 2002;14(2):143-52.
29. Shriberg LD, Kwiatkowski J. Phonological disorders I: a diagnostic classification system. J Speech Hear Disord. 1982;47(3):226-41.
30. Shriberg LD, Kwiatkowski J, Best S, Hengst J, Terselic-Weber B. Characteristics of children with phonologic disorders of unknown origin. J Speech Hear Disord. 1986;51(2):140-61. 31. Kwiatkowsky J, Shriberg LD. Intelligibility assessment in
developmental phonological disorders: accuracy of caregiver gloss. J Speech Hear Res. 1992;35(5):1095-104.
32. Weston AD, Shriberg LD. Contextual and linguistic correlates of intelligibility in children with developmental phonological disorders. J Speech Hear Res. 1992;35(6):1316-32.
Sources of funding: Fundação de Amparo à Pesquisa do Estado de São Paulo (Fapesp), grants numbers 00/09220-3, 03/00159-8 and 00/00197-9
Confl icts of interest: Not declared Date of fi rst submission: July 11, 2005 Last received: November 5, 2007 Accepted: November 7, 2007