ACOUSTIC ANALYSIS OF CHILDREN’S VOICES:
PHONATORY DEVIATION DIAGRAM CONTRIBUTIONS
Análise acústica de vozes infantis:
contribuições do diagrama de desvio fonatório
Leonardo Wanderley Lopes(1), Ivonaldo Leidson Barbosa Lima(2), Elma Heitmann Mares Azevedo(1),
Maria Fabiana Bonfim de Lima Silva (1), Priscila Oliveira Costa Silva(1)
(1) Departamento de Fonoaudiologia da Universidade Federal
da Paraíba – UFPB, João Pessoa, Paraíba, Brasil.
(2) Universidade Federal da Paraíba – UFPB, João Pessoa,
Paraíba, Brasil.
Conlict of interest: non-existent
assessment encompassing perceptual, acoustic, aerodynamic, and laryngological measures, as well as a self-reported evaluation, in order to map and establish correlations between most of the voice characteristics for an overview of the vocal status and to detect the true cause and impact of an
individual’s dysphonia 5-7.
Acoustic analysis is a routine procedure in voice evaluation to characterize the vocal quality, assist in diferential diagnosis, document and monitor the voice parameters, and assess the outcomes of the treatment provided to the patient with a voice
disorder8. Acoustic analysis employs
computer-based techniques to measure the properties of the acoustic signal—whether from a vowel or connected speech—providing more objective information regarding the voice signal compared to the auditory-perceptual analysis, as it produces quantitative data in the voice assessment process9-13.
INTRODUCTION
One of the key diiculties in evaluating the voice of children is the very deinition of what could be considered abnormal in that age group, since insta
-bility, strain, and breathiness are expected manifes
-tations in the vocal production of children due to their neuromuscular immaturity, the rudimentary structure of the larynx, and the anatomy of the vocal tract 1-4.
An efective evaluation of the voice of children must take into consideration the fact that voice is a multidimensional trait, which requires an
ABSTRACT
Purpose: to analyze the discriminatory power of the phonatory deviation diagram in assessing
the predominant voice and intensity of vocal disorders in children. Methods: sustained vowel /ε/
recordings were obtained from 93 children. The intensity of vocal deviation and quality were analyzed using a visual analog scale. Diagram was used for acoustic analysis, combined with the evaluation of vocal signs distribution according to area, quadrant, form, and density. We carried out the proportions equality test and the chi-square test (x2) to compare the variables, and the Spearman correlation test
to correlate the acoustic and auditory perception measures. Results: a correlation between quadrant
classiication and vocal deviation intensity was observed for all parameters analyzed. Diferences statistically signiicant were detected among children with roughness, breathiness, strain, and instability, with regard to area, quadrant, and form. When considering the distribution of voices in the quadrants, no diference statistically signiicant was observed between the children with and without vocal deviation and voice quality for any parameter analyzed. Conclusion: phonatory deviation
diagram was able to diferentiate predominant vocal quality through quadrant distribution, although it did not discriminate between the healthy and altered voices of children.
attended a school ailiated with a federal educa -tional institu-tional.
Children were excluded if they had any neuro
-logical disorder, cognitive impairment, upper or lower airway pathology at the time of data collection, or were unable to perform the elicited speech task.
Prior to the collection of data, the location of the study was visited with the purpose of selecting a quiet environment with ambient noise of less than 50dB SPL. On that occasion, the school principal was informed of the research procedures and goals and authorized the study. The informed consent papers were subsequently forwarded to be completed by the parents of the children included in
the study.
After the signed informed consent forms were returned, the voice recordings were conducted at times previously scheduled with the school super
-visor. The teachers referred the children individually to the recording environment during the irst morning and afternoon classes.
The recording sessions lasted 5 min on average. The production of the vowel /ε/ was elicited to be sustained to maximum phonation time. The samples were recorded onto an HP notebook through a Logitech microphone headset and using the PRAAT software version 5.1.44 with a sampling rate of 44,100 Hz.
The voices were edited using the Sound Forge software version 10.0. The initial two seconds and the inal one second of the vowel phonation were
edited out due to the greater irregularity present
in those segments, while a minimum length of three seconds was maintained for each phonation sample. Subsequently, the audio was normalized
using the “normalize” function of Sound Forge in the peak level mode in order to standardize audio output between -6 dB and 6 dB.
The auditory-perceptual analysis of voice was performed using a visual analog scale (VAS) with a 0 to 100 mm line. The closer to “0” (zero) the markings, the lower the grade of voice deviance; the closer to “100”, the greater the voice deviance. This rating was done by consensus among three speech-language pathologists specialized in voice, with more than 10 years’ experience in auditory-perceptual evaluation of voice. The following attri
-butes were assessed: overall severity (grade) of voice deviance (GG); grade of roughness (GR); grade of breathiness (GS); grade of strain (GT), and grade of instability (GI).
The perceptual evaluation session was conducted in a quiet environment. First, the judges were instructed that voices should be considered healthy when socially acceptable for children, produced naturally, without efort, noise, or instability, Multiple studies1,9,14,15 have sought to determine
the relationship between the acoustic characteristics of the voice signal and the perceived voice quality. It is increasingly important to establish the extent of the correlation between those two assessments, to which extent acoustic measures are capable of distinguishing normal from deviant voices, and even the discriminating power between diferent grades of voice disorder.
Voice disorders tend to perturb the sound signal in diferent ways, combining a variety of types of pertur
-bation and noise. In view of this, some studies8-12
have indicated that a voice assessment should use a combination of several acoustic measures of perturbation and noise, so that each individual utterance is quantiied by a set of attributes.
The phonatory deviation diagram (PDD)16,
originally termed “hoarseness diagram”12, is a
two-dimensional graph that enables the analysis of the voice signal from combined measures of period
-icity (jitter, shimmer, and coeicient of correlation) and noise (glottal-to-noise excitation ratio – GNE). Studies on the utilization of the PDD in voice evalu -ation10,12,17 have shown that the diagram is efective
in analyzing the regularity of the sound signal and the additive noise component, thus providing infor
-mation on the characteristics of the voice production of healthy and dysphonic individuals.
To date, no studies have used the PDD in the evaluation of children’s voices, especially with the purpose of establishing relationships between the auditory-perceptual evaluation and the PDD-based analysis. An investigation into that relationship could determine whether the PDD could be a useful tool for the evaluation of children’s voices—particularly with a view to implementing screening programs for schoolchildren, with larger populations, requiring expedient and efective methods to identify individuals requiring further evaluation, such as laryngeal examination.
In this setting, the aim of the present study was to analyze the discriminating power of the PDD in the assessment of the predominant type of voice and the severity of voice deviance in children.
METHODS
The present descriptive, quantitative cross-sectional study was analyzed and approved by the Human Research Ethics Committee of our university hospital under protocol no. 775/10. This study was developed between March–October 2012.
Finally, a correspondence was established between the numerical scale (AS) and the visual analog scale7,18, with grade 1 (0–35.5 mm) repre
-senting healthy voices; grade 2 (35.6–50.5 mm) corresponding to mild deviance; grade 3 (50.6–90.5 mm), moderate deviance, and grade 4 (90.6–100 mm) indicating severe deviance. The same procedure was repeated for GR, GS, GT, and GI, considering that the healthy production or normal variability of voice quality encompasses, among other aspects, the vocal manifestations expected for the individual’s age group.
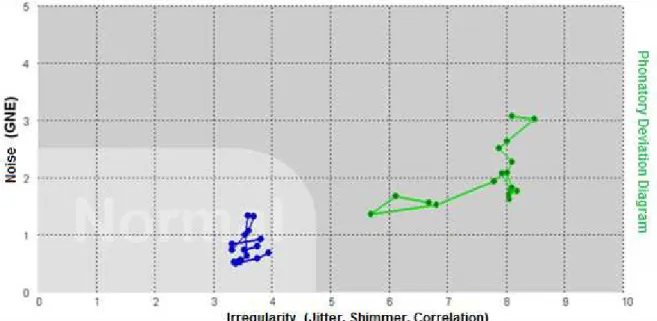
The acoustic analysis was done on the VoxMetria software version 4.5h in the vocal quality module. The PDD was employed in this evaluation to analyze the distribution of the voice signals according to area, quadrant, shape, and density.
The PDD is used for a combined analysis of parameters of perturbation and noise in a voice signal, based on measures of jitter, shimmer, coei
-cient of correlation, and GNE 12.
With regard to the area of the diagram, the software itself indicates whether the voice signal is within the limits or outside of the area of normality,
as illustrated in Figure 1.
and always taking into account the characteristic patterns expected for children. The judges were also instructed to consider roughness as the presence of
vibrational irregularity; breathiness involved audible
escape of air during voice production; strain was the perception of vocal efort, and instability was the occurrence of luctuating voice quality, frequency and/or intensity during phonation. In addition, the judges were trained with “anchor” stimuli of children’s voices for reference of healthy and dysphonic phonations at varying degrees, as well as examples of predominantly rough, breathy, strained, and unstable voices.
Each phonation of a sustained vowel was presented three times through a loudspeaker at a comfortable sound intensity as self-reported by the raters. The judges then deined the presence or absence of voice deviance, the predominant voice type in the deviant voices (rough, breathy, strained, or unstable) and, inally, rated the severity of deviance (GG, GR, GS, GT, and GI).
By the end of the perceptual evaluation session, 10% of the samples were repeated randomly for an analysis of the reliability of the consensus assessment by the judges using Cohen’s Kappa coeicient. The value of Kappa was 0.80, indicating good agreement between raters.
a) vertical, when the distance between the points over the X-axis was shorter than that along the Y-axis (X<Y); b) horizontal, when the distance between the points along the X-axis was greater than that over the Y-axis (X>Y), and c) circular, when the distance between the points over the X-axis and Y-axis was approximately equal (X≅Y) 16. The same 10 cm ruler
used for density estimation was used over each
PDD printout.
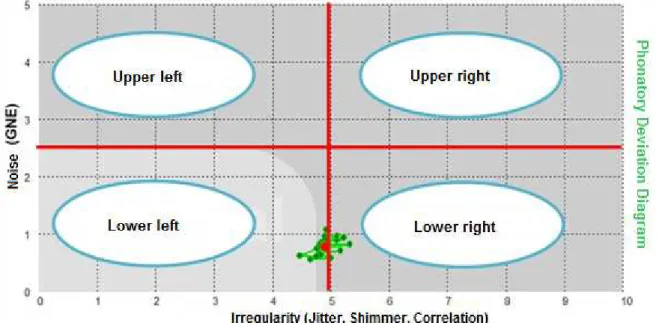
Finally, the PDD was divided into four equal quadrants16: lower left (1), lower right (2), upper right
(3), and upper left (4) (Figure 2). The points corresponding to the distribution of the
voice signals (Figure 1) were categorized for density as concentrated, when distributed within the space of one square, or spread, when the points extended across the space of more than one square in the
PDD 16. Density was classiied using a standard 10
cm ruler over the printout of each PDD generated by the software, which corresponded to the image of each voice signal analyzed, without previous knowledge of the severity of the voice deviance and predominant voice type.
With regard to shape, the points relative to the distribution of the voice signals were categorized as
Figure 2 – Division of the phonatory deviation diagram into quadrants
The statistical analysis was descriptive for all the variables investigated; the test of equality of proportions and the chi-squared (Χ2) test were used
to compare the analysis of the variables related to the auditory-perceptual measures (severity of voice deviance and predominant type of voice) and to the acoustic measures (area, density, shape, and quadrant of the PDD).
Further, an inferential statistical analysis was performed using Spearman’s correlation to test for correlations between the position in the PDD quadrant and the severity of voice deviance for the parameters GG, GR, GS, GT, and GI.
The level of signiicance was set at p ≤ 5% across analyses. The STATISTICA software version 6.0 was used in the analyses.
RESULTS
The evaluation of the overall severity of voice deviance (GG) showed that 74.1% (n = 69) of the children were mildly deviant and 14% (n = 13) were moderately deviant. Only 11.9% (n = 11) of the subjects were found to have a healthy voice. No child showed severe alterations in vocal quality.
The proportion of children with rough, breathy, strained, and unstable voices were statistically diferent in relation to the area, quadrant, and shape in the PDD (Table 4). We noted that 73.7% (n = 14) of the rough voices, 85% (n = 17) of the breathy voices, and 68.2% (n = 15) of the unstable voices fell outside of the area of normality in the PDD. However, most of the strained voices (71.4%, 15) were located within the area of normality in the
diagram.
Regarding the PDD quadrants, the rough voices were located in the lower right (52.7%, n = 10) and lower left (47.3%, n = 9) quadrants; the breathy voices were distributed in the lower right (35%, n = 7), lower left (30%, n = 6), and upper right (30%, n = 6) quadrants; the strained voices were positioned predominantly in the lower left quadrant (76.2%, n = 16), and the unstable voices in the lower right (50%, n = 11) and lower left (45.5%, n = 10) quadrants (Table 4).
The rough (47.3%, n = 9), strained (81%, n = 17) and unstable (77.3%, n = 17) voices were predominantly horizontal in shape, while the breathy voices were evenly distributed (40%, n = 8) between horizontal and circular shapes (Table 4).
Signiicant diferences were found between the rough and strained voices (p = 0.007), breathy and strained voices (p < 0.001), and strained and
unstable voices (p = 0.009) in their distribution in the PDD quadrants (Table 5).
strain (37.37%, n = 37), with means of 42.29 (SD = 14.58), 45.87 (SD = 11.14), 37.05 (SD = 19.55), and 38.88 (SD = 15.56), respectively.
Regarding the predominant voice type, instability (26.9%, n = 22) and strain (25.6%, n = 21) were the prevailing attributes in the children with voice deviation, followed by breathiness (24.3%, n = 20) and roughness (23.2%, n = 19).
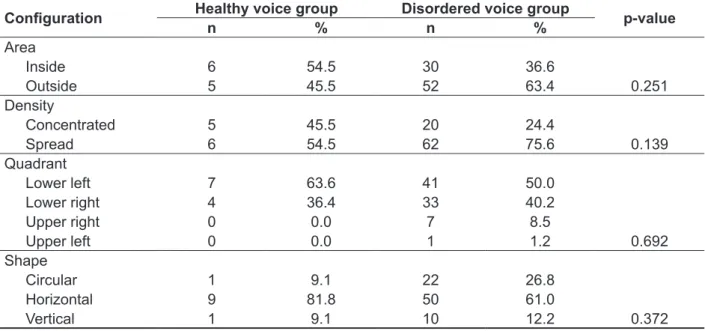
No statistically signiicant diferences were found between the groups of children with and without voice disorders with respect to area, density, quadrant, and shape in the PDD (Table 1).
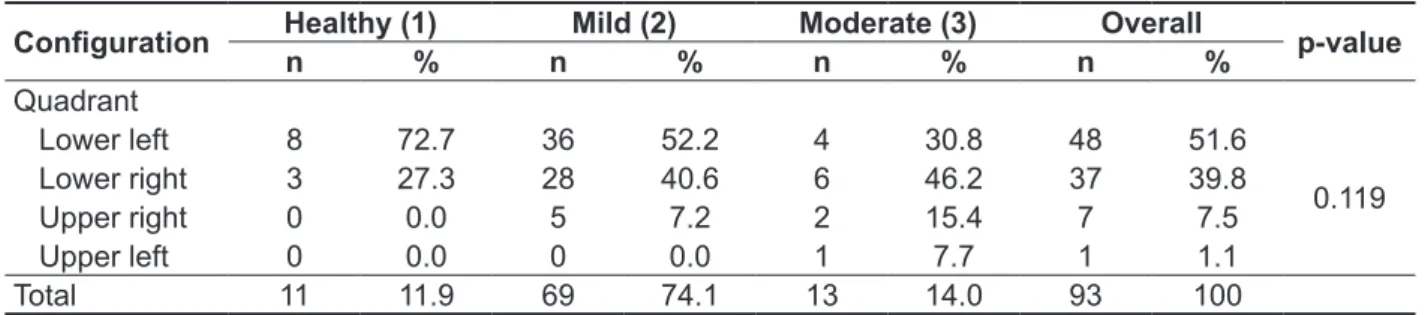
There was no diference in severity of voice deviance between the number of children with healthy voices and those with mild and moderate deviance considering their distribution in the PDD quadrants (Table 2).
There was a positive correlation between the classiication based on the PPD quadrants and the severity of voice deviance, both for the GG (p = 0.02) and the parameters GR (p < 0.001), GS
(p < 0.001), and GI (p = 0.008), while a negative
correlation was found to the GT (p = 0.05) (Table 3). Given that the quadrants were classiied according to the sequence (1) lower left; (2) lower right; (3) upper right, and (4) upper left, the greater the GG, GR, GS, and GI values, the more the voices were oriented toward the upper left quadrant. On the other hand, the greater the GT value, the more the voice signals were located toward the lower left quadrant.
Table 1 – Conigurations of area, density, quadrant, and shape in the phonatory deviation diagram for
the groups with healthy and disordered voices
Coniguration Healthy voice group Disordered voice group p-value
n % n %
Area
Inside 6 54.5 30 36.6
Outside 5 45.5 52 63.4 0.251 Density
Concentrated 5 45.5 20 24.4
Spread 6 54.5 62 75.6 0.139
Quadrant
Lower left 7 63.6 41 50.0
Lower right 4 36.4 33 40.2
Upper right 0 0.0 7 8.5
Upper left 0 0.0 1 1.2 0.692
Shape
Circular 1 9.1 22 26.8
Horizontal 9 81.8 50 61.0
Vertical 1 9.1 10 12.2 0.372
Table 2 – Distribution of the severity of voice deviance in the phonatory deviation diagram quadrants
Coniguration Healthy (1) Mild (2) Moderate (3) Overall p-value
n % n % n % n %
Quadrant
Lower left 8 72.7 36 52.2 4 30.8 48 51.6
0.119
Lower right 3 27.3 28 40.6 6 46.2 37 39.8 Upper right 0 0.0 5 7.2 2 15.4 7 7.5
Upper left 0 0.0 0 0.0 1 7.7 1 1.1
Total 11 11.9 69 74.1 13 14.0 93 100
* Signiicant values at p ≤ 0.05, test of equality of proportions Note: n = sample size; % = percentage relative to the sample
Table 3 – Correlation between the severity of voice deviance and the phonatory deviation diagram quadrants
Variables Quadrant in the PDD
Correlation p-value
Overall severity 0.26 0.02*
Grade of roughness 0.44 < 0.001*
Grade of breathiness 0.62 < 0.001*
Grade of strain -0.67 0.05*
Grade of instability 0.31 0.008*
* Signiicant values at p ≤ 0.05, Spearman correlation Note: PDD= phonatory deviation diagram
Table 4 – Conigurations of area, density, quadrant, and shape in the phonatory deviation diagram for
the predominant voice types
Coniguration Rough Breathy Strained Unstable p-value
n % n % n % n %
Area
0.001*
Inside 5 26.3 3 15.0 15 71.4 7 31.8
Outside 14 73.7 17 85.0 6 28.6 15 68.2 Density
0.909
Concentrated 4 21.0 4 20.0 6 28.6 6 27.3
Spread 15 79.0 16 80.0 15 71.4 16 72.7
Quadrant
Lower left 9 47.3 6 30.0 16 76.2 10 45.5
0.004*
Lower right 10 52.7 7 35.0 5 23.8 11 50.0 Upper right 0 0.0 6 30.0 0 0.0 1 4.5
Upper left 0 0.0 1 5.0 0 0.0 0 0.0
Shape
Circular 6 31.6 8 40.0 2 9.5 5 22.7
0.031*
Horizontal 9 47.3 8 40.0 17 81.0 17 77.3
Vertical 4 21.1 4 20.0 2 9.5 0 0.0
the most important voice characteristics to detect a voice disorder or laryngeal dysfunction22, it can be
inferred that the PDD is a good tool for monitoring the voice of children over the course of therapy.
A study16 of the PDD in the evaluation of adult
voices showed signiicant diferences between healthy and deviant voices, especially with respect to the area and quadrant of the PDD. In that study, the voices judged to be healthy or mildly deviant were located in the lower left quadrant; the voices with moderate deviation were distributed in the lower right and upper left quadrants, while the severely deviant voices were positioned in the upper left quadrant.
In the present study, however, the PDD conigu
-rations were not efective in discriminating between the groups of children with healthy and dysphonic voices. In addition, the location of the voices in the quadrants was not suiciently sensitive to diferentiate the severity of voice deviance. The reason for this may be the fact that instability, strain, and breathiness are expected characteristics in children’s voices, even those considered healthy.
The discriminating power of a measure is partic
-ularly important in the process of voice diagnosis, when the purpose is to detect or exclude an alter
-ation and/or disease. The fact that no diference was noted in the coniguration of the PDD between healthy and dysphonic voices whereas a correlation was found between the quadrants in the PDD and the degree of roughness, breathiness, strain, and instability, could indicate the usefulness of the PDD in the case of children’s voices to objectively monitor a child’s voice throughout the therapeutic process therapy—since, as roughness, breathiness, and instability decrease in the perceptual dimension, the points corresponding to the voice signals return to the lower left quadrant, which corresponds to the area of normality for irregularity and additive noise.
Another aspect that should be examined is that the PDD analyzes voice signals from a combination of measures, which could improve or worsen its accuracy in discriminating healthy and dysphonic voices23. A study comparing the diferent degrees of
voice deviance in children and the acoustic measures of jitter, shimmer and GNE separately showed GNE to be the only parameter that could efectively difer
-entiate the severity of voice deviance. Thus, GNE proved a robust measure to distinguish between healthy and disordered children’s voices, which enables it to be used in voice screening programs1.
Jitter and the shimmer are known to be of more utility in monitoring a voice disorder along a continuum, that is, in documenting and evaluating a voice therapy program; they are, therefore, instru
-mental in describing and quantifying the perceptual
DISCUSSION
The high prevalence of childhood dysphonia mandates that special attention be paid to the evaluation and diagnosis of children’s voices, with objective measures to enable an understanding of the severity of the voice deviance and how it manifests itself at diferent stages between the ages of 3 and 9 years1,19-21.
In the present study, the discriminating power of the PDD was investigated in the assessment of the predominant type of voice and the severity of voice deviance in children. When the groups of children with healthy and disordered voices were compared, there were no statistically signiicant diferences between the proportion of children in those two conditions in relation to area, density, quadrant, and shape in the PDD (Table 1). Moreover, no diferences were found between the proportion of children with healthy voices and those with mild and moderate disorders considering the PDD quadrant distribution (Table 2).
However, when Spearman’s correlation was calculated, a correlation was found between the classiication of quadrants in the PDD and the severity of voice deviance, both for the overall grade of severity (GG) and for the attributes of roughness, breathiness, strain, and instability (Table 3). The strength of correlation of 0.26 found between the GG and the PDD quadrants, albeit statistically signiicant (p = 0.02)—implying a relationship between those variables—represents a weak corre
-lation; therefore, further studies with larger samples may be warranted.
The correlation between the parameters of roughness, breathiness, strain, and instability was moderate, with values of 0.44 (p < 0.001), 0.62 (p <
0.001), -0.67 (p = 0.05), and 0.31 (p = 0.008), respec
-tively (Table 3). Since roughness, breathiness, and strain are universally accepted voice attributes and, more speciically, roughness and breathiness are
Table 5 – Comparison between the predominant voice types in relation to the quadrant of the phonatory deviation diagram
Types of voice p-value
Rough and breathy 0.335 Rough and strained 0.007* Rough and unstable 0.781 Breathy and strained < 0.001* Breathy and unstable 0.201
Strained and unstable 0.009*
mask the presence of roughness (aperiodicity) and breathiness (additive noise) in the production of voice, which explains the position of the predomi
-nantly strained voices within the area of normality. It is worth noting that the presence of phonatory strain can be a risk factor for voice disorders due to vocal apparatus hyperfunction and the unbalance in the physiological functioning of phonation. If such compensations persist, this could result in lesions to the vocal folds, such as nodules or mucosal thick
-ening of the free edges of the vocal folds, which are the most frequently diagnosed laryngeal lesions in the pediatric population3,27.
The rough voices were predominantly located in the lower right quadrant; the breathy voices were distributed proportionally in the lower right, lower left, and upper right quadrants; the strained voices were situated predominantly in the lower left quadrant, and the unstable voices, in the lower right and lower left quadrants (Table 4).
In the evaluation of adult voices, the voice signals were distributed among the PDD quadrants as follows: rough voices in the lower right quadrant, breathy voices in the upper right quadrant, and strained voices in the lower left quadrant16.
Thus, although the rough, breathy, and unstable voices of children were found signiicantly outside of the area of normality, only the rough and the strained voices were prominently located in a deinite quadrant—the lower right and lower left, respectively. It is noteworthy that, proportionally, only the breathy voices were found in the upper right quadrant.
When the parameter shape was analyzed, the rough, strained, and unstable voices were predomi
-nantly horizontal while the breathy voices were equally distributed between horizontal and circular shapes (Table 4). At this point, it should be reminded that the vertical axis of the PDD corresponds to the noise component and the horizontal axis represents the irregularity component. Therefore, it is expected that voices with a more marked component of aperi
-odicity (roughness and instability) will tend to exhibit a horizontal shape, while breathy voices show a greater additive noise component. In the study of adult voices, there was no signiicant relationship between the shape in the PDD and the predominant type of voice16.
In the Χ2 test comparing paired voice types,
diferences were noted between rough and strained,
breathy and strained, and strained and unstable
voices regarding the distribution in the quadrants of the PDD (Table 5). Thus, strained voices represented the only signiicantly diferent type of voice, which could be explained by the under
-lying physiological mechanism in this voice type, and vibrational characteristics of the vocal folds.
Thus, they are more often used in clinical practice and in descriptive research13,24,25.
It should be highlighted that a child’s vocal fold has not yet concluded the diferentiation process of the intermediate and deep layers of the lamina
propria24. Moreover, children are still developing
neuromuscular control; therefore, it is expected that measures of perturbation/irregularity will be more altered in children, especially in early childhood.
Regarding the predominant voice type, difer
-ences were found in the proportion of children with rough, breathy, strained, and unstable voices in relation to the area, quadrant, and shape in the PDD (Table 4). Most rough, breathy, and unstable voices were located outside of the normality area. By contrast, the majority of strained voices were distributed within the area of normality of the PDD.
A study16 of the application of the PDD in the
assessment of adult voices showed that 84.2% (n = 48) of the breathy voices, 68.3% (n=41) of the rough voices, and 52.2% of the strained voices were outside of the area of normality in the diagram.
The fact that the rough, breathy, and unstable voices were located outside of the normality area conirms that the PDD is sensitive to the presence of irregularity and noise in voice production and can be instrumental in the evaluation and follow-up of children’s voices.
The roughness in a child’s voice is quite frequently associated with laryngeal changes that, in turn, may be the result of allergic factors, person
-ality traits, inadequate voice compensations, among other causes26.
Another study6, conducted with 10-year-old
children, showed the occurrence of roughness and
breathiness around that age; personality, gender,
and the number of daily hours spent in group activ
-ities were the most prominent factors associated with the deviant voice attributes.
Changes in vocal quality are generally related to an enlargement in the vocal folds or alterations in glottal closure—the two leading determinants of voice disorders. Typically, incomplete glottal closure
due to alterations in the glottal proportions, as is
the case with a child’s larynx, can generate hyper
-function of the phonatory mechanism in an attempt to increase voice loudness, especially in group activities and in the presence of competing noise in
the environment19.
Strained voice production by children is consistent with a hyperfunctional voice pattern, which may be related to recurring lower airway infec
-tions, social determinants, or anatomic and behav
-ioral characteristics1,22. In addition, the presence of
increase in subglottic pressure and, consequently, hyperfunction of the laryngeal apparatus29.
Therefore, in the evaluation of the voice of children, the PDD seems to be a good instrument to monitor vocal function throughout the child’s devel
-opmental stages or over the course of voice therapy, especially considering the sensitivity of the PDD in detecting roughness and breathiness in the vocal production of children.
Given the multidimensional nature of voice, a variety of measures are required to adequately describe a voice disorder. However, the instru
-mental evaluation is still complementary, and a more comprehensive approach should be favored when assessing the severity of the voice deviance and the predominant vocal quality13.
CONCLUSIONS
The phonatory deviation diagram was able to distinguish the predominant vocal quality through the distribution of the voice signals in the quadrants, although it did not serve to discriminate between healthy and dysphonic children’s voices.
with greater subglottic pressure occurs, greater median compression between the vocal folds, and a less marked component of noise and aperiodicity compared to breathy and rough voices.
In a study28 developed with the purpose of evalu
-ating the eicacy of voice therapy in children with functional dysphonia, the auditory-perceptual evalu
-ation showed more substantial changes in overall severity, roughness, and breathiness, with less marked changes in the parameters of strain and instability. This inding may further support the notion that the parameters of strain and instability are more common in the phonation pattern of children and not always indicate voice pathology or laryngeal tissue
alterations.
Instability can be a relection of the rudimentary status of the larynx of children, which undergoes a series of changes until the adult stage, thus compromising the regularity of the voice signal28.
The phonatory strain found in the vocal production of children, on the other hand, may relect their efort to project the voice, since their resonance cavities are still developing. In addition, increased intensity in children’s voices is predominantly related to an
RESUMO
Objetivo: analisar o poder discriminatório do diagrama de desvio fonatório na avaliação do tipo de
voz predominante e da intensidade do desvio vocal em crianças. Métodos: coletou-se a vogal /ε/
sustentada de 93 crianças. A intensidade do desvio e a qualidade vocal foram analisadas por meio da escala analógico-visual. Utilizou-se o diagrama para a análise acústica, com avaliação da distribuição dos sinais vocais de acordo com a área, quadrante, forma e densidade. Realizou-se o teste de igual
-dade de proporções e o teste Qui-quadrado (x2) para comparar as variáveis, e o teste de Correlação
de Spearman para correlacionar as medidas acústicas e perceptivo-auditivas. Resultados: houve
correlação entre a classiicação de quadrantes e a intensidade do desvio vocal para todos os parâ
-metros analisados. Houve diferença estatisticamente signiicante entre a proporção de crianças com rugosidade, soprosidade, tensão e instabilidade em relação à área, ao quadrante e à forma. Não houve diferença estatisticamente signiicante entre a proporção de crianças com e sem desvio da qualidade vocal em relação a todos os parâmetros analisados, ao considerar a distribuição das vozes nos quadrantes. Conclusão: o diagrama de desvio fonatório foi capaz de diferenciar a qualidade
vocal predominante por meio da distribuição nos quadrantes, embora não tenha discriminado as vozes infantis saudáveis e alteradas.
14. Ma EPM, Yu EML. Multiparametric evaluation of dysphonic severity. J Voice. 2006;20:380-90. 15. Shrivastav R, Sapienza CM, Nandur V. Application of psychometry theory to the measurement of voice quality using rating scales. J Speech Lang Hear
Res. 2005;48:323-35.
16. Madazio G, Leão S, Behlau M. The Phonatory Deviation Diagram: A Novel Objective Measurement of Vocal Function. Folia Phoniatr Logop. 2011;63:305-11.
17. Olthof A, Mrugalla S, Laskawi R, Frölich M, Stuermer I, Kruse E et al. Assessment of irregular voices after total and laser surgical partial laryngectomy. Arch Otolaryngol Head Neck Surg.
2003;129:994-9.
18. Yamasaki R, Leão S, Madazio G, Padovani M, Azevedo R, Behlau M. Correspondência entre escala analógico visual e a escala numérica na avaliação perceptivo-auditiva de vozes. Anais do 16th Congresso Brasileiro de Fonoaudiologia; 2008 Sept 24-27; Campos do Jordão, Brasil. São Paulo: Sociedade Brasileira de Fonoaudiologia; 2008.
P.1080-4.
19. Niedzielska G. Acoustic analysis in the diagnosis of voice disorders in children. Int J Pediatr
Otorhinolaryngol. 2001;57:189-93.
20. Martins RHG, Ribeiro CBH, Mello BMZF, Branco A, Tavares EL. Dysphonia in children. J Voice. 2012;26:674.e17- e20.
21. Maturo S, Hill C, Bunting G, Ballif C, Maurer R, Hartnick C. Establishment of a normative pediatric acoustic database. Arch Otolaryngol Head Neck Surg. 2012;17:e1-e6.
22. Connor NP, Cohen SB, Theis SM, Thibeault SL, Heatley DG, Bless DM. Attitudes of children with dysphonia. J Voice. 2008;22:197-209.
23. Costa WCA. Análise dinâmica não linear de sinais de voz para detecção de patologias laríngeas [Tese]. Campina Grande: Universidade Federal de Campina Grande; 2012.
24. Araújo AS, Grellet M, Pereira JC. Standardization of acoustic measures of the normal voice. Braz j Otorhinolaryngol. 2002;68:540-4.
25. Sader RCM, Hanayama EM. Considerações Teóricas Sobre a Abordagem Acústica da Voz Infantil. Rev CEFAC. 2004;6(3): 312-8.
26. Jotz GP, Cervantes O, Settani FAP, Angelis EC. Acoustic measures for the detection of hoarseness in children. Int Arch Otorhinolaryngol. 2006;10:14-20. 27. Takeshita TK, Ricz LA, Isaac ML, Ricz H, Lima WA. Comportamento vocal de crianças em idade pré-escolar. Intl Arch Otorhinolaryngol.
2009;3:252-8.
REFERENCES
1. Lopes LW, Lima ILB, Almeida LNA, Cavalcante DP, Almeida AAF. Severity of voice disorders in children: correlations between perceptual and acoustic data. J Voice. 2012;26:819.e7- e12. 2. McAllister AM, Granqvist S, Sjölander P, Sundberg J. Child voice and noise: a pilot study of noise in day cares and the efects on 10 children’s voice quality according to perceptual evaluation. J Voice.
2009;23:587-93.
3. Tavares ELM, Brasolotto A, Santana MF, Padovan CA, Martins RHG. Epidemiological study of dysphonia in 4-12 year-old children. Braz J Otorhinolaryngol. 2011;77:736-46.
4. Tavares ELM, Labio RB, Martins RHG. Normative study of vocal acoustic parameters from children from 4 to 12 years of age without vocal symptoms: a pilot study. Braz j Otorhinolaryngol. 2010;76:485-90. 5. Carding P, Roulstone S, Northstone K, ALSPAC Study team. The prevalence of childhood dysphonia: a cross-sectional study. J Voice. 2006;20:623-30. 6. Sederholm E, McAllister A, Dalkvist J, Sundberg J. Aetiologic factors associated with hoarseness in ten-year-old children. Folia Phoniatr Logop. 1995;47:262-78.
7. Dejonckere PH, Bradley P, Clemente P, Cornut G, Crevier-Buchman L, Friedrich G et al. A basic protocol for functional assessment of voice pathology, especially for investigating the eicacy of (phonosurgical) treatments and evaluating nem assessment techniques. Eur Arch Otorhinolaryngol.
2001;258:77-82.
8. Nayak J, Bhat PS, Acharya R, Aithal UV.
Classiication and analysis of speech abnormalities.
ITBM-RBM. 2005;26:319-27.
9. Uloza V, Verikas A, Bacauskiene M, Gelzinis A, Pribuisiene R, Kaseta M et al. Categorizing normal and pathological voices: automated and perceptual categorization. J Voice. 2010;25:700-8.
10. Fröhlich M, Michaelis D, Strube HW, Kruse E. Acoustic voice analysis by means of the hoarseness. J Speech Lang Hear Res. 2000;43:706-20.
11. Godino-Llorente JI, Osma-Ruiz V, Sáenz-Lechón N, Vilda-Gómez P, Blanco-Velasco M, Cruz-Roldán F. The efectiveness of the glottal to noise excitation ratio for the screening of voice disorders. J Voice. 2010;24:47-56.
12. Michaelis D, Fröhlich M, Strube HW. Selection and combination of acoustic features for the description of pathologic voices. J Acoustic Soc Am. 1998;103:1628-40.
29. Van Houte E, Van Lierde K, Claeys S. Pathophysiology and treatment of muscle tension dysphonia: a review of the current knowledge. J Voice. 2011;25:202-7.
28. Trani M, Ghidini A, Bergamini G, Presuti L. Voice therapy in pediatric functional dysphonia: a prospective study. Int J Pediatr Otorhinolaryngol.
2007;71:379-84.
Received on: September 09, 2014 Accepted on: December 22, 2014
Mailing address:
Leonardo Wanderley Lopes
Departamento de Fonoaudiologia,
Centro de Ciências da Saúde Cidade Universitária – Campus I, Bairro Castelo Branco
João Pessoa – PB – Brasil CEP: 58051-900