Abnormal phenotypic distribution of regulatory and effector T cells
in octogenarian and nonagenarian women
WILSONDE MELO CRUVINEL1, DANILO MESQUITA JÚNIOR2, JÚLIO ANTÔNIO PEREIRA ARAÚJO2, KARINA CARVALHO SAMAZI3,
ESPER GEORGES KÁLLAS3, MAYSA SEABRA CENDOROGLO4, LUIS EDUARDO COELHO ANDRADE5* 1PhD – School of Medical, Pharmaceutical and Biomedical Sciences, Pontifícia Universidade Católica de Goiás, Goiás, GO, Brazil
2MSc – Division of Rheumatology, Universidade Federal de São Paulo (Unifesp), São Paulo, SP, Brazil 3PhD – Division of Clinical Immunology and Allergy, Universidade de São Paulo (USP), São Paulo, SP, Brazil 4PhD – Division of Geriatrics, Unifesp, São Paulo, SP, Brazil
5PhD – Division of Rheumatology, Unifesp, São Paulo, SP, Brazil
S
UMMARYStudy conducted at Division of Rheumatology, Universidade Federal de
São Paulo (Unifesp), São Paulo, SP, Brazil
Article received: 8/13/2014
Accepted for publication: 10/21/2014
*Correspondence:
Address: Rua Botucatu, 740, 3º andar Vila Clementino
São Paulo, SP – Brazil Postal code: 04023-900
55 11 5576-4239 luis.andrade@unifesp.br
http://dx.doi.org/10.1590/1806-9282.61.04.329
Financial support: Fapesp: 06/51934-0, 07/51349-2 and CNPq (#476356/2008-3)
Introduction: aging is associated with several immunologic changes. Regula-tory (Treg) and effector T cells are involved in the pathogenesis of infectious, neoplastic, and autoimmune diseases. Little is known about the effects of aging on the frequency and function of these T cell subpopulations.
Methods: peripheral blood mononuclear cells (PBMC) were obtained from 26 young (under 44 years old) and 18 elderly (above 80 years old) healthy women. T cell subpopulations were analyzed by flow cytometry.
Results: elderly individuals had lower frequency of several activated effector T cell phenotypes as compared with young individuals: CD3+CD4+CD25+ (3.82±1.93 versus 9.53±4.49; p<0.0001); CD3+CD4+CD25+CD127+ (2.39±1.19 versus 7.26±3.84;
p<0.0001); CD3+CD4+CD25+ (0.41±0.22 versus 1.86±0.85, p<0.0001); and
CD3+CD4+CD25highCD127+ (0.06±0.038 versus 0.94±0.64, p<0.0001). Treg
(CD3+CD4+CD25+CD127ØFoxp3+) presented lower frequency in elderly
individ-uals as compared to young adults (0.34±0.18 versus 0.76±0.48; p=0.0004) and its
frequency was inversely correlated with age in the whole group (r=-0.439; p=0.013).
The elderly group showed higher frequency of two undefined CD25ØFoxp3+
phe-notypes: CD3+CD4+CD25ØFoxp3+ (15.05±7.34 versus 1.65±1.71; p<0.0001) and
CD3+CD4+CD25ØCD127ØFoxp3+ (13.0±5.52 versus 3.51±2.87; p<0.0001). Conclusions: the altered proportion of different T cell subsets herein docu-mented in healthy elderly women may be relevant to the understanding of the immunologic behavior and disease susceptibility patterns observed in geriatric patients.
Keywords: T-lymphocytes, aging, regulators T-lymphocytes.
I
NTRODUCTIONAging is associated with decreased humoral immune re-sponse, shortened duration of protective immunity, cline in T cell diversity and thymus function, and de-creased ability in T cell response to novel antigens.1-3 As
a consequence, aging is associated with diminished
im-munity against microorganisms and malignant cells,4 as
well as tolerance breakdown and increased frequency of
autoimmune diseases.5 Naturally occurring regulatory T
cells (Treg) are key regulators in the control of immune
responses, with significant impact on autoimmunity, tu-mor immunity, infection, allergy and transplant toler-ance.6-9 Among other characteristic features, these cells
express the transcription factor Foxp3, high levels of
mem-brane CD25, and low levels of memmem-brane CD127.10-12
There have been some studies pointing to an increase in the proportion of CD25 regulatory T cells in the periph-eral blood of aged BALB/c13,14 and C57BL/6 mice15,16 as
well as in elderly people.17-21 Such imbalance might
other peculiarities of the immune system in this age group.4,5,19-23 In addition, increased frequency of the CD4
Foxp3 Treg phenotype has been shown in aged C57BL/624
and in elderly people.25 In contrast, more recent studies
have found normal CD4 Foxp3 Treg cell frequency in el-derly people.4,26,27
In face of the controversial literature on the frequen-cy of Treg cells in aged people, and considering the evolv-ing paradigm on Treg cell phenotypic characteriza-tion,28,29 we have studied the frequency of Treg cells based
on the evaluation of a stringent phenotypic profile (CD3+
CD4+CD25highCD127ØFoxp3) in healthy volunteer
wom-en over a wide age range. With the understanding that the immune function is ruled by the equilibrium among several cellular phenotypes, we concurrently studied the frequency of activated effector T cells, a major T cell phe-notype counteracted by Treg cells. We could not confirm previous reports of increased Treg cell frequency in el-derly individuals. Instead, we observed a decline in the frequency of T cells, expressing markers related with cell activation and a higher proportion of two yet undefined
Foxp3 CD25Ø phenotypes in elderly women.
M
ETHODSStudy population
Eighteen octogenarian and nonagenarian women were recruited from the cohort of healthy elderly individuals at the geriatric division at Universidade Federal de São Paulo, with ages between 80 and 93 (85±64.6 years old). The young adult group (<44 years old) comprised 26 healthy women with age between 19 and 44 years (29.23±6.63 years old), recruited among workers at the Medical School at Universidade Federal de São Paulo. All enrolled individ-uals were not receiving immunosuppressive medication and had no chronic infection, malignancy or cognitive impairment. In addition, there was no previous or cur-rent evidence of allergy or autoimmune diseases. Several of the elderly individuals did receive medication for arte-rial hypertension, diabetes mellitus, hypercholesterolemia or age-related heart diseases. Informed consent was ob-tained from all participants and the study was approved by the institution’s ethics committee.
Phenotypic evaluation of peripheral CD3 CD4 T lymphocytes
The phenotype of peripheral CD3+CD4 T cells was
ana-lyzed according to the expression of CD25, CD127 and Foxp3 in 44 healthy women, divided according to two age strata: young and elderly women. Peripheral blood mononuclear cells (PBMC) were isolated by density gra-dient centrifugation in Ficoll Paque™ Plus (GE
Health-care Life Science, Pittsburgh, PA) and cryopreserved in
90% fetal bovine serum (FBS) and 10% dimethyl
sulfox-ide in liquid nitrogen. For labeling with antibodies, cells were quickly defrosted at 37ºC, centrifuged and re-sus-pended on fresh RPMI medium with 10% FBS. Next cells were washed in phosphate buffer saline (PBS) and 0.5x10⁶ cells were incubated with FITC-labeled anti-CD127, APC-Cy3-labeled anti-CD3, PerCP-labeled anti-CD4, and PE-Cy7-labeled anti-CD25, according to the manufactur-er’s instructions (Becton Dickinson, San Jose, CA). After
30 minutes at 4ºC cells, were washed with Macs® buffer,
fixed and permeabilized with Foxp3 fixation/permeabi-lization buffer (eBioscience, San Diego, CA) and, then, processed for Foxp3 staining using Foxp3 staining kit and APC-labeled anti-Foxp3 (eBioscience, San Diego, CA), according to the manufacturer’s instructions. For establishment of background staining and threshold for genuine expression of each phenotypic marker, we used
the fluorescence minus one (FMO) method.30 Cells were
analyzed in a FACSCanto® flow cytometer (Becton
Dick-inson, San Jose, CA) and the obtained data were ana-lyzed using the FlowJo software (Tree Star Inc, Ashland, OR). Three hundred thousand events were acquired for each sample. Parameters were expressed as mean and standard error (SE). Cell frequency was expressed as the percent frequency of each subpopulation relative to to-tal CD3 cells.
Statistical analysis
Comparison of quantitative parameters between two groups was performed using Student’s t test. Linear re-gression analysis (Spearman or Pearson correlation test, depending on the distribution pattern of the variable) was performed to determine the relationship between age in years and the frequency of different cell phenotypes. Differences were considered significant if p-values were less than 0.05.
R
ESULTSThe frequency of activated effector T cells was lower in elderly subjects as compared with young individuals,
ei-ther when analyzing the CD3+CD4+CD25 phenotype
(3.82±1.93% versus 9.53±4.49%; p<0.0001), the CD3+
CD4+CD25+CD127 phenotype (2.39±1.19% versus
7.26±3.84%; p<0.0001), the CD3+CD4+CD25high
pheno-type (0.41±0.22% versus 1.86±0.85%; p<0.0001) and the
CD3+CD4+CD25highCD127 phenotype (0.06±0.038%
ver-sus 0.94±0.64%; p<0.0001) (Figure 1 A-D and Table 1). In
age (Table 1). Next, it was investigated whether the fre-quency of Treg cells, based on the expression of CD3, CD4, CD25, CD127, and Foxp3, was altered in elderly individ-uals (>80 years old) compared with young adults (<44 years old). In contrast to what we observed for effector T cells, there was an ambiguous representation of the sev-eral T cell phenotypes possibly associated with Treg func-tion. No significant difference between elderly and young women was found in the frequency of phenotypes
CD3+CD4+CD25 Foxp3 (1.51±0.95% versus 1.42±0.76%;
p=0.74) and CD3+CD4+ CD25+CD127ØFoxp3 (1.02±0.75%; versus 1.26±0.60%; p=0.26) (Table 1). However, the
CD3+CD4+CD25highFoxp3 and CD3+CD4+CD25highCD127Ø
Foxp3 phenotypes, occurred at a decreased frequency in elderly individuals as compared to young people (0,47±0,16%
versus 0,85±0,64%; p=0,014 and 0.34±0.18% versus
0.76±0.48%; p=0.004, respectively) (Figure 1E-F, Table 1). In addition, the percentage of this phenotypes
(CD3+CD4+CD25highFoxp3 and CD3+CD4+CD25high
CD127ØFoxp3) presented an inverse correlation with age
among the 26 young and 5 elderly individuals (r=-0.355 p=0.049 and r=-0.439 p=0.013, respectively) (Table 1).
Interestingly, there was a strikingly higher frequency
of two CD25Ø phenotypes in elderly people as compared
with the young group (Figure 2A-B, Table 1). The relative
frequency of the CD3+CD4+CD25ØFoxp3 phenotype was
15.05±7.34% in the elderly against 1.65±1.71% in the young group (p<0.0001), and the relative frequency of the
CD3+CD4+CD25ØCD127ØFoxp3 phenotype was
13.0±5.52% in the elderly group against 3.51±2.87% in the young adults (p<0.0001). Accordingly, there was a signif-icant correlation between the frequency of these two T cell phenotypes and age among the 44 young and
elder-ly women (r=0.71 and 0.74, respectiveelder-ly, p<0.0001) (Fig-ure 2C-D, Table 1).
D
ISCUSSIONThe frequency of four activated effector T cell phenotypes was significantly lower in elderly as compared with young women (Figure 1 A-D and Table 1). In addition, there was an inverse correlation between the frequency of these ac-tivated T lymphocytes and age (Table 1). Considering the evolving criteria for identification of Treg cells, we inves-tigated several alternative Treg cell-related phenotypes based on the expression of CD3, CD4, CD25, CD127, and Foxp3. We observed an ambiguous representation of the several T cell phenotypes possibly associated with Treg function. No significant difference between elderly and young women was found in the frequency of phenotypes
CD3+CD4+CD25+Foxp3 and CD3+CD4+CD25+
CD127ØFoxp3 (Table 1). However, the most stringent
Treg cell-related phenotypes CD3+CD4+CD25highFoxp3
and CD3+CD4+CD25highCD127ØFoxp3 occurred at
sig-nificantly lower frequency in elderly as compared to young individuals (Figure 1 E-F and Table 1). In addition, the percentage of these two phenotypes presented an inverse correlation with age (Table 1). None of the phenotypic approaches pointed to increased Treg cell frequency in elderly individuals. These findings suggest a possible de-crease in the production of Treg cells in elderly individu-als. Studies from 2005 to 2008 have found an increased frequency of circulating Treg cells in elderly people.13-15,17-21,31
The apparent discrepancy of the present findings and ear-lier studies in the literature may be related to the combi-nation of phenotypic markers used for definition of Treg cells. In fact, these results are more comparable with more
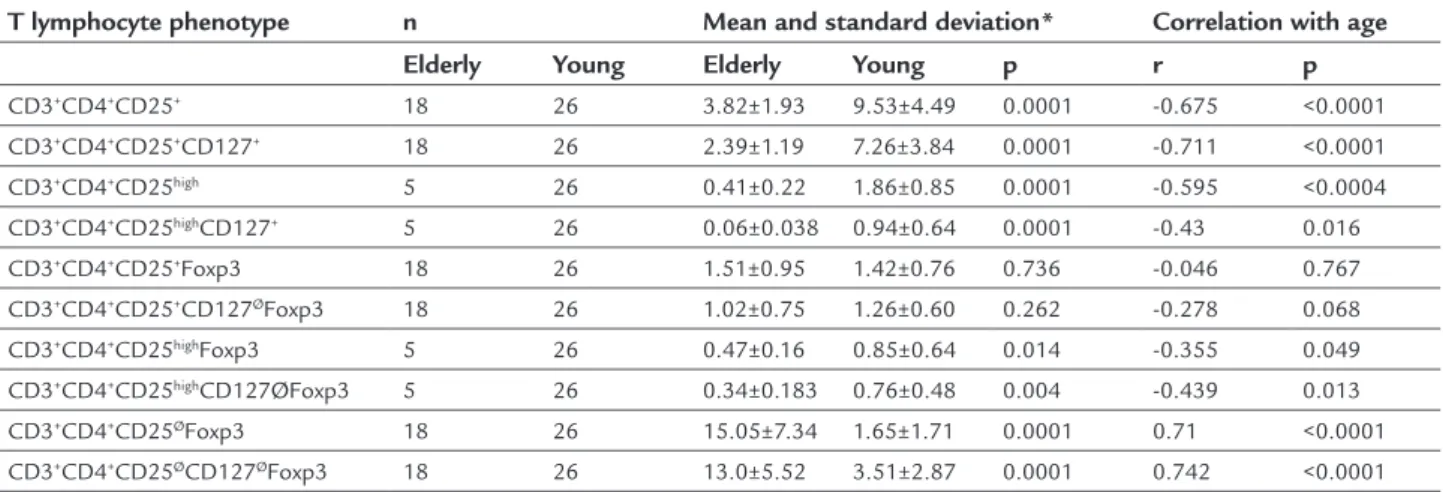
TABLE 1 Relative frequency of different CD3 CD4 T cell phenotypes in elderly and young healthy women.
T lymphocyte phenotype n Mean and standard deviation* Correlation with age
Elderly Young Elderly Young p r p
CD3+CD4+CD25+ 18 26 3.82±1.93 9.53±4.49 0.0001 -0.675 <0.0001
CD3+CD4+CD25+CD127+ 18 26 2.39±1.19 7.26±3.84 0.0001 -0.711 <0.0001
CD3+CD4+CD25high 5 26 0.41±0.22 1.86±0.85 0.0001 -0.595 <0.0004
CD3+CD4+CD25highCD127+ 5 26 0.06±0.038 0.94±0.64 0.0001 -0.43 0.016
CD3+CD4+CD25+Foxp3 18 26 1.51±0.95 1.42±0.76 0.736 -0.046 0.767
CD3+CD4+CD25+CD127ØFoxp3 18 26 1.02±0.75 1.26±0.60 0.262 -0.278 0.068
CD3+CD4+CD25highFoxp3 5 26 0.47±0.16 0.85±0.64 0.014 -0.355 0.049
CD3+CD4+CD25highCD127ØFoxp3 5 26 0.34±0.183 0.76±0.48 0.004 -0.439 0.013
CD3+CD4+CD25ØFoxp3 18 26 15.05±7.34 1.65±1.71 0.0001 0.71 <0.0001
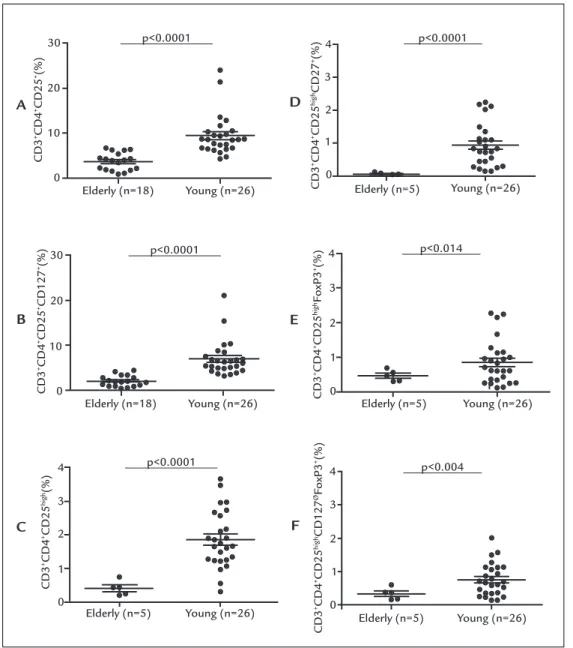
FIGURE 1 Relative frequency of activated effector T cell phenotypes CD3+CD4+CD25+ (A), CD3+CD4+CD25+CD127+ (B), CD3+CD4+CD25High (C),
and CD3+CD4+CD25HighCD127+ (D). Relative frequency of Treg cell phenotypesCD3+CD4+CD25HighFoxp3+ (E) and CD3+CD4+CD25HighCD127øFoxp3+
(F) in elderly (age >80 years) and young women (age <44 years). Sample size varied in some experiments, due to restriction in availability of enough material. Relative frequency expressed as a percentage of CD3+ cells. Horizontal lines represent the mean and standard deviation for each group.
recent studies that used phenotypic markers similar to these and showed no increase in Treg cell frequency in el-derly individuals.4,26 Other possible factors contributing
to discrepancy in the literature include peculiarities in subject selection and methodological aspects (e.g., frozen
versus fresh cells, cell handling protocols, and flow
cytom-etry parameters). In particular, it should be noted that the present study analyzed only females, and it has been shown previously that sexual hormones may influence
the frequency of Treg cells.32 The actual impact of the
modest magnitude of decrease in Treg cell frequency
ob-served in this series (average 0.69% to 0.29%) on tolerance maintenance remains to be determined. It should be no-ticed that such a decrease was observed in successful oc-togenarians and nonagenarians, and, therefore, should be regarded as a tendency along the normal aging pro-cess. However, this may lead to predisposition for sur-passing the threshold necessary for immune disequilib-rium in some individuals, favoring the appearance of autoantibodies and autoimmune diseases in susceptible individuals. Although B and T lymphocyte response to antigenic stimulus has been shown to decline in aged in-Elderly (n=18)
Elderly (n=18) 30
20
10
0
4
3
2
1
0
4
3
2
1
0
Elderly (n=5)
CD3
+CD4 +CD25 +(%)
CD3
+CD4 +CD25
high
CD27
+(%)
CD3
+CD4 +CD25
high
(%)
CD3
+CD4 +CD25
high
CD127
ØFoxP3 +(%)
CD3
+CD4 +CD25
high
FoxP3
+(%)
CD3
+CD4 +CD25 +CD127 +(%)
p<0.0001
p<0.0001
p<0.0001
p<0.0001
p<0.014
p<0.004 Young (n=26)
Young (n=26)
Young (n=26)
4
3
2
1
0 4
3
2
1
0 30
20
10
0
Elderly (n=5)
Elderly (n=5) Elderly (n=5)
Young (n=26)
Young (n=26) Young (n=26)
A D
B
C
E
dividuals, paradoxically there is an increase in the fre-quency of autoantibodies and organ-specific autoimmune
diseases in elderly people.33 This apparent incongruity
might be reconciled by the finding of a reduced frequen-cy and function of Treg cells. Therefore, further studies are granted to investigate whether the slight reduction in Treg frequency observed in this study is functionally
rel-evant to tolerance maintenance in elderly individuals. Interestingly, there was a strikingly higher frequency of two yet undefined CD4+CD25Ø phenotypes (CD3+CD4+
CD25ØFoxp3 and CD3+CD4+CD25ØCD127ØFoxp3) in
el-derly as compared with young women (Figure 2A-B, Table 1). Accordingly, there was a significant correlation between the frequency of these two T cell phenotypes and age (r=0.71 and 0.74, respectively, p<0.0001) (Figure 2C-D). This has not been reported previously in elderly individuals, possi-bly due to a lack of focus on these particular T cell subsets. However, in previous studies the authors and others have shown these cells to be increased in patients with active systemic lupus erythematosus.34,35 Bonelli et al. have shown
that CD3+CD4+CD25ØFoxp3 cells are able to suppress
ef-fector T cell proliferation, but not IFN-y production in vi-tro.36 In view of this, we hypothesize that these cells may
represent intermediate or incomplete phenotypes towards Treg or effector T cells. It is possible that the increased fre-quency of these incomplete phenotypes in elderly people would be a consequence of counteracting mechanisms in a senescent immune system.
In the present study, the authors demonstrated some interesting peculiarities in the frequency of effector and reg-ulatory T CD4 cells in the peripheral blood of healthy octo-genarians and nonaocto-genarians. These were characterized by a decrease in the frequency of activated effector T cell phe-notypes and of the T cell phenotype, most strictly associat-ed with Treg function (CD3+CD4+CD25highCD127ØFoxp3).
Interestingly, there was a strikingly increased frequency of two still undefined CD4+CD25Ø T cell subsets (CD3+CD4+
CD25ØFoxp3 and CD3+CD4+CD25ØCD127ØFoxp3). The
knowledge obtained about diverse T cell subsets in elder-ly people should be of practical relevance to the search for means of increasing the efficacy of vaccination, boosting immunity in cancer, and avoiding tolerance breakdown,
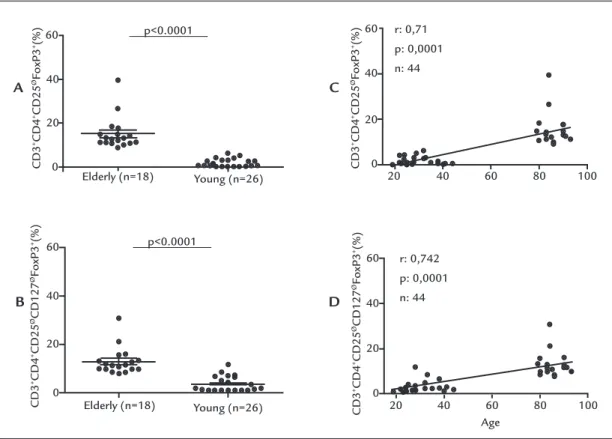
FIGURE 2 Relative frequency of CD25ø cell phenotypes CD3+CD4+CD25øFoxp3+ (A) and CD3+CD4+CD25øCD127øFoxp3+ (B) in 18 elderly (age
>80 years) and 26 young women (age <44 years). Correlation between age and the frequency of CD25ø cell phenotypes CD3+CD4+CD25øFoxp3+ (C)
and CD3+CD4+CD25øCD127øFoxp3+ (D). Horizontal lines represent the mean and standard deviation for each group. Relative frequency expressed
as a percentage of CD3+ cells.
CD3
+CD4 +CD25 ØCD127 ØFoxP3 +(%)
CD3
+CD4 +CD25 ØCD127 ØFoxP3 +(%)
CD3
+CD4 +CD25 ØFoxP3 +(%)
CD3
+CD4 +CD25 ØFoxP3 +(%)
p<0.0001 p<0.0001 60
60
60
60 40
40
40
40 20
20
20
20 0
0
0
20 40 60 80 100
0 Elderly (n=18)
Elderly (n=18)
Young (n=26)
Young (n=26)
C
D B
A
20 40 60 80 100
Age r: 0,742
therefore, delaying the development of immunodeficien-cy, cancer, and autoimmune inflammatory diseases, respec-tively, in aged people. The present results in healthy octo-genarian and nonaocto-genarian women bring important pre-liminary information to the understanding of the cellular immune system in healthy elderly subjects.
R
ESUMODistribuição fenotípica anormal das células T regulado-ras e efetoregulado-ras em mulheres octogenárias e nonagenárias
Introdução: o envelhecimento está associado a diversas alterações imunológicas. Células T reguladoras e efeto-ras estão envolvidas na patogênese de enfermidades in-fecciosas, neoplásicas e autoimunes. Pouco se sabe acer-ca dos efeitos da idade sobre a frequência e a função dessas populações celulares.
Métodos: células mononucleares do sangue periférico foram obtidas de participantes saudáveis (26 com ida-de inferior a 44 anos e 18 acima ida-de 80 anos). As subpo-pulações celulares foram analisadas por citometria de fluxo.
Resultados: o grupo constituído por idosas apresentou menor frequência de vários fenótipos de células T efetoras
ativadas em comparação com jovens: CD3+CD4+CD25+
(3,82±1,93 versus 9,53±4,49, p<0,0001); CD3+CD4+
CD25+CD127+ (2,39±1,19 versus 7,26±3,84, p<0,0001);
CD3+CD4+CD25high (0,41±0,22 versus 1,86±0,85, p<0,0001);
CD3+CD4+CD25highCD127+ (0,06±0,038 versus 0,94±0,64,
p<0,0001). As células T reguladoras CD3+CD4+CD25high
CD127ØFoxP3+ apresentaram menor frequência em
indi-víduos idosos em comparação com adultos jovens (0,34±0,18
versus 0,76±0,48, p=0,0004) e sua frequência foi
inversamen-te correlacionada com a idade em todo o grupo (r=-0,439; p=0,013). O grupo de idosas apresentou maior frequência
de dois fenótipos indefinidos (CD25ØFoxP3+), células
CD3+CD4+CD25ØFoxP3+ (15,05±7,34 versus 1,65±1,71,
p<0,0001) e células CD3+CD4+CD25ØCD127ØFoxP3+
(13,0±5,52 versus 3,51±2,87, p<0,0001).
Conclusão: as proporções alteradas de diferentes subpo-pulações de células T em idosas saudáveis contribuem para a compreensão dos padrões de comportamento e suscetibilidade a doenças imunológicas evidenciadas em pacientes geriátricos.
Palavras-chave: linfócitos T, envelhecimento, linfócitos T reguladores.
R
EFERENCES1. Steger MM, Maczek C, Berger P, Grubeck-Loebenstein B. Vaccination against tetanus in the elderly: do recommended vaccination strategies give sufficient protection. Lancet. 1996; 348(9029):762.
2. Weksler ME, Szabo P. The effect of age on the B-cell repertoire. J Clin Immunol. 2000; 20(4):240-9.
3. Naylor K, Li G, Vallejo AN, Lee W-W, Koetz K, Bryl E, et al. The influence of age on T cell generation and TCR diversity. J Immunol. 2005; 174(11):7446-52. 4. Hwang KA, Kim HR, Kang I. Aging and human CD4(+) regulatory T cells.
Mech Ageing Dev. 2009; 130(8):509-17.
5. Urbán L, Bessenyei B, Márka M, Semsei I. On the role of aging in the etiology of autoimmunity. Gerontology. 2002; 48(3):179-84.
6. Cools N, Ponsaerts P, Van Tendeloo VFI, Berneman ZN. Regulatory T cells and human disease. Clin Dev Immunol. 2007; 2007:89195.
7. Kondĕlková K, Vokurková D, Krejsek J, Borská L, Fiala Z, Ctirad A. Regulatory T cells (TREG) and their roles in immune system with respect to immunopathological disorders. Acta Medica (Hradec Kralove). 2010; 53(2):73-7.
8. Safinia N, Sagoo P, Lechler R, Lombardi G. Adoptive regulatory T cell therapy: challenges in clinical transplantation. Curr Opin Organ Transplant. 2010; 15(4):427-34.
9. Sakaguchi S, Sakaguchi N, Asano M, Itoh M, Toda M. Immunologic self-tolerance maintained by activated T cells expressing IL-2 receptor alpha-chains (CD25). Breakdown of a single mechanism of self-tolerance causes various autoimmune diseases. J Immunol.1995; 155(3):1151-64. 10. Hori S, Nomura T, Sakaguchi S. Control of regulatory T cell development
by the transcription factor Foxp3. Science 2003; 299(5609):1057-61. 11. Fontenot JD, Gavin MA, Rudensky AY. Foxp3 programs the development and
function of CD4 CD25 regulatory T cells. Nat Immunol. 2003; 4(4):330-6. 12. Khattri R, Cox T, Yasayko S-A, Ramsdell F. An essential role for Scurfin in
CD4 CD25 T regulatory cells. Nat Immunol. 2003; 4(4):337-42. 13. Sharma S, Dominguez AL, Lustgarten J. High accumulation of T regulatory
cells prevents the activation of immune responses in aged animals. J Immunol. 2006; 177(12):8348-55.
14. Zhao L, Sun L, Wang H, Ma H, Liu G, Zhao Y. Changes of CD4 CD25 Foxp3 regulatory T cells in aged Balb/c mice. J Leukoc Biol. 2007; 81(6):1386-94. 15. Nishioka T, Shimizu J, Iida R, Yamazaki S, Sakaguchi S. CD4 CD25 Foxp3
T cells and CD4 CD25-Foxp3 T cells in aged mice. J Immunol. 2006; 176(11):6586-93.
16. Williams-Bey Y, Jiang J, Murasko DM. Expansion of regulatory T cells in aged mice following influenza infection. Mech Ageing Dev. 2011; 132(4):163-70. 17. Gregg R, Smith CM, Clark FJ, Dunnion D, Khan N, Chakraverty R, et al.
The number of human peripheral blood CD4 CD25high regulatory T cells increases with age. Clin Exp Immunol. 2005; 140(3):540-6.
18. Gottenberg JE, Lavie F, Abbed K, Gasnault J, Le Nevot E, Delfraissy JF, et al. CD4 CD25high regulatory T cells are not impaired in patients with primary Sjögren’s syndrome. J Autoimmun. 2005; 24(3):235-42.
19. Trzonkowski P, Szmit E, Myśliwska J, Myśliwski A. CD4 CD25 T regulatory cells inhibit cytotoxic activity of CTL and NK cells in humans-impact of immunosenescence. Clin Immunol. 2006; 119(3):307-16.
20. Vukmanovic-stejic M, Zhang Y, Cook JE, Fletcher JM, Mcquaid A, Masters JE, et al. Human CD4 CD25hi Foxp3 regulatory T cells are derived by rapid turnover of memory populations in vivo. J Clin Invest. 2006; 116(9):2423-33. 21. Lages CS, Suffia I, Velilla PA, Huang B, Warshaw G, Hildeman DA, et al. Functional regulatory T cells accumulate in aged hosts and promote chronic infectious disease reactivation. J Immunol. 2008; 181(3):1835-48. 22. Hunder GG. Clinical features of GCA/PMR. Clin Exp Rheumatol. 2000;
18(4 Suppl 20):S6-8.
23. Hasler P, Zouali M. Immune receptor signaling, aging, and autoimmunity. Cell Immunol. 2005; 233(2):102-8.
24. Chougnet CA, Tripathi P, Lages CS, Raynor J, Sholl A, Fink P, et al. A major role for Bim in regulatory T cell homeostasis. J Immunol. 2011; 186(1):156-63. 25. Rosenkranz D, Weyer S, Tolosa E, Gaenslen A, Berg D, Leyhe T, et al. Higher
frequency of regulatory T cells in the elderly and increased suppressive activity in neurodegeneration. J Neuroimmunol. 2007; 188(1-2):117-27. 26. Yan J, Greer JM, Hull R, O’Sullivan JD, Henderson RD, Read SJ, et al. The
27. Santner-Nanan B, Seddiki N, Zhu E, Quent V, Kelleher A, Fazekas de St Groth B, et al. Accelerated age-dependent transition of human regulatory T cells to effector memory phenotype. Int Immunol. 2008; 20(3):375-83. 28. Raynor J, Lages CS, Shehata H, Hildeman DA, Chougnet CA. Homeostasis
and function of regulatory T cells in aging. Curr Opin Immunol. 2012; 24(4):482-7.
29. Fessler J, Ficjan A, Duftner C, Dejaco C. The impact of aging on regulatory T-cells. Front Immunol. 2013; 4:231.
30. Hristov M, Schmitz S, Nauwelaers F, Weber C. A flow cytometric protocol for enumeration of endothelial progenitor cells and monocyte subsets in human blood. J Immunol Methods. 2012; 381(1-2):9-13.
31. Simone R, Zicca A, Saverino D. The frequency of regulatory CD3 CD8 CD28- CD25 T lymphocytes in human peripheral blood increases with age. J Leukoc Biol. 2008; 84(6):1454-61.
32. Arruvito L, Sanz M, Banham AH, Fainboim L. Expansion of CD4 CD25 and FOXP3 regulatory t cells during the follicular phase of the menstrual cycle: implications for human reproduction. J Immunol. 2006; 178(4):2572-8. 33. Prelog M. Aging of the immune system: a risk factor for autoimmunity?
Autoimmun Rev. 2006; 5(2):136-9.
34. Yan B, Liu Y. The nature of increased circulating CD4 CD25 Foxp3 T cells in patients with systemic lupus erythematosus: a novel hypothesis. Open Rheumatol J. 2009; 3:22-4.
35. Mesquita D, de Melo Cruvinel W, Araujo J, Pucci F, Salmazi K, Kallas E, et al. Systemic lupus erythematosus exhibits a dynamic and continuum spectrum of effector/regulatory T cells. Scand J Rheumatol. 2011; 40(1):41-50. 36. Bonelli M, Savitskaya A, Steiner C, Rath E, Smolen JS, Scheinecker C.