Use of neuron-specific enolase for
assessing the severity and outcome
in patients with neurological disorders
Departamentos de 1Neurologia and 2Anestesiologia,
Faculdade de Medicina de Ribeirão Preto,
Universidade de São Paulo, Ribeirão Preto, SP, Brasil J.E. Lima1,
O.M. Takayanagui1,
L.V. Garcia2 and
J.P. Leite1
Abstract
Neuron-specific enolase (NSE) is a glycolytic enzyme present almost exclusively in neurons and neuroendocrine cells. NSE levels in cere-brospinal fluid (CSF) are assumed to be useful to estimate neuronal injury and clinical outcome of patients with serious clinical manifes-tations such as those observed in stroke, head injury, anoxic encepha-lopathy, encephalitis, brain metastasis, and status epilepticus. We compared levels of NSE in serum (sNSE) and in CSF (cNSE) among four groups: patients with meningitis (N = 11), patients with encepha-lic injuries associated with impairment of consciousness (ENC, N = 7), patients with neurocysticercosis (N = 25), and normal subjects (N = 8). Albumin was determined in serum and CSF samples, and the albumin quotient was used to estimate blood-brain barrier permeabil-ity. The Glasgow Coma Scale score was calculated at the time of lumbar puncture and the Glasgow Outcome Scale (GOS) score was calculated at the time of patient discharge or death. The ENC group had significantly higher cNSE (P = 0.01) and albumin quotient (P = 0.005), but not sNSE (P = 0.14), levels than the other groups (Kruskal-Wallis test). Patients with lower GOS scores had higher cNSE levels (P = 0.035) than patients with favorable outcomes. Our findings indicate that sNSE is not sensitive enough to detect neuronal damage, but cNSE seems to be reliable for assessing patients with considerable neurological insult and cases with adverse outcome. However, one should be cautious about estimating the severity of neurological status as well as outcome based exclusively on cNSE in a single patient.
Correspondence
J.P. Leite
Departamento de Neurologia FMRP, USP
Av. Bandeirantes, 3900 14048-900 Ribeirão Preto, SP Brasil
Fax: +55-16-633-0760 E-mail: [email protected]
Research supported by CNPq and FAPESP (No.03/00188-8).
Received September 4, 2003 Accepted October 8, 2003
Key words
•Neuronal damage •Neuron-specific enolase •Cerebrospinal fluid •Albumin quotient
Introduction
Enolase (2-phospho-D glycerate hydro-lyase or phosphopyruvate hydratase, EC 4.2.1.11) is a glycolytic enzyme that con-verts 2-D glycerate to phospho-enolpyruvate. It is a protein which is func-tionally active as a heterodimer assembled
also contained NSE. In contrast to neurons which express the γ γ isoenzyme, non-neu-ronal cells contain predominantly the αγ isoenzyme (3).
The encephalic NSE concentration ranges from 0.4 to 2.2%, and may represent up to 4% of the total soluble proteins in some neurons (3). In adult brains, higher concen-trations of NSE are found in the gray matter (e.g., neocortex) and lower levels in the white matter (e.g., pyramidal tract and corpus cal-losum) (2).
NSE was also reported to be present in platelets and red blood cells (5,6). The pres-ence of NSE in red blood cells is clinically relevant because even a mild hemolysis of 2% may increase serum NSE (sNSE) levels five-fold (7).
Besides being expressed selectively in neurons, NSE has a high stability in biologi-cal fluids and, as a free soluble cytoplasmic protein, can easily diffuse to the extracellu-lar medium and cerebrospinal fluid (CSF) when neuronal membranes are injured. Hence, measurements of CSF-NSE (cNSE) may be an attractive marker of neuronal damage (2,3). There are some peculiarities, however, that have to be considered when cNSE or other CSF neuronal markers are assayed: nature, location and extension of the lesion; CSF turnover and time elapsed between neuronal injury and CSF sample collection (8,9).
Several studies have shown that cNSE yields a reliable estimate of the severity of neuronal injury as well as clinical outcome of patients with serious clinical manifesta-tions such as in cases of stroke (10), head injury (11), anoxic encephalopathy (12), en-cephalitis (13), brain metastasis (8), and sta-tus epilepticus (14).
The results, however, are inconsistent in less severe or chronic neurological disorders (15). It has been suggested that there may be an increase of cNSE at earlier stages of neurodegenerative disorders, followed by a gradual decrease as the disease progresses.
In such advanced stages, most neurons are already degenerate. Indeed, reduced cNSE levels have been described in Alzheimer's disease (16). In contrast to other demential disorders, high cNSE levels have been de-scribed in Creutzfeldt-Jacob disease (17,18). It has been suggested that cNSE and CSF 14-3-3 protein may represent relevant informa-tion to establish the diagnosis of Creutzfeldt-Jacob disease. Patients with a clinical pic-ture indicative of “possible” disease could be considered “probable” cases of Creutz-feldt-Jacob disease if there is an association of high CSF levels of NSE and 14-3-3 pro-tein (19). In the variant form of Creutzfeldt-Jacob disease, it has been shown that cNSE is less sensitive as an indicator, probably because of the slower progression of the variant form (20).
Due to the obvious ethical obstacles for performing CSF collection in some neuro-logical disorders, several studies have sug-gested the use of sNSE to estimate neuronal damage or neurological outcome. However, the integrity of the blood-brain barrier is not always altered in such disorders and NSE may not reach the serum compartment. Hence, the interpretation of studies using only sNSE has been controversial. Some have provided positive results (21-25) while others have not (26-31). Another restriction of the interpretation of sNSE levels is the putative presence of hemolysis that could lead to false-positive results.
The aim of the present study was to deter-mine if NSE levels would be expressed dif-ferentially according to the severity of neu-rological impairment. Hence, we expect that neurological disorders associated with poorer Glasgow Coma Scale and Glasgow Outcome Scale scores would present higher NSE levels.
Subjects and Methods
Subjects
chosen prospectively among patients who un-derwent lumbar puncture due to medical indi-cation. The study was approved by the Ethics Committee of our institution and informed consent was obtained from all subjects.
The Glasgow Coma Scale score (32) was calculated at the time of lumbar puncture and the Glasgow Outcome Scale score (33) was obtained at the time of patient discharge or death. The Glasgow Outcome Scale was used with some modifications as follows: score 1 - death; score 2 - persistent vegeta-tive state; score 3 - severe disability, patients who are unable to perform activities of daily living, dependent on others for self-care; score 4 - mild disability, patients able to perform activities of daily living but with a motor or cognitive deficit; score 5 - normal neurological status.
Patients were divided into four groups according to etiology and/or neurological status: 1) patients with meningitis who pre-sented a score of 15 on the Glasgow Coma Scale; 2) patients with encephalic injuries who presented a score of 14 or less on the Glasgow Coma Scale (ENC); 3) patients with a diagnosis of neurocysticercosis based on clinical, neuroimaging, immunodiagnos-tic reactions and epidemiological data (34); 4) a control group.
The control group included patients with-out any neurological or systemic disorders who underwent lumbar puncture for spinal anesthesia for inguinal herniotomy or ortho-pedic surgeries, or patients with chronic head-ache who had normal clinical examination, neuroimaging, CSF and other ancillary exams, and who were diagnosed as having tension headache.
CSF and serum samples
CSF and peripheral blood samples were collected simultaneously and centrifuged for 10 min at 2500 g; 1 ml of the cell-free samples was immediately frozen and stored at -70ºC until analysis. Hemolyzed serum
samples and CSF samples containing eryth-rocytes were excluded. Control CSF samples were obtained at the time of lumbar puncture performed for spinal anesthesia, before the anesthetic was injected. All samples were thawed and analyzed in a single series. NSE was assayed by a commercial enzyme immu-noassay kit (Cobas Core NSE EIA II; Roche, Basel, Switzerland) (35).
Quantitative determination of albumin by nephelometry (BN-100; Dade Behring, Marburg, Germany) was also performed in serum and CSF samples, and the CSF/serum albumin concentration ratio (albumin quo-tient, Qalb) was used as a measure of blood-brain barrier permeability (36).
Statistical analysis
The Kruskal-Wallis test, followed by the
post hoc Dunn test, was used to compare age, cNSE, sNSE and Qalb among groups and between groups and controls. The Mann-Whitney U-test was used to compare cNSE and sNSE between patients with Glasgow Outcome Scale scores 1 + 3 and patients with Glasgow Outcome Scale scores 4 + 5. Nonparametric linear regression analysis based on Kendall’s rank correlation test was used to correlate NSE with age and several CSF and serum parameters. A P value of <0.05 was used for significance.
Results
variables: age and cNSE, age and Qalb, CSF protein levels and cNSE, CSF number of cells and cNSE, cNSE and Qalb, or sNSE and Qalb (P = 0.23).
Levels of cNSE and sNSE in subjects with CSF pleocytosis (cell counts >5/mm3)
(N = 24; cNSE: mean ± SD = 7.3 ± 11.6 ng/ ml, median = 3.7 ng/ml; sNSE: 7.8 ± 7.4, 6.5 ng/ml; Qalb: 13.2 ± 34.2 x 10⁻³, 5.8 x 10⁻³)
were not different from those of subjects with normal CSF cell counts (N = 27; cNSE: 10.3 ± 21.9, 6.1 ng/ml; sNSE: 8.3 ± 10.4, 6.4 ng/ml; Qalb: 5.4 ± 5.5 x 10⁻³, 3.5 x 10⁻³);
however, Qalb was higher in those with pleocytosis (cNSE: P = 0.30; sNSE: P = 0.61; Qalb: P = 0.033). Levels of cNSE and sNSE in subjects with CSF protein levels >45 mg% (N = 13; cNSE: 18.4 ± 32.8, 5.6 ng/ml; sNSE: 11.2 ± 14.5, 7.9 ng/ml; Qalb: 23.3 ± 46.3 x 10⁻³, 8.7 x 10⁻³) did not differ
from those with CSF proteins ≥45 mg% (N = 38; cNSE: 5.6 ± 5.6, 4.7 ng/ml; sNSE: 7.0 ± 6.1, 6.1 ng/ml; Qalb: 4.5 ± 3.2 x 10⁻³, 3.5 x
10-3) but Qalb was higher (cNSE: P = 0.59;
sNSE: P = 0.66; Qalb: P < 0.0001).
The number of subjects and the main laboratory results of the four groups are pre-sented in Table 1. The comparison of cNSE levels among groups is represented in Figure 1. Table 2 describes the clinical and labora-tory data of each patient from the ENC group. In the ENC group, nonparametric linear re-gression analysis did not show a correlation between Qalb and cNSE or between Qalb and sNSE.
Considering all subjects, cNSE levels did not correlate with sNSE (Figure 2). How-ever, when only patients of the ENC group were considered there was a positive corre-lation between cNSE and sNSE (Figure 3).
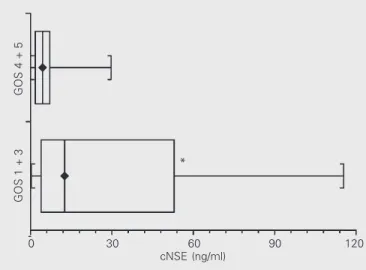
Table 3 presents the cNSE and sNSE values according to clinical outcome. Pa-tients with Glasgow Outcome Scale scores 1 + 3 had significantly higher cNSE levels than patients with Glasgow Outcome Scale scores 4 + 5 (P = 0.035; Figure 4). Patients with Glasgow Outcome Scale scores 1 + 3
Table 1. Distribution of neuron-specific enolase (NSE) levels and albumin quotient among the groups studied.
Group N cNSE (ng/ml) sNSE (ng/ml) Qalb (x10-3)
Mean ± SD Median Mean ± SD Median Mean ± SD Median
MEN 11 4.9 ± 4.6 4.4 5.8 ± 4.6 5.4 6.9 ± 3.3 5.9
ENC 7 35.8 ± 39.2* 29.7 20.9 ± 19.2 9.2 33.8 ± 60.3* 9.5
NC 25 3.9 ± 3.2 3.0 6.6 ± 3.4 7.1 4.1 ± 2.5 3.4
CON 8 6.3 ± 3.6 6.1 4.7 ± 2.3 4.9 3.4 ± 1.4 3.2
CON = control; cNSE = NSE in cerebrospinal fluid; ENC = encephalic; MEN = meningitis; NC = neurocysticercosis; sNSE = serum NSE. The albumin quotient (Qalb) is the ratio CSF albumin concentration/serum albumin concentration. The ENC group had higher levels of cNSE (*P = 0.01) and Qalb (*P = 0.0047), but not of sNSE (P = 0.14), compared to the other groups (Kruskal-Wallis test followed by the Dunn test).
Table 3. Distribution of neuron-specific enolase (NSE) levels according to Glasgow Outcome Scale (GOS) scores.
GOS N cNSE (ng/ml) sNSE (ng/ml)
scores
Mean ± SD Median Mean ± SD Median
1 + 3 7 31.56 ± 41.49 12.50* 20.71 ± 19.34 9.20
4 + 5 44 5.25 ± 5.25 4.40 6.09 ± 3.54 5.85
cNSE = NSE in cerebrospinal fluid; sNSE = serum NSE. *P = 0.035 compared to GOS 4 + 5 (Mann-Whitney test).
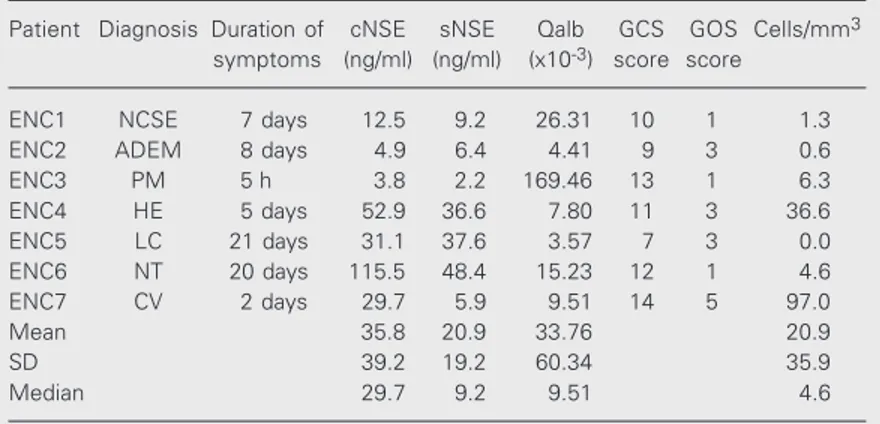
Table 2. Distribution of neuron-specific enolase (NSE) levels, albumin quotient (Qalb) and clinical data among patients with encephalic disorders (ENC).
Patient Diagnosis Duration of cNSE sNSE Qalb GCS GOS Cells/mm3
symptoms (ng/ml) (ng/ml) (x10-3) score score
ENC1 NCSE 7 days 12.5 9.2 26.31 10 1 1.3
ENC2 ADEM 8 days 4.9 6.4 4.41 9 3 0.6
ENC3 PM 5 h 3.8 2.2 169.46 13 1 6.3
ENC4 HE 5 days 52.9 36.6 7.80 11 3 36.6
ENC5 LC 21 days 31.1 37.6 3.57 7 3 0.0
ENC6 NT 20 days 115.5 48.4 15.23 12 1 4.6
ENC7 CV 2 days 29.7 5.9 9.51 14 5 97.0
Mean 35.8 20.9 33.76 20.9
SD 39.2 19.2 60.34 35.9
Median 29.7 9.2 9.51 4.6
also had significantly higher levels of Qalb (P = 0.0499). Serum NSE levels showed a trend to be significant between the two groups (P = 0.0515).
Discussion
The present findings indicate that pa-tients in the ENC group had higher cNSE levels than patients from the other groups. The ENC group was characterized by het-erogeneous neurological disorders that had in common lower scores on the Glasgow Coma Scale. These results indicate that cNSE provides a good indicator of brain injury, as suggested by previous studies (10-12,14).
Due to ethical restrictions and limitations of lumbar puncture, estimation of sNSE would be a more convenient approach, al-lowing serial sample collections. Literature data have shown discrepancies among stud-ies concerning the exclusive use of sNSE to estimate neuronal damage (26,28-30). One could expect that cNSE could be replaced by sNSE at least in cases which present blood-brain barrier disruption. Our findings indi-cated, however, that even in the ENC group, which had evidence of blood-brain barrier disruption (indicated by elevated Qalb), sNSE levels were not significantly higher than in the other groups, suggesting that sNSE is not a realiable indicator of neuronal damage.
The lack of an increase of sNSE and/or cNSE in patients with meningitis, who had normal Glasgow Coma Scale scores, was not particularly surprising, since in this situation the inflammatory involvement of brain pa-renchyma is probably negligible (37). This also seems to be true in conditions associ-ated with involvement of a small proportion of brain parenchyma. We have recently shown that patients with neurocysticercosis with less than five degenerating cysts also had normal cNSE and sNSE levels, indicat-ing that the inflammatory response associ-ated with a relatively small number of de-generating cysts does not provoke sufficient
Figure 2. Nonparametric linear regression analysis of neuron-specific eno-lase levels in serum (sNSE) and neuron-specific enoeno-lase levels in cerebrospi-nal fluid (cNSE) for all subjects (N = 51). P = 0.16 (Kendall’s rank correlation coefficient tau b = 0.135808).
neuronal damage to increase NSE levels (38). A detailed observation of patients from the ENC group discloses some pitfalls of the use of cNSE as a tool to estimate the severity of brain injury. In patient ENC2, who had acute disseminated encephalomyelitis, cNSE was within the normal range 8 days after the onset of symptoms, despite the fact that the patient presented a score of 9 on the Glasgow Coma Scale. The normal levels of cNSE may
sNSE (ng/ml)
50
40
30
20
10
0
0 30 60 90 120
cNSE (ng/ml) ENC
MEN
Control
NC
*
0 30 60 90 120
cNSE (ng/ml)
days later. NSE levels were within the nor-mal range 5 h after the onset of symptoms, when the patient had a Glasgow Coma Scale score of 13. Although cases of meningitis are not usually associated with increased NSE levels, we would expect some elevation when there is an indication of encephalic involve-ment. In addition, cNSE was unable to pre-dict the death outcome. We might speculate that that at the time of lumbar puncture the patient was already in a septic state. The lower Glasgow Coma Scale score could be caused by a diffuse encephalopathy without direct involvement of brain parenchyma. However, a previous study has suggested that sNSE might be used to predict the death outcome in patients with sepsis (40).
The present study indicated that there was a significant difference in cNSE levels between groups of patients with Glasgow Outcome Scale scores 1 + 3 and with Glasgow Outcome Scale scores 4 + 5. Although the present study had a relatively small number of patients, we suggest that cNSE might be a useful parameter to estimate the unfavorable outcome in this set of patients. However, the pitfall cases presented earlier illustrate the limitations of NSE levels as an isolated prog-nostic parameter.
Of the seven patients in the ENC group, four (ENC1, ENC4, ENC5 and ENC6) pre-sented an agreement between elevated NSE levels and poor prognosis, two (ENC2 and ENC3) had normal NSE levels but presented unfavorable outcomes (Glasgow Outcome Scale score 1 or 3), and one patient (ENC7) had elevated NSE levels, but his outcome was favorable (Glasgow Outcome Scale score 5). Our findings indicate that sNSE is not sensitive enough to detect neuronal damage, but cNSE seems to be a reliable parameter for assessing patients with considerable neu-rological insult as well as cases with adverse outcome. However, the estimate in a single patient of the severity of neurological status as well as outcome based exclusively on cNSE should be considered with caution.
0 30 60 90 120
cNSE (ng/ml)
GOS 4 + 5
GOS 1 + 3
Figure 4. Distribution of neuron-specific enolase levels in cerebrospinal fluid (cNSE) of subjects with scores 1 + 3 (N = 7) on the Glasgow Outcome Scale (GOS) and of subjects with scores 4 + 5 on the GOS. *P = 0.035 compared to GOS 4 + 5 (N = 44) (Mann-Whitney test).
be due to the fact that acute disseminated encephalomyelitis predominantly affects white matter (39), which contains lower con-centrations of NSE. An alternative explana-tion is that NSE had been elevated at the onset of symptoms but had returned to nor-mal levels at the time of lumbar puncture.
One unexpected finding in our series con-cerned patient ENC3, who had pneumococ-cal meningoencephalitis and died of sepsis 3
*
sNSE (ng/ml)
50
40
30
20
10
0
0 30 60 90 120
cNSE (ng/ml)
References
1. Fletcher L, Rider CC & Taylor CB (1976). Enolase isoenzymes. III. Chromatographic and immunological characteristics of rat brain enolase. Biochimica et Biophysica Acta, 452: 245-252.
2. Marangos PJ, Schmechel D, Parma AM, Clark RL & Goodwin FK (1979). Measurement of neuron-specific (NSE) and non-neuronal (NNE) isoenzymes of enolase in rat, monkey and human nervous tissue. Journal of Neurochemistry, 33: 319-329.
3. Marangos PJ & Schmechel DE (1987). Neuron specific enolase, a clinically useful marker for neurons and neuroendocrine cells.
An-nual Review of Neuroscience, 10: 269-295.
4. Rider CC & Taylor CB (1975). Evidence for a new form of enolase in rat brain. Biochemical and Biophysical Research Communications, 66: 814-820.
5. Marangos PJ, Campbell IC, Schmechel DE, Murphy DL & Goodwin FK (1980). Blood platelets contain a neuron-specific enolase sub-unit. Journal of Neurochemistry, 34: 1254-1258.
6. Day IN & Thompson RJ (1984). Levels of immunoreactive aldolase C, creatine kinase-BB, neuronal and non-neuronal enolase, and 14-3-3 protein in circulating human blood cells. Clinica Chimica Acta, 136: 219-228.
7. Anastasiades KD, Mullins RE & Conn RB (1987). Neuron-specific enolase. Assessment by ELISA in patients with small cell carcino-ma of the lung. American Journal of Clinical Pathology, 87: 245-249. 8. Royds JA, Timperley WR & Taylor CB (1981). Levels of enolase and other enzymes in the cerebrospinal fluid as indices of pathological change. Journal of Neurology, Neurosurgery and Psychiatry, 44: 1129-1135.
9. Hardemark HG, Ericsson N, Kotwica Z, Rundstrom G, Mendel-Hartvig I, Olsson Y, Pahlman S & Persson L (1989). S-100 protein and neuron-specific enolase in CSF after experimental traumatic or focal ischemic brain damage. Journal of Neurosurgery, 71: 727-731. 10. Hay E, Royds JA, Davies-Jones GA, Lewtas NA, Timperley WR & Taylor CB (1984). Cerebrospinal fluid enolase in stroke. Journal of
Neurology, Neurosurgery and Psychiatry, 47: 724-729.
11. Persson L, Hardemark HG, Gustafsson J, Rundstrom G, Mendel-Hartvig I, Esscher T & Pahlman S (1987). S-100 protein and neuron-specific enolase in cerebrospinal fluid and serum: markers of cell damage in human central nervous system. Stroke, 18: 911-918. 12. Roine RO, Somer H, Kaste M, Viinikka L & Karonen SL (1989).
Neurological outcome after out-of-hospital cardiac arrest. Prediction by cerebrospinal fluid enzyme analysis. Archives of Neurology, 46: 753-756.
13. Studahl M, Rosengren L, Gunther G & Hagberg L (2000). Difference in pathogenesis between herpes simplex virus type 1 encephalitis and tick-borne encephalitis demonstrated by means of cerebrospi-nal fluid markers of glial and neurocerebrospi-nal destruction. Journal of Neurol-ogy, 247: 636-642.
14. Correale J, Rabinowicz AL, Heck CN, Smith TD, Loskota WJ & DeGiorgio CM (1998). Status epilepticus increases CSF levels of neuron-specific enolase and alters the blood-brain barrier. Neurol-ogy, 50: 1388-1391.
15. Jacobi C & Reiber H (1988). Clinical relevance of increased neuron-specific enolase concentration in cerebrospinal fluid. Clinica
Chi-mica Acta, 177: 49-54.
16. Cutler NR, Kay AD, Marangos PJ & Burg C (1986). Cerebrospinal fluid neuron-specific enolase is reduced in Alzheimer’s disease.
Archives of Neurology, 43: 153-154.
17. Zerr I, Bodemer M, Racker S, Grosche S, Poser S, Kretzschmar HA
& Weber T (1995). Cerebrospinal fluid concentration of neuron-specific enolase in diagnosis of Creutzfeldt-Jakob disease. Lancet, 345: 1609-1610.
18. Kropp S, Zerr I, Schulz-Schaeffer WJ, Riedemann C, Bodemer M, Laske C, Kretzschmar HA & Poser S (1999). Increase of neuron-specific enolase in patients with Creutzfeldt-Jakob disease.
Neuro-science Letters, 261: 124-126.
19. Aksamit Jr AJ, Preissner CM & Homburger HA (2001). Quantitation of 14-3-3 and neuron-specific enolase proteins in CSF in Creutzfeldt-Jakob disease. Neurology, 57: 728-730.
20. Green AJ, Thompson EJ, Stewart GE, Zeidler M, McKenzie JM, MacLeod MA, Ironside JW, Will RG & Knight RS (2001). Use of 14-3-3 and other brain-specific proteins in CSF in the diagnosis of variant Creutzfeldt-Jakob disease. Journal of Neurology,
Neurosur-gery and Psychiatry, 70: 744-748.
21. Schaarschmidt H, Prange HW & Reiber H (1994). Neuron-specific enolase concentrations in blood as a prognostic parameter in cere-brovascular diseases. Stroke, 25: 558-565.
22. Fogel W, Krieger D, Veith M, Adams HP, Hund E, Storch-Hagenlocher B, Buggle F, Mathias D & Hacke W (1997). Serum neuron-specific enolase as early predictor of outcome after cardiac arrest. Critical Care Medicine, 25: 1133-1138.
23. Schoerkhuber W, Kittler H, Sterz F, Behringer W, Holzer M, Frossard M, Spitzauer S & Laggner AN (1999). Time course of serum neuron-specific enolase. A predictor of neurological outcome in patients resuscitated from cardiac arrest. Stroke, 30: 1598-1603.
24. Buttner T, Lack B, Jager M, Wunsche W, Kuhn W, Muller T, Przuntek H & Postert T (1999). Serum levels of neuron-specific enolase and s-100 protein after single tonic-clonic seizures. Journal of Neurology, 246: 459-461.
25. DeGiorgio CM, Heck CN, Rabinowicz AL, Gott PS, Smith T & Correale J (1999). Serum neuron-specific enolase in the major sub-types of status epilepticus. Neurology, 52: 746-749.
26. Karkela J, Bock E & Kaukinen S (1993). CSF and serum brain-specific creatine kinase isoenzyme (CK-BB), neuron-brain-specific enolase (NSE) and neural cell adhesion molecule (NCAM) as prognostic markers for hypoxic brain injury after cardiac arrest in man. Journal
of the Neurological Sciences, 116: 100-109.
27. Usui A, Kato K, Murase M, Hotta T, Tanaka M, Takeuchi E & Abe T (1994). Neural tissue-related proteins (NSE, G0 alpha, 28-kDa calbindin-D, S100b and CK-BB) in serum and cerebrospinal fluid after cardiac arrest. Journal of the Neurological Sciences, 123: 134-139. 28. Johnsson P, Blomquist S, Luhrs C, Malmkvist G, Alling C, Solem JO
& Stahl E (2000). Neuron-specific enolase increases in plasma dur-ing and immediately after extracorporeal circulation. Annals of
Tho-racic Surgery, 69: 750-754.
29. Missler U, Wiesmann M, Friedrich C & Kaps M (1997). S-100 protein and neuron-specific enolase concentrations in blood as indicators of infarction volume and prognosis in acute ischemic stroke. Stroke, 28: 1956-1960.
30. Fassbender K, Schmidt R, Schreiner A, Fatar M, Muhlhauser F, Daffertshofer M & Hennerici M (1997). Leakage of brain-originated proteins in peripheral blood: temporal profile and diagnostic value in early ischemic stroke. Journal of the Neurological Sciences, 148: 101-105.
713-718.
32. Teasdale G & Jennett B (1974). Assessment of coma and impaired consciousness. A practical scale. Lancet, 2: 81-84.
33. Jennett B & Bond M (1975). Assessment of outcome after severe brain damage. Lancet, 1: 480-484.
34. Del Brutto OH, Rajshekhar V, White Jr AC et al. (2001). Proposed diagnostic criteria for neurocysticercosis. Neurology, 57: 177-183. 35. Sterk M, Oenings A, Eymann E & Roos W (1999). Development of a
new automated enzyme immunoassay for the determination of neuron-specific enolase. Anticancer Research, 19: 2759-2762. 36. Tibbling G, Link H & Ohman S (1977). Principles of albumin and IgG
analyses in neurological disorders. I. Establishment of reference values. Scandinavian Journal of Clinical and Laboratory Investiga-tion, 37: 385-390.
37. Mokuno K, Kato K, Kawai K, Matsuoka Y, Yanagi T & Sobue I (1983).
Neuron-specific enolase and S-100 protein levels in cerebrospinal fluid of patients with various neurological diseases. Journal of the
Neurological Sciences, 60: 443-451.
38. Lima JE, Takayanagui OM, Garcia LV & Leite JP (2004). Neuron-specific enolase in patients with neurocysticercosis. Journal of the
Neurological Sciences, 217: 31-35.
39. Dale RC, de Sousa C, Chong WK, Cox TC, Harding B & Neville BG (2000). Acute disseminated encephalomyelitis, multiphasic dissemi-nated encephalomyelitis and multiple sclerosis in children. Brain, 123: 2407-2422.
40. Weigand MA, Volkmann M, Schmidt H, Martin E, Bohrer H & Bardenheuer HJ (2000). Neuron-specific enolase as a marker of fatal outcome in patients with severe sepsis or septic shock.