Performance of juvenile turbot (
Scophthalmus maximus
) fed
varying dietary L-carnitine levels at different stocking densities
José Fernando Magalhães Gonçalves
1,2; Bruno Graziano da Silva Turini
1; Rodrigo Otávio
de Almeida Ozório
2*
1
Universidade do Porto – Instituto de Ciências Biomédicas de Abel Salazar, Largo Professor Abel Salazar 2 – 4099-003 – Porto, Portugal.
2
CIMAR/CIIMAR, Centro Interdisciplinar de Investigação Marinha e Ambiental, R. dos Bragas 289 – 4050-123 – Porto, Portugal.
*Corresponding author <rodrigo.ozorio@ciimar.up.pt>
ABSTRACT: Commercial farming of turbot (Scophthalmus maximus) at high stocking densities may lead to growth depression and increasing production costs. Moreover, the high levels of accumulated waste in an intensive system may cause rapid deterioration of water quality, which may undermine the production. L-carnitine is known as a growth-enhancer which shows promise as mitigator of crowding effects. The effects of stocking densities (4, 8, 11 and 14 kg m–2
) on growth performance, feed utilization and body composition were evaluated during 75 days on turbot (75.6 ± 2.8 g) fed two dietary L-carnitine levels (40 or 240 mg kg–1
). At the end of the feeding trial, total ammonia excretion (TAN) was measured postprandially for 24h. Specific growth rate and weight gain decreased with increasing stocking density. Fish held at 4 kg m–2
had higher final body weight (94-96 g) than fish held at higher densities (80-87 g). Protein efficiency ratio was higher in fish held at 4 kg m–2
(1.33-1.36), in comparison to fish stocked at 8 kg m–2
(0.98) or 14 kg m–2
(0.45). Voluntary feed intake decreased from 0.70 to 0.56% BW with increasing stocking density. Dietary L-carnitine supplementation did not affect growth performance and body composition, except for body L-carnitine content which increased from 75 to 128 mg kg–1
BW with supplementation. Fish fed 240 mg L-carnitine supplements had lower TAN that the ones fed 40 mg L-carnitine (p < 0.05).
Key words: compensatory growth, feed additives, stress, husbandry, nitrogen excretion
Desempenho de juvenis de pregado (
Scophthalmus maximus
) em função
da densidade de estocagem e de níveis dietéticos de L-carnitina
RESUMO: A aquicultura de pregado (Scophthalmus maximus) utilizando elevadas densidades pode reduzir o crescimento e aumentar os custos de produção. Elevados níveis de metabolitos gerados nestes sistemas intensivos provocam rápida deterioração da qualidade da água, podendo também comprometer a performance da produção. A L-carnitina atua como potenciadora do crescimento parecendo ser promissora por atenuar alguns desses efeitos. Os efeitos de densidades (4, 8, 11 e 14 kg m–2
) no desempenho do crescimento, composição corporal foram avaliados em pregados (75,6 ± 2,8 g) alimentados durante 75 dias a dois níveis dietéticos de L-carnitina (40 ou 240 mg kg–1
). Após esse período, determinou-se a excreção de amônia pós-prandial durante 24 horas. Os peixes cultivados na menor densidade, 4 kg m–2
, apresentaram melhores taxas de crescimento e ganho de peso (94-96 g) em comparação aos mantidos em altas densidades (80-87 g). A taxa de eficiência proteica foi mais elevada a 4 kg m–2
(1,33-1,36), do que a densidades de 8 kg m–2
(0,98) ou 14 kg m–2
(0,45). A ingestão voluntária de alimento decresceu de 0,70 para 0,56% do peso corporal com o incremento da densidade. A suplementação de carnitina não afetou o crescimento e a composição corporal, com exceção do conteúdo de carnitine da carcaça que passou de 75 a 128 mg kg–1
. Peixes alimentados com suplementos de 240 mg L-carnitina apresentam excreção de amônia mais baixa comparativamente aos alimentados com 40 mg L-carnitina (p < 0,05). Palavras-chave: crescimento compensatório, aditivos alimentares, stress, manejo, excreção nitrogenada
Introduction
The turbot, (Scophthalmus maximus) is recognized by European consumers as one of the most valued species. The commercial farming of turbot has grown steadily in the Atlantic region (FAO, 2009; Garza-Gil et al., 2009) fostered, in recent years, by improvements in selective breeding, improved larval rearing methods and nutrition and husbandry practices in the grow-out phase (Brown, 2002; Person-Le Ruyet, 2002). Although environmental
factors influencing fish growth have been significantly studied, little attention has been devoted to rearing con-ditions (e.g. stocking density, culture system, husbandry) leading to the establishment of social interactions in con-fined stocks.
growth have been reported, and the pattern of this inter-action appears to be species specific (Irwin et al., 1999). In many cultured fish species, growth is inversely related to stocking density and growth reduction or “stunting” of fish in high densities is a ordinarily cited disadvan-tage in intensive culture of marine fish, although this is not universally true (Webb Jr. et al., 2007). Moreover, the intensive production of turbot generates size dispari-ties during the grow-out phase that could be partly at-tributed to poor husbandry practices and stocking den-sity conditions. In many cases, this may lead to the de-velopment of slow growing individuals, increasing pro-duction costs. Imsland et al. (1998) showed that social hierarchies may lead to higher size variation and to lower growth responses.
In recent years, L-carnitine, a multi-physiological, bioactive and pollution-free additive has attracted the interest of many investigators after its potential positive effect on growth and lipid metabolism in fish (Harpaz, 2005). Carnitine plays important physiological roles, shuttling the long-chain fatty acids across the inner mi-tochondrial membrane for oxidation and ATP produc-tion in peripheral tissues (Gulçin, 2006). As a matter of fact, there is solid evidence that carnitine has a growth-promoting effect in a number of fish species (Santulli and D’Amelio, 1986a; Torreele et al., 1993; Chatzifotis et al., 1995; Keshavanath and Renuka, 1998; Jayaprakas et al., 1996; Becker et al., 1999; Twibell and Brown, 2000). It has also been shown that carnitine can reduce lipid content of muscle in sea bass (Santulli and D’Amelio, 1986b) and seabream (Sparus macrocephalus) (Ma et al., 2008). In addition, Mohseni et al. (2008) showed that growth performance of sturgeon (Beluga beluga) was im-proved when fish was fed 300 mg L-carnitine kg–1 diet. Nevertheless, little or no effect of L-carnitine supple-mentation on growth was observed in other species (Burtle and Liu, 1994; Ji et al., 1996; Chatzifotis et al., 1997; Harpaz et al., 1999; Gaylord and Gatlin, 2000; Dzikowski et al., 2001; Ozório et al., 2001; Schlechtriem et al., 2004). The contradictory results may be an effect of different experimental conditions, such as the dura-tion of experiments, level of L-carnitine supplementa-tion, fish size, leaching of carnitine, etc. (Harpaz, 2005).
There is little evidence that L-carnitine can play a protective role against stress response to confinement (Harpaz et al., 1999; Harpaz, 2005) and ammonia toxic-ity (Santulli and D’Amelio, 1986b; Tremblay and Brad-ley, 1992). This study hypothesizes that the addition of carnitine to aquafeeds may promote wellbeing of tur-bot, decreasing stress-related pitfalls induced by inten-sive aquaculture practices, and thus investigates interac-tion effects of dietary L-carnitine and stocking density on growth performance, body composition and nitrogen excretion of juvenile turbot.
Material and Methods
Experimental animals and facilities
The experiment was conducted in Porto, Portugal
using full siblings turbot juveniles with identical nutri-tional history. Fish were acclimated to the rearing sys-tem conditions for one week before start of the trials.Fish (75.6 ± 2.8 g) were distributed into 12 tanks divided into two identical compartments (0.25 m W × 0.40 m L × 0.20 m H), at four densities: 4, 8, 11 and 14 kg m–2 or 40, 80, 120 and 140 kg m–3, equivalent to 10, 20, 30 and 35 fish per compartment, in a 2 × 4 × 3 factorial scheme, totally randomized experimental design. All tanks were connected to a recirculation system (3.5 m3) with identical husbandry conditions. The water condi-tioning structure (TMC 5000 seawater recirculation sys-tem) was equipped with a mechanic filter (100 µ), two biological filters, UV sterilization unit and refrigeration system. Dissolved oxygen (6.17 ± 0.97 mg L–1), water tem-perature (19.7 ± 4.5ºC) and salinity (29.4 ± 3.6 mg L–1) were checked daily; NH4 (1.0 ± 0.7 mg L–1) and NO2 (1.2 ± 0.9 mg L–1) were checked once a week. Fish were kept under a natural photoperiod cycle, spring season.
Diets, feeding and experimental conditions
Fish were fed twice a day (9h30 and 15h30) for 75 days with an iso-nitrogenous (39% CP) and isoenergetic (19.5 Kj g–1) fishmeal-based diet (Table 1), containing 40 or 240 mg kg–1 L-carnitine. Feed consumption was moni-tored carefully to avoid wastes. Carnitine supplement and carnitine analysis were provided by LONZA (Lonza Ltd CH-4002 Basel, Switzerland). At the end of the feeding trial, a complementary study was conducted in which Total Ammonia Nitrogen (TAN = NH3-N + NH4+) postprandial excretion was measured along a 24h cycle, in a way that enabled fish to have enough time to develop a different L-carnitine profile between both di-etary L-carnitine levels. Fish were fed at fixed level (0.56 ± 0.17% body weight - BW) and a tank without fish was used as control. TAN was determined by Palintest® Pho-tometer 7000 (Palintest Ltd, Tyne and Wear, England) and expressed as mg TAN kg–1 body weight.
Sampling
Fish were individually weighed and measured at days 20, 40, 60 and 75. Pooled samples of carcass were taken from five fish from the initial stock and 15 fish per treatment (five fish per tank) at the end of the ex-periment, and stored at –20ºC for subsequent proximate analyses.
Analytical procedure and measurements
Prior to body composition analysis, frozen samples were minced without thawing and frozen-dried. Body composition was analyzed (n=3) for dry matter (105ºC, 24 h), ash (550ºC), crude protein (macro-Kjedahl, N × 6.25) and crude fat (petroleum ether extraction, 40-60ºC). Thiobarbituric Acid Reactive Substances (TBARS) were determined (Wyncke, 1970) as indicator of lipid oxida-tion of the dorsal muscle tissue.
Growth performance
feed conversion rate (FCR), hepatossomatic index (HSI) and voluntary feed intake (VFI). Growth response pa-rameters were calculated as follow: SGR (% BW day–1) = ((ln W2 – lnW1) / t) × 100, were W2 is the weight of fish at end of the trial (t = 75 days), and W1 is the weight of fish at the beginning of the trial; FCR = total dry feed fed (g) / total wet weight gain (g); HSI = liver wet weight (g) / fish wet weight (g) × 100; VFI (%) = 100 × (intake / (W2 + W1) / time). The percent coverage of tank bottom was estimated according to Irwin et al. (1999).
Statistical analyses
Each tank represented one experimental unit, three tanks per treatment. Statistics of all the data was tested in fasting fish (excepted for ammonia which, tested at pre- and posprandially level) by two-way ANOVA, fol-lowed by Tukey's multiple range test.
Results
Mortality rates were below 5%, occurred with no sys-tematic trend and did not differ among experimental groups. Growth performance and protein efficiency ra-tio (PER) were affected by stocking density (Table 2). Fish held at the lower stocking density (4 kg m–2) had higher final body weight (94-96g) than the other groups (80-87g). Protein efficiency ratio was higher in fish held at 4 kg m–2 (1.33-1.36), in comparison to fish stocked at higher densities, in which PER varied between 0.45 (14 kg m–2) and 0.98 (8 kg m–2). Fish held at 4 kg m–2 had the
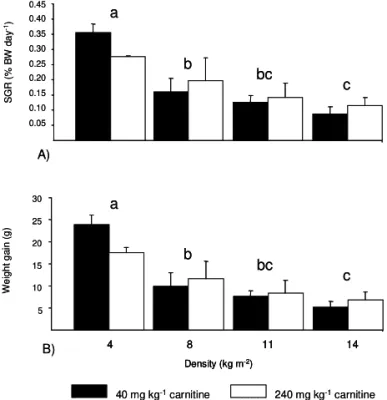
highest voluntary feed intake (VFI, p < 0.05) and lower feed conversion ratio (p < 0.05). Dietary carnitine supplements did not affect growth performance, al-though an interaction between L-carnitine and stocking density was observed for VFI. Specific growth rates and weight gain decreased with increasing stocking density (Figure 1).
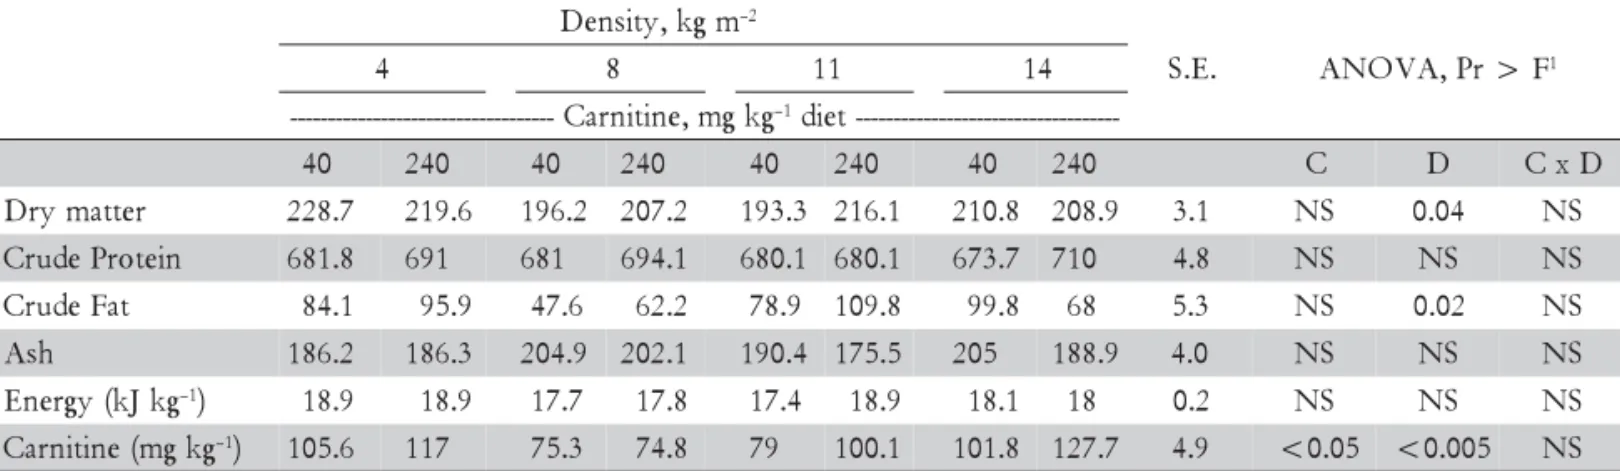
The whole body dry matter and lipid contents were affected by stocking density (Table 3). Dietary L-car-nitine supplementation did not affect body composition, except for body L-carnitine content which increased from 75 to 128 mg kg–1 BW with supplementation. Hepatossomatic index was not affected by diets and stocking density (p > 0.05). The coefficient of variation (CV) for final body weight increased during the experi-mental period in all groups with no systematic trend (Figure 2, p > 0.05). The postprandial excretion of TAN (Figure 3) peaked at approximately 4 hours after the meal (35 mg kg–1 BW), and slowly decreased below the pre-feeding level (2.4 mg kg–1 BW). Fish fed 240 mg L-car-nitine supplements had lower TAN excretion in com-parison to fish fed 40 mg L-carnitine (p < 0.05). TBARS were higher in muscle of fish fed 240 mg L-carnitine in comparison to fish fed 40 mg L-carnitine, but only when held at 4 kg m–2 (Figure 4).
Discussion
Turbot can be reared at very high stocking densities. Howell (1998) evaluated effects of stocking density on turbot and demonstrated that growth was unaffected un-Table 1- Formulation and chemical composition of the experimental diets (g kg–1, unless otherwise stated).
1Calculated from the theoretical energy equivalents of the dietary nutrients according to the following model: E
diet = (0.2364 × % Pdiet) + (0.3954 × % Ldiet) + (0.1715 × % CHdiet) (Modified by Heinsbroek (unpublished) according to Brafield, 1985).
n o i t i s o p m o c t e i D g k g m 0 4 e n i t i n r a
C –1 Carnitine240mgkg–1
s t n e i d e r g n I % 0 7 l a e m h s i
F 303 303
% 0 6 l a e m h s i
F 303 303
e t a r t n e c n o c y o
S 81 81
l a e m y o
S 81 81
t a e h
W 152 151
l i o h s i
F 74 74
) . d t L s i l a i c s O ( x i m e r
P 6 6
g n i k i n r a
C - 0.04
n o i t i s o p m o C r e t a m y r
D 918 915
n i e t o r p e d u r
C 384 391
t a f e d u r
C 136 128
h s
A 127 128
g J k ( y g r e n
E –1) 19.5 19.5
1 e t a r d y h o b r a
C 297 295
g k g m ( e n i t i n r a
til the combined area of the fish exceeded 200% of tank bottom coverage. In this study the number of fish per tank was kept constant throughout the trial so stocking density increased with time. Because there are evidences that removing fish may disrupt hierarchies, resulting in high levels of interactions between individuals and af-fecting growth rates (Baardvik and Jobling, 1990), a de-cision was made not to remove fish from the tanks.
Based on reports by Torreele et al. (1993), Keshavanath and Renuka (1998), Becker et al. (1999) and Twibell and Brown (2000) it was expected that juvenile turbot fed a 240 mg carnitine kg–1 and subjected to in-creased rearing density, would show faster growth and/ or have better feed conversion than fish fed 40 mg car-nitine kg–1. This was not observed in the current study, even though the “apparent” stress conditions were brought in by the extreme high densities. This is espe-cially relevant because densities 11 and 14 kg m–2,
corre-Table 2 - Mean values (n = three replications per treatment) of performance parameters of turbot fed the experimental diets and held at four stocking densities, after 75 days of feeding trial.
C, carnitine effect; D, density effect; C × D, interaction effect. NS, not statistically different. 1Initial body weight (g); 2Final weight (g); 3Body gain (g);4Feed conversion rate; 5Protein efficiation rate; 6Voluntary feed intake (%); 7Hepatossomatic index (%); 8Mortality (%); 9Condition factor.
m g k , y t i s n e
D –2
. E .
S ANOVA,Pr>F1
4 8 11 14
g k g m , e n i t i n r a C
---- –1diet ------------------------------------------
--0
4 240 40 240 40 240 40 240 C D CxD
W B
I 1 78.2 76.4 77.39 73.17 75.9 73.1 75.5 74.5 0.82 NS NS NS
W B
F 2 95.5 93.9 87.3 82.2 83.5 79.7 80.6 81.1 1.74 NS 0.0002 NS
n i a
G 3 23.9 17.5 9.86 11.56 7.55 8.3 5.06 6.68 0.81 NS 0.0007 NS
R C
F 4 2 1.8 3.1 2.46 3.67 3.26 5.62 4.71 0.27 NS NS NS
R E
P 5 1.36 1.33 0.79 0.98 0.66 0.76 0.45 0.52 0.07 NS 0.03 NS
I F
V 6 0.7 0.55 0.52 0.5 0.5 0.46 0.5 0.56 0.02 NS 0.005 0.03
I S
H 7 0.64 0.54 0.6 0.68 0.68 0.59 0.75 0.68 0.04 NS NS NS
M8 - - - 4.5 4.6 5 1.3 6.6 1.04 NS NS NS
K9 1.5 1.5 1.5 1.5 1.5 1.5 1.5 1.5 0.02 NS NS NS
Data are shown as the mean±standard deviation (n = 6 fish per treatment). C, carnitin effect; D, density effect; C × D, interaction effect. NS, not statistically different.
Table 3 -Mean values of proximate composition of the turbots stocked at four densities and fed with different diets (g kg–1, unless otherwise stated).
m g k , y t i s n e
D –2
. E .
S ANOVA,Pr>F1
4 8 11 14
g k g m , e n i t i n r a C
--- –1diet---------------------------------
--0
4 240 40 240 40 240 40 240 C D CxD
r e t t a m y r
D 228.7 219.6 196.2 207.2 193.3 216.1 210.8 208.9 3.1 NS 0.04 NS n
i e t o r P e d u r
C 681.8 691 681 694.1 680.1 680.1 673.7 710 4.8 NS NS NS t
a F e d u r
C 84.1 95.9 47.6 62.2 78.9 109.8 99.8 68 5.3 NS 0.02 NS h
s
A 186.2 186.3 204.9 202.1 190.4 175.5 205 188.9 4.0 NS NS NS g
k J k ( y g r e n
E –1) 18.9 18.9 17.7 17.8 17.4 18.9 18.1 18 0.2 NS NS NS
g k g m ( e n i t i n r a
C –1) 105.6 117 75.3 74.8 79 100.1 101.8 127.7 4.9 <0.05 <0.005 NS
The fact that the efficiency of carnitine reabsortion decreases with increasing levels of circulating carnitine and, as a result, more carnitine is excreted, as demon-strated by Berger and Sachan (1991) in rats, may be an additional explanation for the registered results. More-over, the carnitine effect is more visible in fish prone to high fat accumulation (Ozório, 2001), which is not the case of most flatfish, turbot included.
SGR decreased with increasing stocking density (Fig-ure 1) and the recorded values represent half of the val-ues previously found for fish of the same size (Strand and Øiestad, 1997; Aksungur et al., 2007). The negative impact of stocking density on growth and SGR may have resulted from “overcrowding”, which increased social interactions between individuals. These interactions lead to heterogeneity of individual feed intake and to size variation within experimental groups. In those cases, growth suppression is inevitable (Jobling, 1985; Irwin et al., 1999; Lambert and Dutil, 2001). Furthermore, an in-creased CV for body weight within population is con-sidered an indicative of establishment of hierarchies (Irwin et al., 1999; Lambert and Dutil, 2001). Some spe-cies have very specific behaviour, so hierarchies of domi-nance and submission result in stressful condition for both dominant and subordinate fish, thus compromis-ing performance of any given group. In this work, CV increased with time, regardless of stocking densities and dietary L-carnitine levels.
The negligible increase in the CV for body weight (Figure 2) during the trial indicates low level of social interactions in all experimental groups; hierarchy domi-nance associated with changes in density was not ob-served. Stocking density and growth rates are often re-ported to be related, however, the relationships between both parameters may not be uniformly, positively or negatively, linear for a given species. For instance, Baker and Ayles (1990) suggested that growth of Arctic charr increased with stocking density up to a threshold of 40– 50 kg m-3 and then declined at higher densities. Bjørnsson (1994) reported that stocking density affects the growth of halibut only above a threshold level corresponding to approximately 100% coverage of the tank bottom.
Ammonia is the major excretory nitrogenous com-pound of teleost fish. Since there is very little energy Figure 1 - Mean values (n = 3 tanks treatment–1) of the changes
in specific growth rate (SGR) and weight gain is juvenile turbot fed to dietary L-carnitine levels and subjected to stocking densities (mean ± standard deviation). Different letters are different, p < 0.0001.
40 mg kg-1carnitine 240 mg kg-1carnitine
B)
5 10 15 20 25 30
W
e
ig
ht
ga
in
(g
)
4
Density (kg m-2)
8 11 14
a
b
bc
c
40 mg kg-1carnitine 240 mg kg-1carnitine
B)
5 10 15 20 25 30
W
e
ig
ht
ga
in
(g
)
4
Density (kg m-2)
8 11 14
4
Density (kg m-2)
8 11 14
a
b
bc
c
A)
0.05 0.10 0.15 0.20 0.25 0.30 0.35 0.40 0.45
SG
R
(%
B
W
d
a
y
-1)
a
b
bc
c
A)
0.05 0.10 0.15 0.20 0.25 0.30 0.35 0.40 0.45
SG
R
(%
B
W
d
a
y
-1)
a
b
bc
c
Figure 2 - The coefficient of variance (CV) for weight on days 0, 20, 40, 60 and 75, calculated for the different stocking density of juvenile turbot.
10 20 30 40 50
0 20 40 60 75
Duration (days)
Co
e
ffi
ci
e
n
t
o
f
v
a
ri
a
ti
o
n
(%
)
4 kg m-2 8 kg m-2 11 kg m-2 16 kg m-2 4 kg m-2 8 kg m-2 11 kg m-2 16 kg m-2
Figure 3 - Changes in total ammonia nitrogen (TAN = NH3 + NH4+) excretion in juvenile turbot, pre-conditionally fed different dietary carnitine. * different, p < 0.05. (n = 12 trials treatment–1, mean ± standard deviation, n = 6 replications per treatment).
40 mg kg-1carnitine 240 mg kg-1carnitine
10 20 30 40
0 2 4 6 8 10 12 15 21 24
mg
T
A
N
K
g
-1
BW
Meal 09:00 hs
*
Hours after meal
Figure 4 - Effect of stocking density and dietary L-carnitine on the muscle content of thiobarbituric acid reactive substances (TBARS, mean ± standard deviation, n = 6 replications per treatment). C, carnitine effect; D, density effect; C ×D, interaction effect.
0.10 0.20 0.30 0.40 0.50 0.60 0.70
40 ppm 240 ppm
Dietary carnitine
TB
A
(
m
g
k
g
–1)
4 kg m–2 8 kg m–2 11 kg m–2 16 kg m–2
0.10 0.20 0.30 0.40 0.50 0.60 0.70
40 ppm 240 ppm
Dietary carnitine
TB
A
(
m
g
k
g
–1)
cost involved in the conversion of protein nitrogen to ammonia, production and excretion will always be en-ergetically advantageous in aquatic environments. How-ever, production of ammonia also implies production of the highly toxic non-ionized ammonia (NH3). Ammo-nia toxicity is one of the ordinary stressors in fish cul-ture. Carnitine has been shown to provide increased lipid oxidation for energy production (Ozório et al., 2005) re-sulting in a protein-sparing effect (Ozório, 2009), conse-quently reducing nitrogen excretion.
In this study, there was an immediate rise in TAN excretion after feeding. The rates of postprandial TAN excretion recorded for juvenile turbot rest within the range reported for other species (Robaina et al., 1999; Ismiño-Orbe et al., 2003; Gómez-Requeni et al., 2003; Webb Jr. and Gatlin III, 2003). TAN excretion peaked at approximately 4 h after a single meal and slowly de-creased to values lower than the prefeeding level. Postfeeding pulses of nitrogen excretion have also been reported for many other marine species, such as Euro-pean sea bass (Dicentrarchus labrax), grouper (Epinephelus areolatus) and snaper (Lutjanus argentimaculatus) (Robaina et al., 1999; Leung et al., 1999). In this experi-ment, decreased TAN excretion was registered for fish fed 240 mg carnitine suggesting a more efficient utiliza-tion of ingested protein following the addiutiliza-tion of extra carnitine to the diet.
To estimate how carnitine supplementation may af-fectlipid peroxidation, the muscle concentration of TBARS was determined. The sensitivity of measuring TBARS has made this assay the method of choice for monitoring lipid peroxidation in fish (Oakes and Van Der Kraak, 2003), a major indicator of oxidative stress. Accord-ing to previous studies (Oakes and Van Der Kraak, 2003; Zhang et al., 2008), carnitine acts as an antioxidant, that is, TBARS would be reduced with increasing carnitine contents in the diet. In this study, no effect of carnitine on TBARS value was recorded. In fact, there was a ten-dency of increasing instead of decreasing TBARS in fish fed 240 mg carnitine, in comparison to fish fed 40 mg car-nitine. On the other hand, stocking density noticeably af-fected TBARS values. Animals stocked at 4 and 14 kg m–2 showed the highest levels, eliciting to infer that the oxi-dative stress is influenced by stocking density. However this effect has to be considered very carefully and should not be generalised to any peroxidation process. The fac-tors responsible for lipid peroxidation and the protection mechanism may vary between species and for a given tis-sue according to the nature of the factors inducing peroxidation as suggested by Iliou et al. (1992).
In brief, size disparities in the grow-out stage of tur-bot reared in recirculation systems can be minimized by stocking fish at lower densities than previously reported in literature. A sizable decrease in TAN excretion was registered for fish fed diets supplemented with L-carnitine, which may suggest a more efficient utilization of ingested nitrogen. If this effect could be confirmed, nitrogen loads from fish farms to the aquatic systems could be reduced by extra addition of L-carnitine to fish diets.
Acknowledgements
To the technical staff of Aquatic Engineering Labo-ratory (ICBAS-UP, Portugal), for their excellent hatch-ery assistance. Special thanks to Claudia Escorcio for the TBARS analyses. The results presented are part of the MSc. thesis of B.G.S. Turini.
References
Aksungur, N.; Aksungur, M.; Akbulut, B.; Kutlu, I. 2007. Effects of stocking density on growth performance, survival and food conversion ratio of turbot (psetta maxima) in the net cages on the southeastern coast of the Black Sea. Turkish Journal of Fisheries and Aquatic Sciences 7: 147-152.
Baker, R.F.; Ayles, G.B. 1990. The effects of varying density and loading level on the growth of Arctic charr Salvelinus alpinus and rainbow trout Oncorhynchus mykiss. World Aquacultture 21: 58–62. Baardvik, B.M.; Jobling, M. 1990. Effect of size-sorting on biomass
gain and individual growth rates in Arctic charr, Salvelinus alpinus
L. Aquaculture 90: 11–16.
Becker, K.; Schreiber, S.; Angoni, C.; Blum, R. 1999. Growth performance and feed utilization response of Oreochromis niloticus ×Oreochromis aureus hybrids to L-carnitine measured over a full fattening cycle under commercial conditions. Aquaculture 174: 313-322. Berger, R.; Sachan, D.S. 1991. Effects of supplemental levels of L-carnitine
on blood and urinary carnitines and on portal-ethanol concentrations in the rat. Journal of Nutritional Biochemistry 2: 382-286. Bjørnsson, B. 1994. Effects of stocking density on growth rate of
Halibut Hippoglossus hippoglossus L. reared in large circular tanks for three years. Aquaculture 123: 259-270.
Brafield, A.E. 1985. Laboratory studies of energy budgets. p.257-281. In: Tytler P.; Calow, P. Fish energetics: New perspectives. Croom Helm, London, UK.
Brown, N. 2002. Flatfish Farming Systems in the Atlantic Region. Reviews in Fisheries Science 10: 403-419.
Burtle, G.J.; Liu, Q. 1994. Dietary carnitine and lysine affect channel catfish lipid and protein composition. Journal of the World Aquaculture Society 25: 169–174.
Chatzifotis, S.; Takeuchi, T.; Seikai, T. 1995. The effect of dietary l-carnitine on growth performance and lipid composition in red sea bream fingerlings. Fisheries Science 61: 1004–1008. Chatzifotis, S.; Takeuchi, T.; Watanabe, T.; Satoh, S. 1997. The
effect of dietary carnitine supplementation on growth of rainbow trout fingerlings. Fisheries Science 63: 321–322. Dias, J.; Arzel, J.; Corraze, G.; Kaushik, S.J. 2001. Effects of dietary
l-carnitine supplementation on growth and lipid metabolism in European seabass (Dicentrarchus labrax). Aquaculture Research 32: 206–215.
Dzikowski, R.; Hulata, G.; Karplus, I.; Harpaz, S. 2001. Effect of temperature and dietary l-carnitine supplementation on reproductive performance of female guppy (Poecilia reticulata). Aquaculture 199: 323–332.
Food And Agriculture Organization [FAO]. 2009. State of World Fisheries and Aquaculture 2008. FAO Fisheries and Aquaculture Department, Rome, Italy. 176p.
Garza-Gil, M.; Varela-Lafuente, M.; Caballero-Miguez, G. 2009. Price and production trends in the marine fish aquaculture in Spain. Aquaculture Research 40: 274-281.
Gaylord, T.G.; Gatlin, D.M. 2000. Dietary lipid level but not l-carnitine affects growth performance of hybrid striped bass (Morone chrysops x M. saxatilis). Aquaculture 190: 237– 246. Gómez-Requenia, P.; Mingarroa, M.; Kirchnerb, S.;
Gulçin, I. 2006. Antioxidant and antiradical activities of l-carnitine. Life Sciences 78: 803-811.
Harpaz, S. 2005. L-carnitine and its attributed functions in fish culture and nutrition - a review. Aquaculture 249: 3-21. Harpaz, S.; Becker, K.; Blum, R. 1999. The effect of dietary
L-carnitine supplementation on cold tolerance and growth of the ornamental cichlid fish (Pelvicachromis pulcher) - preliminary results. Journal of Thermal Biology 24: 57-62.
Howell, B.R. 1998. The effect of stocking density on growth and size variation in cultured turbot, Scophthalmus maximus, and sole, Solea solea. ICES CM 1998/L:10.
Iliou, J.P.; Jourd‘Heuil, D.; Robin, F.; Serkiz, B.; Guivarc‘Ch, P.; Volland, J.P; Vilaine, J.P. 1992. Kinetics of photoperoxidation of arachidonic acid molecular mechanisms and effects of antioxidants. Lipids 27: 959-967.
Imsland, A.K.; Folkvord, A.; Nilsen, T. 1998. Stochastic simulation of size-variation in turbot: possible causes analyzed with an individual based model. Journal of Fish Biology 53: 237-258. Irwin, S.; O’Halloran, J.; Fitzgerald, R. 1999. Stocking density,
growth and growth variations in juvenile turbot, Scophthalmus maximus (Rafinesque). Aquaculture 178: 77–88.
Ismiño-Orbe, R.A.; Araújo-Lima, C.A.R.M.; Gomes, L.C. 2003. Excreção de amônia por tambaqui (Colossoma macropomum) de acordo com variações na temperatura da água e massa do peixe. Pesquisa Agropecuária Brasileira 38: 1243-1247.
Jayaprakas, V.; Sambhu, C.; Sunil Kumar, S. 1996. Effect of dietary l-carnitine on growth and reproductive performance of male
Oreochromis mossambicus (Peters). Fishery Technology 33: 84– 90.
Ji, H.; Bradley, T.M.; Tremblay, G.C. 1996. Atlantic salmon (Salmo salar) fed L-carnitine exhibit altered intermediary metabolism and reduce tissue lipid, but no change in growth rate. Journal of Nutrition 126: 1937-1950.
Jobling, M. 1985. Physiological and social constraints on growth of fish with special reference to Arctic charr Salvelinus alpinus L. Aquaculture 44: 83–90.
Keshavanath, P.; Renuka, P. 1998. Effect of dietary l-carnitine on growth and body composition of fingerling rohu, Labeo rohita
(Hamilton). Aquaculture Nutrition 4: 83–87.
Labatut, R.; Olivares, J. 2004. Culture of turbot (Scophthalmus
maximus) juveniles using shallow raceways tanks and
recirculation. Aquacultural Engineering 32: 113- 127. Lambert, Y.; Dutil, J.D. 2001. Food intake and growth of adult
Atlantic cod, Gadus morhua L., reared under different conditions of stocking density, feeding frequency and size-grading. Aquaculture 192: 233–247.
Leung, K.M.Y.; Chu, J.C.W.; Wu, R.S.S. 1999. Effects of body weight, water temperature and raion size on ammonia ecretion by the areolated grouper (Epinephelus areolatus) and mangrove snapper (Lutjanus argentimaculatus). Aquaculture 170: 215-227. Ma, A.; Chen, C.; Lei, J.; Chen, S.; Zhuang, Z.; Wang, Y. 2006. Turbot Scophthalmus maximus: stocking density on growth, pigmentation and feed conversion. Chinese Journal of Oceanology and Limnology 24: 307-312.
Ma, J.J.; Xu, Z.R; Shao, Q.J.; Xu, J.Z.; Hung, S.S.O.; Hu, W.L; Zhou, L.Y. 2008. Effect of dietary supplemental L-carnitine on growth performance, body composition and antioxidant status in juvenile black sea bream, Sparus macrocephalus. Aquaculture Nutrition 4: 464-471.
Mohseni, M.; Ozorio, R.O.A.; Pourkazemi, M.; Bai, S.C. 2008. Effects of Dietary L-Carnitine Supplements on Growth and Body Composition in Beluga Sturgeon (Huso huso) Juveniles. Journal of Applied Ichthyology 24: 646-649.
Oakes, K.D.; Van Der Kraak, G.J. 2003. Utility of the TBARS assay in detecting oxidative stress in white sucker (Catostomus commersoni) populations exposed to pulp mill effluent. Aquatic Toxicology 63: 447-463.
Ozório, R.O.A. 2001. Dietary l-carnitine and energy and lipid metabolism in African catfish (Clarias gariepinus) juveniles. Dr. Thesis. Wageningen University, Wageningen, Holland. 136p.
Ozório, R.O.A. 2009. Dietary L-carnitine supplementation to cultivated fish: A mini-review. Current Nutrition and Food Science 5: 40-48.
Ozório, R.O.A.; Van Eekeren, T.H.B.; Huisman, E.A.; Verreth, J.A.J. 2001. Effects of dietary carnitine and protein energy: nonprotein energy ratios on growth, ammonia excretion and respiratory quotient in African catfish, Clarias gariepinus
(Burchell) juveniles. Aquaculture Research 32: 406–414. Ozório, R.O.A; Van Ginneken, V.; Van Den Thillart, G.;
Verstegen, M.; Verreth, J. 2005. Dietary carnitine maintains energy reserves and delays fatigue of exercised African catfish fed high fat diets. Scientia Agricola 62: 208-213.
Person-Le Ruyet, J. 2002. Turbot (Scophthalmus maximus) Grow-out in Europe: Practices, Results and Prospects. Turkish Journal of Fisheries and Aquatic Sciences 2: 29-39.
Robaina, L.; Corraze, G.; Aguirre, P.; Blanc, D.; Melcion, P.; Kaushik, S. 1999. Digestibility, postprandial ammonia excretion and selected plasma metabolites in European sea bass,
Dicentrarchus labrax, fed pelleted or extruded diets with or without wheat gluten. Aquaculture 179: 45–56.
Rodehutscord, M. 1995. Effects of supplemental dietary l-carnitine on the growth and body composition of rainbow trout (Oncorhynchus mykiss) fed high-fat diets. Journal of Animal Physiology and Animal Nutrition 73: 276–279.
Santulli, A.; D’Amelio, V. 1986a. The effects of carnitine on the growth of sea bass, Dicentrarchus labrax L., fry. Journal of Fish Biology 28: 81–86.
Santulli, A.; D’Amelio, V. 1986b. Effects of supplemental dietary carnitine on the growth and lipid metabolism of hatchery reared sea bass (Dicentrarchus labrax L.). Aquaculture 59: 177-186. Schlechtriem, C.; Bresler, V.; Fishelson, L.; Rosenfeld, M.; Becker,
K. 2004. Protective effects of dietary l-carnitine on tilapia hybrids (Oreochromis niloticus x Oreochromis aureus) reared under intensive pond-culture conditions. Aquaculture Nutrition 10: 55–63.
Strand, H.K.; Øiestad, V. 1997. Growth and the effect of grading, of turbot in shallow raceway system. Aquaculture International 5: 397-406.
Torreele, E.; Van Der Sluiszen, A.; Verreth, J. 1993. The effect of dietary l-carnitine on the growth performance in fingerlings of the African catfish (Clarias gariepinus) in relation to dietary lipid. British Journal of Nutrition 69: 289–299.
Tremblay, G.C.; Bradley, T.M. 1992. L- Carnitine protects fish against acute ammonia toxicity. Comparative Biochemistry and Physiology - Part C 101: 349-351.
Twibell, R.G.; Brown, P.B. 2000. Effects of dietary carnitine on growth rates and body composition of hybrid striped bass (Morone saxatilis male x M. chrysops female). Aquaculture 187: 153-161.
Webb Jr, K.A.; Gatlin III, D.M. 2003. Effects of dietary protein level and form on production characteristics and ammonia excretion of red drum, Sciaenops ocellatus. Aquaculture 225: 17– 26.
Webb Jr, K.A.; Hitzfelder, G.M.; Faulk, C.K.; Holt, J.G. 2007. Growth of juvenile cobia, Rachycentron canadum, at three different densities in a recirculating aquaculture system. Aquaculture 264: 223-227.
Wyncke, W. 1970. Direct determination of the thiobarbituric acid value in trichloracetic acid extracts of fish as a measure of oxidative rancidity. Fette Seifen Anstrichmiltel, Leinfelden 12: 1084-1087.
Zhang, Z.; Zhao, M.; Li, Q.; Zhao, H.; Wang, J.; Li, Y. 2008. Acetyl-l-carnitine inhibits TNF-á-induced insulin resistance via AMPK pathway in rat skeletal muscle cells. FEBS Letters 583: 470-474.