AMTD
7, 6113–6139, 2014The MOPITT Version 6 product
M. N. Deeter et al.
Title Page
Abstract Introduction
Conclusions References
Tables Figures
◭ ◮
◭ ◮
Back Close
Full Screen / Esc
Printer-friendly Version
Interactive Discussion
Discussion
P
a
per
|
Discus
sion
P
a
per
|
Discussion
P
a
per
|
Discussion
P
a
per
Atmos. Meas. Tech. Discuss., 7, 6113–6139, 2014 www.atmos-meas-tech-discuss.net/7/6113/2014/ doi:10.5194/amtd-7-6113-2014
© Author(s) 2014. CC Attribution 3.0 License.
This discussion paper is/has been under review for the journal Atmospheric Measurement Techniques (AMT). Please refer to the corresponding final paper in AMT if available.
The MOPITT Version 6 product: algorithm
enhancements and validation
M. N. Deeter1, S. Martínez-Alonso1, D. P. Edwards1, L. K. Emmons1, J. C. Gille1,
H. M. Worden1, C. Sweeney2, J. V. Pittman3, B. C. Daube3, and S. C. Wofsy3
1
Atmospheric Chemistry Division, National Center for Atmospheric Research, Boulder, CO, USA
2
Global Monitoring Division, NOAA/ESRL, Boulder, CO, USA
3
Department of Earth and Planetary Science, Harvard University, Cambridge, MA, USA
Received: 15 May 2014 – Accepted: 3 June 2014 – Published: 18 June 2014
Correspondence to: M. N. Deeter ([email protected])
AMTD
7, 6113–6139, 2014The MOPITT Version 6 product
M. N. Deeter et al.
Title Page
Abstract Introduction
Conclusions References
Tables Figures
◭ ◮
◭ ◮
Back Close
Full Screen / Esc
Printer-friendly Version
Interactive Discussion
Discussion
P
a
per
|
Discus
sion
P
a
per
|
Discussion
P
a
per
|
Discussion
P
a
per
Abstract
The MOPITT Version 6 (V6) product for carbon monoxide (CO) incorporates several enhancements which will benefit many users of MOPITT data. V6 algorithm improve-ments are described in detail, and V6 validation results are presented. First, a geolo-cation bias related to the orientation of the MOPITT instrument relative to the TERRA
5
platform was characterized and eliminated. Second, the variable a priori for CO con-centrations for V6 is based on simulations performed with the CAM-Chem chemical transport model for the years 2000–2009 instead of the model-derived climatology for 1997–2004 used for V5. Third, meteorological fields required for V6 retrieval process-ing are extracted from the MERRA (“Modern-Era Retrospective Analysis For Research
10
And Applications”) reanalysis. Finally, a significant latitude-dependent retrieval bias in the upper troposphere in Version 5 products has been substantially reduced.
1 Introduction
MOPITT (“Measurements of Pollution in the Troposphere”) is an instrument on the NASA Terra platform designed to permit retrievals of tropospheric profiles of carbon
15
monoxide (CO) using both thermal-infared (TIR) and near-infrared (NIR) observations. Satellite measurements of CO enable air quality forecasts as well as a variety of studies of pollution sources, transport and atmospheric chemistry (Shindell et al., 2006). The MOPITT instrument has been operating nearly continuously since 2000 (Drummond et al., 2010). MOPITT retrieval products have improved continuously as the result
20
of accumulated knowledge regarding the instrument, forward modeling methods, and geophysical variables. The history of retrieval algorithm development for the MOPITT mission was recently summarized in Worden et al. (2014). MOPITT Version 5 products were introduced in 2011, and included the first satellite product for CO to exploit both TIR and NIR observations (Deeter et al., 2013). Here we describe the major features
25
AMTD
7, 6113–6139, 2014The MOPITT Version 6 product
M. N. Deeter et al.
Title Page
Abstract Introduction
Conclusions References
Tables Figures
◭ ◮
◭ ◮
Back Close
Full Screen / Esc
Printer-friendly Version
Interactive Discussion
Discussion
P
a
per
|
Discus
sion
P
a
per
|
Discussion
P
a
per
|
Discussion
P
a
per
2 V6 algorithm features
2.1 Geolocation bias correction
Geolocation data (i.e., latitude and longitude values) reported in previous (V3, V4, and V5) MOPITT Level 1 and Level 2 products appear to be biased due to a misalignment between the MOPITT reference frame and the Terra platform. As described in a
tech-5
nical report available on the MOPITT website (Deeter, 2012), a method was developed to quantify the angular misalignment from observations of latitudinal and longitudinal biases in daytime overpasses. The estimated along-track viewing angle bias was 0.59◦ while the estimated cross-track viewing angle bias was 2.61◦. The corresponding un-certainty in these viewing angle corrections was estimated as 0.4◦. An experimental
10
Level 1 processor (i.e., the processing software which generates the MOPITT Level 1 radiance product) which explicitly corrects for the viewing angle bias was developed and used to validate the correction method. Comparisons of MOPITT radiances and retrieval products in various geographical regions before and after the geolocation cor-rection indicate that the method essentially eliminates the geolocation bias. The
re-15
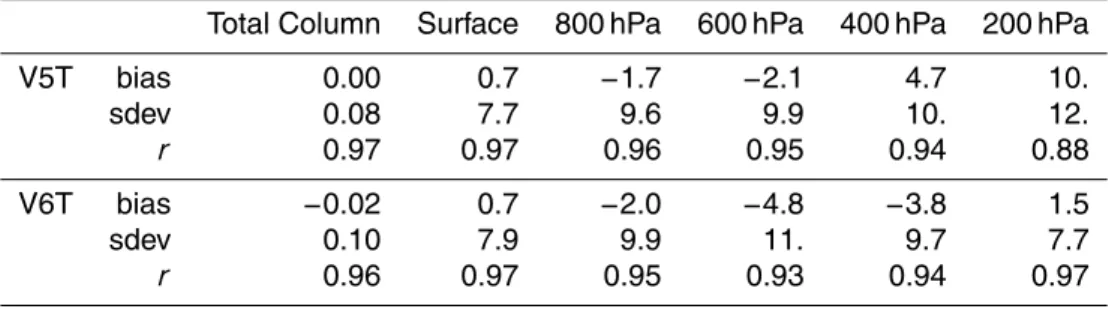
sulting improvement in geolocation is illustrated in Fig. 1 where gridded NIR (Channel 6) clear-sky radiances are shown for all daytime overpasses of Baja California during 2002. The left and right panels present V5 (uncorrected) and V6 (corrected) gridded ra-diances, respectively. The coastline separating the low-albedo ocean and high-albedo land is clearly positioned more accurately in the V6 data.
20
2.2 CO a priori
Like the V4 and V5 products (Deeter et al., 2010, 2013), the V6 products rely on vari-able a priori to represent the geographical and seasonal variability of “background” concentrations of CO. Whereas for earlier products the a priori was based on a climatol-ogy for 1997–2004 (Deeter et al., 2010) and was simulated with the MOZART chemical
25
AMTD
7, 6113–6139, 2014The MOPITT Version 6 product
M. N. Deeter et al.
Title Page
Abstract Introduction
Conclusions References
Tables Figures
◭ ◮
◭ ◮
Back Close
Full Screen / Esc
Printer-friendly Version
Interactive Discussion
Discussion
P
a
per
|
Discus
sion
P
a
per
|
Discussion
P
a
per
|
Discussion
P
a
per
for the period 2000–2009 simulated with the CAM-Chem model (Lamarque et al., 2012). A potential advantage of the new a priori is that it should represent mean global CO concentrations during the actual MOPITT mission (2000 to present) better than the V5 a priori. Like the previous MOZART-based climatology, the new CAM-Chem-based climatology is gridded at one degree (lat/lon) horizontal resolution and monthly
5
temporal resolution.
2.3 Meteorological data
For each CO retrieval, the MOPITT retrieval algorithm requires temperature and wa-ter vapor profiles as well as a priori surface temperature values. In previous opera-tional processors, meteorological data were extracted from NCEP (Naopera-tional Center
10
for Environmental Prediction) GDAS (Global Data Assimilation System) forecast prod-ucts. For V6 processing, meteorological profiles are derived from the NASA MERRA (“Modern-Era Retrospective Analysis For Research And Applications”) reanalysis prod-uct (http://gmao.gsfc.nasa.gov/merra/) (Rienecker et al., 2011). Several benefits are anticipated as a result of using MERRA products rather than NCEP. First, generally
15
higher quality retrieval results are expected due to higher quality water vapor profiles; unphysical values in NCEP water vapor profiles (Deeter et al., 2013) were previously found to sometimes cause anomalous surface-level CO concentrations over the ocean offshore of California. Also, higher quality retrieval results should be achieved over land due to the use of hourly-resolved MERRA surface skin temperatures instead of
20
six-hourly NCEP surface-level air temperatures; skin temperature more closely repre-sents the radiative surface temperature to which MOPITT thermal-channel radiances respond. Higher quality retrieval results are also expected due to higher horizontal and vertical spatial resolution in the meteorological fields; MERRA is produced at 1/2 by 2/3◦ (lat/lon) horizontal resolution on a 42-level pressure grid whereas NCEP GDAS
25
AMTD
7, 6113–6139, 2014The MOPITT Version 6 product
M. N. Deeter et al.
Title Page
Abstract Introduction
Conclusions References
Tables Figures
◭ ◮
◭ ◮
Back Close
Full Screen / Esc
Printer-friendly Version
Interactive Discussion
Discussion
P
a
per
|
Discus
sion
P
a
per
|
Discussion
P
a
per
|
Discussion
P
a
per
the use of climate-quality reanalysis instead of output from a meteorological forecast-ing system.
2.4 Radiance bias corrections
The MOPITT operational processing software exploits a set of radiance-bias correction factors to compensate for relative biases between (1) simulated radiances calculated
5
by the operational radiative transfer model and (2) actual calibrated Level 1 radiances. Without some form of compensation, radiance biases produce biases in the retrieved CO profiles. Radiance bias correction factors compensate for a variety of potential bias sources including errors in instrumental specifications, forward model errors, spec-troscopy errors, and geophysical errors. They were first introduced to compensate for
10
observed biases in Channel 5 radiances (Deeter et al., 2004), but are useful for com-pensating for biases in both Channel 5 and 7 (TIR) radiances. No significant radiance bias was observed for the MOPITT Channel 6 (NIR) radiances in Version 5 products, hence radiance bias correction has so far only been employed for the TIR radiances. Prior to releasing new MOPITT products, final correction factors are determined
iter-15
atively, using retrieval validation results for CO retrieved profiles and total column as indicators of radiance bias. The number of iterations employed in this process is how-ever limited because of the large computational expense.
Validation results for both the V5 TIR-only and TIR/NIR products indicated a sub-stantial bias at 200 hPa (Deeter et al., 2013). Specifically, for the V5 TIR-only product,
20
the observed overall bias at 200 hPa was 7.9 % using the NOAA in-situ profiles, mainly representing North America, and 10 % using the HIPPO field campaign profiles over the Pacific Ocean (described below). However, analysis of the V5 HIPPO validation re-sults revealed that the bias at 200 hPa was strongly latitude dependent, with biases in the Tropics reaching roughly 20–30 % and much smaller biases in midlatitude and
po-25
AMTD
7, 6113–6139, 2014The MOPITT Version 6 product
M. N. Deeter et al.
Title Page
Abstract Introduction
Conclusions References
Tables Figures
◭ ◮
◭ ◮
Back Close
Full Screen / Esc
Printer-friendly Version
Interactive Discussion
Discussion
P
a
per
|
Discus
sion
P
a
per
|
Discussion
P
a
per
|
Discussion
P
a
per
TIR radiances 5A, 5D and 7D were set respectively to 0.99680, 0.98570, and 0.97000. For V6 processing, radiance correction factors were revised to 0.99685, 0.98565, and 0.90000. The significant change in the 7D radiance correction factor reflects the pri-mary role of the 7D radiance on retrieved CO concentrations in the upper troposphere (Deeter et al., 2004).
5
3 V6 validation results
Retrieval validation involves statistical comparisons of MOPITT retrieval products (CO VMR profiles and total columns) with in-situ measurements. For this purpose, we con-sider the in-situ measurements to be exact and assume that the in-situ vertical profiles are representative horizontally over an extended region around the sampling location.
10
A collocation radius of 50 km was employed for the NOAA profiles and 200 km for the HIPPO profiles. The larger acceptance radius for the HIPPO profiles is justified by the expectation that CO vertical and horizontal gradients in the vicinity of the HIPPO pro-files should generally be much weaker than for the NOAA aircraft propro-files, because of the remoteness of these profiles relative to CO source regions. This choice has
15
consequences for the effects of random retrieval errors, as described in Sect. 3.2.1. Because of the coarseness of the radiance weighting functions (or “Jacobians”) and the underconstrained nature of the retrieval process, retrieval products obtained with optimal estimation-type retrieval algorithms are constrained by a priori information as well as the measurements (Pan et al., 1998; Rodgers, 2000). A priori information is
20
represented by (1) an a priori profilexa and (2) an a priori covariance matrix, which
determines the strength of the a priori constraint. The relationship between the true profile (e.g., a measured in-situ profile)xtrue, a priori profile and retrieved profilexrtvis
expressed by the equation
xrtv=xa+A(xtrue−xa) (1)
AMTD
7, 6113–6139, 2014The MOPITT Version 6 product
M. N. Deeter et al.
Title Page
Abstract Introduction
Conclusions References
Tables Figures
◭ ◮
◭ ◮
Back Close
Full Screen / Esc
Printer-friendly Version
Interactive Discussion
Discussion
P
a
per
|
Discus
sion
P
a
per
|
Discussion
P
a
per
|
Discussion
P
a
per
whereAis the retrieval averaging kernel matrix. The vector quantitiesxtrue,xaandxrtv
are expressed in terms of the logarithm of the volume mixing ratio (VMR) rather than VMR itself (Deeter et al., 2007).Aquantifies the sensitivity of the retrieved profile to the true profile and is provided as a diagnostic for each retrieval in all MOPITT products.
Adepends on the weighting functions, a priori covariance matrix and instrument error
5
covariance matrix. Thus, whenxtrueis known (from in-situ measurements, for example),
Eq. (1) provides a formula for calculating equivalent retrievals which account for the inclusion of a priori information and the smoothing effect of the averaging kernel matrix (Rodgers, 2000). MOPITT retrieved total column values are compared with equivalent total column values as described previously (Deeter et al., 2013).
10
3.1 Results based on NOAA aircraft profiles
In-situ measurements of CO concentrations acquired through NOAA’s flask sampling program have served as the foundation for previous MOPITT validation efforts (Em-mons et al., 2009; Deeter et al., 2013). Flask samples obtained on aircraft are pro-cessed by the Global Monitoring Division of NOAA’s Earth System Research
Lab-15
oratory (ESRL). NOAA stations used for MOPITT validation are primarily located in North America and are listed in Table 1. Aircraft profiles acquired through the end of 2013 were exploited to validate the MOPITT V6 product. Flask samples are typ-ically acquired from near the surface up to about 350–400 hPa. Typical in-situ pro-files are derived from approximately 12 flask samples. In order to obtain a
com-20
plete validation profile for comparison with MOPITT retrievals, each in-situ profile is extended vertically above the highest in-situ measurement using the CAM-Chem chemical transport model (to be consistent with the new V6 a priori) and then re-sampled to the standard pressure grid used for the MOPITT operational radiative transfer model (Emmons et al., 2004). The entire database of NOAA aircraft profiles
25
AMTD
7, 6113–6139, 2014The MOPITT Version 6 product
M. N. Deeter et al.
Title Page
Abstract Introduction
Conclusions References
Tables Figures
◭ ◮
◭ ◮
Back Close
Full Screen / Esc
Printer-friendly Version
Interactive Discussion
Discussion
P
a
per
|
Discus
sion
P
a
per
|
Discussion
P
a
per
|
Discussion
P
a
per
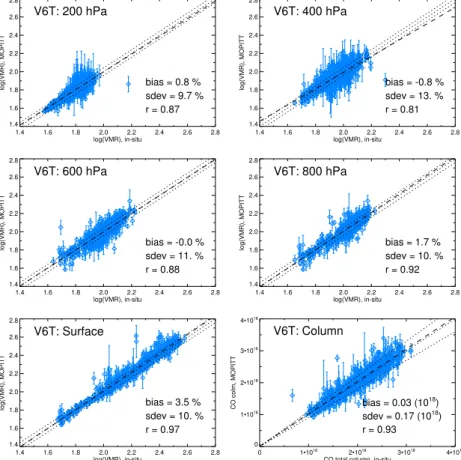
3.1.1 V6 TIR-only
V6 TIR-only retrieval results are compared with corresponding simulated retrievals in Fig. 2 and are summarized in Table 2. Previously reported V5 TIR-only validation re-sults (Deeter et al., 2013) are reproduced in Table 2 for comparison. At most levels, V5 and V6 TIR-only validation results are comparable, exhibiting biases of just a few
per-5
cent. However, at 200 hPa, where the V5 TIR-only product exhibited a bias of 7.9 %, the bias has been reduced to 0.8 %, and the correlation coefficient r has increased from 0.64 to 0.87. A similar improvement is seen at 400 hPa. Conversely, at the surface, the retrieval bias increases slightly from 1.0 % to 3.5 %. With respect to the total column, the bias has been reduced from 0.06×10¹⁸mol cm−2to 0.03×10¹⁸mol cm−2.
10
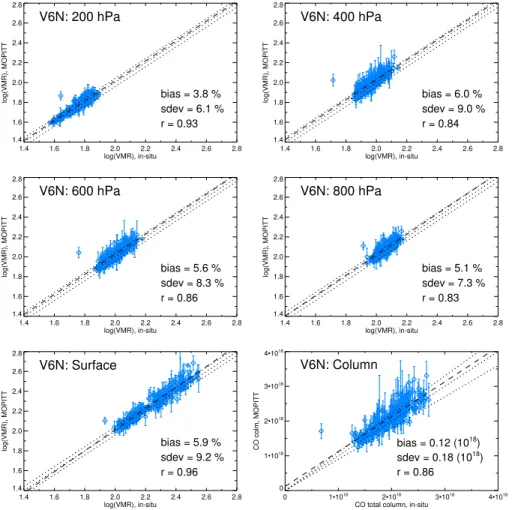
3.1.2 V6 NIR-only
NIR-only retrievals are mainly useful for constraining CO total column; these retrievals are based solely on the ratio of the Channel 6 Difference and Average signals (Deeter et al., 2009) and contain no useful information about the CO vertical distribution. Thus the shape of MOPITT NIR-only retrieved profiles only reflects a priori information.
15
V6 NIR-only retrieval results are compared with corresponding simulated retrievals in Fig. 3 and are summarized in Table 2. V6 NIR-only validation results indicate a positive bias at all levels ranging from about 4 % to 6 % which is a slight increase compared to V5 NIR-only products.
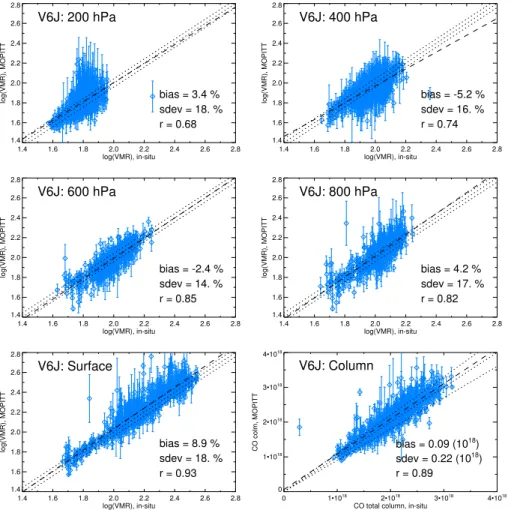
3.1.3 V6 TIR/NIR
20
V6 TIR/NIR validation results shown in Fig. 4 and summarized in Table 2 reveal bi-ases ranging from about−5 % at 400 hPa to 9 % at the surface. Compared to the V5
product, the bias is substantially smaller at 200 hPa (decreasing from 14 % to 3.4 %) but somewhat larger at the surface (increasing from 2.7 % to 8.9 %). Qualitatively, the opposing changes in the bias at 200 hPa and the surface are consistent with the effect
AMTD
7, 6113–6139, 2014The MOPITT Version 6 product
M. N. Deeter et al.
Title Page
Abstract Introduction
Conclusions References
Tables Figures
◭ ◮
◭ ◮
Back Close
Full Screen / Esc
Printer-friendly Version
Interactive Discussion
Discussion
P
a
per
|
Discus
sion
P
a
per
|
Discussion
P
a
per
|
Discussion
P
a
per
of changing the bias in the 7D radiance (Deeter et al., 2004) and are therefore probably the result of changing the 7D radiance bias correction factor. The total column retrieval bias is about 0.09×10¹⁸mol cm−2, which is similar to the corresponding bias for V5.
VMR standard deviations range from about 10–20 %, and are similar to V5. The V5 and V6 TIR/NIR products exhibit relatively large random retrieval errors as the result of
5
a strategy to increase the influence of the NIR radiances and thereby increase retrieval information content (Deeter et al., 2013). This strategy is advantageous for applica-tions where retrieval averaging substantially reduces the effects of random error. Thus, standard deviations are larger and correlation coefficients are smaller for the TIR/NIR product compared to the TIR-only and NIR-only products.
10
3.2 Results based on HIPPO profiles
The “HIAPER Pole to Pole Observations” (HIPPO) campaign included five phases of operations between 2009 and 2011 (Wofsy et al., 2011). A total of 567 in-situ CO profiles acquired during the five phases of HIPPO were used for MO-PITT validation. Observations were made during January 2009 (Phase 1),
Octo-15
ber/November 2009 (Phase 2), March/April 2010 (Phase 3), June/July 2011 (Phase 4), and August/September 2011 (Phase 5). In-situ measurements of atmospheric com-position were performed using the QCLS (“Quantum-Cascade Laser Spectrometer”) instrument (Jiménez et al., 2005) from approximately 67◦S to 80◦N mostly over the Pacific Ocean, and over a wide altitude range (from the surface up to pressures of
20
AMTD
7, 6113–6139, 2014The MOPITT Version 6 product
M. N. Deeter et al.
Title Page
Abstract Introduction
Conclusions References
Tables Figures
◭ ◮
◭ ◮
Back Close
Full Screen / Esc
Printer-friendly Version
Interactive Discussion
Discussion
P
a
per
|
Discus
sion
P
a
per
|
Discussion
P
a
per
|
Discussion
P
a
per
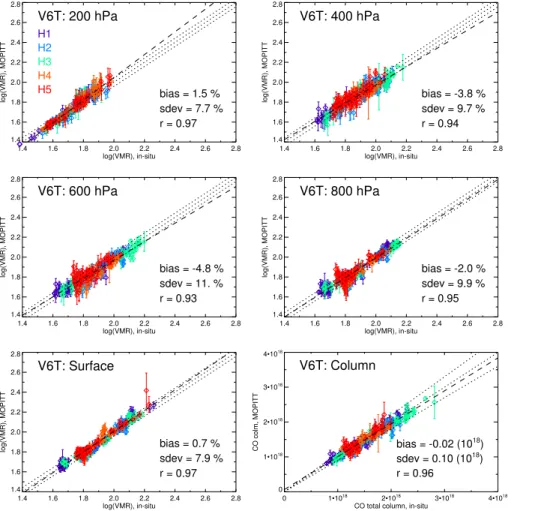
V6 TIR-only
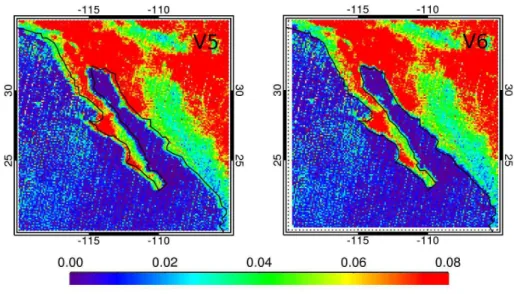
Figure 5 presents V6 TIR-only validation results for the HIPPO profiles. Results are also summarized in Table 3. Compared to the V5 TIR-only results, a clear improvement occurs at 200 hPa, where the bias decreased from 10 % to 1.5 % and the correlation coefficient increased from 0.88 to 0.97. This improvement mirrors the comparison of
5
V5 and V6 TIR-only products based on the NOAA aircraft profiles. In other respects, V6 TIR-only validation results are similar to V5. As indicated by the standard deviation values, random retrieval errors for the HIPPO validation profiles are generally smaller than for the NOAA profiles, especially for retrieved total column. This is likely the result of both greater CO homogeneity within the acceptance radius for the HIPPO profiles
10
(due to the large distances between the oceanic locations of the in-situ data and conti-nental sources) and the statistical benefit of averaging many more individual retrievals for each overpass (due to the fourfold increase in acceptance radius).
4 Analysis
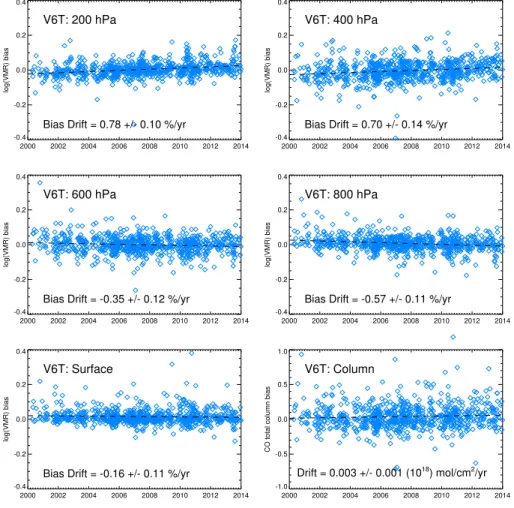
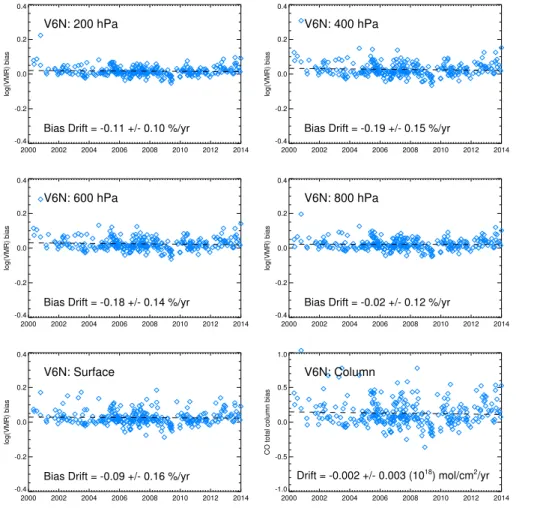
4.1 Long-term stability
15
The continuity and large size of the NOAA profile dataset makes it ideal for analyzing the long-term stability of the MOPITT products and thus justifies applications of MO-PITT products involving the study of CO interannual variability and long-term trends (Worden et al., 2013). The time dependence of MOPITT V6 TIR-only retrieval biases (i.e., retrieved VMR values subtracted by corresponding in-situ measurement-based
20
values) is shown in Fig. 6. The dashed line shown in each panel is a least-squares best fit to the data. The slope of this linear fit quantifies the long-term bias drift and is listed in each panel and in Table 2, along with bias drift results for the V5 TIR-only product. Bias drift results for the V6 TIR-only product are mostly similar to V5 results. For both products, statistically significant positive bias drifts (i.e., bias drift values greater than
AMTD
7, 6113–6139, 2014The MOPITT Version 6 product
M. N. Deeter et al.
Title Page
Abstract Introduction
Conclusions References
Tables Figures
◭ ◮
◭ ◮
Back Close
Full Screen / Esc
Printer-friendly Version
Interactive Discussion
Discussion
P
a
per
|
Discus
sion
P
a
per
|
Discussion
P
a
per
|
Discussion
P
a
per
the one-sigma uncertainty) are evident in the upper troposphere and opposing nega-tive bias drifts are observed in the middle troposphere. Bias drifts are slightly smaller (in absolute value) for V6 compared to V5, except at the surface, where the V6 bias drift is almost negligible. Total column bias drift is nearly negligible for both the V5 and V6 TIR-only products.
5
Bias drift timeseries for the V6 NIR-only and TIR/NIR products are shown in Figs. 7 and 8 and summarized in Table 2. For the V6 NIR-only product, the bias drift is less than 0.2 % yr−1at all levels; this is similar to the bias drift for the V5 NIR-only product. Bias drift for the V6 TIR/NIR product varies from−1.3 % yr−1 at 800 hPa to 1.6 % yr−1
at 200 hPa. Compared to the V5 TIR/NIR product, the bias drift is improved at 200 and
10
400 hPa but is otherwise similar. Total column bias drift for both the V5 and V6 TIR/NIR products is nearly negligible.
4.2 Geographical variability
With wide latitudinal coverage, the HIPPO dataset allows the analysis of the geograph-ical dependence of the bias retrieval bias (Deeter et al., 2013). MOPITT V6 TIR-only
15
retrieval biases (retrieved values minus simulated values) calculated with the HIPPO in-situ profiles are plotted vs. latitude in Fig. 9. The large black diamonds and error bars in each panel indicate bias statistics (mean and standard deviation) calculated over each 30◦ wide latitudinal zone. As noted above, V5 TIR-only validation results exhib-ited a strong latitude dependence in the retrieval bias at 200 hPa, with biases of about
20
AMTD
7, 6113–6139, 2014The MOPITT Version 6 product
M. N. Deeter et al.
Title Page
Abstract Introduction
Conclusions References
Tables Figures
◭ ◮
◭ ◮
Back Close
Full Screen / Esc
Printer-friendly Version
Interactive Discussion
Discussion
P
a
per
|
Discus
sion
P
a
per
|
Discussion
P
a
per
|
Discussion
P
a
per
5 Conclusions
The new features incorporated into the MOPITT V6 product will be relevant to some but likely not all users of MOPITT products. The improved geolocation data will clearly benefit analyses of CO variability on fine spatial scales, including studies of urban pol-lution. The reduced retrieval bias in the upper troposphere should aid studies of trace
5
gas variability in the UTLS (upper troposphere/lower stratosphere) region. The use of a new CO climatology based on CAM-Chem simulations for 2000–2009 should result in better background CO concentrations, especially near source regions. Finally, V6 retrieval processing exploits MERRA reanalysis as the source of meteorological data, offering improved spatial resolution for atmospheric variables and a more physically
10
appropriate source for surface skin temperature.
Acknowledgements. Matthieu Pommier, at the Air Quality Research Division of Environment
Canada (and now at the Pierre Simon Laplace Institute), was instrumental in helping to iden-tify and correct the geolocation bias. The NCAR MOPITT project is supported by the National Aeronautics and Space Administration (NASA) Earth Observing System (EOS) Program. The 15
National Center for Atmospheric Research (NCAR) is sponsored by the National Science Foun-dation.
References
Deeter, M. N.: MOPITT Geolocation Bias Analysis and Corrections, National Center for At-mos. Res., Boulder, Colorado, United States, available at: http://web3.acd.ucar.edu/mopitt/ 20
GeolocationBiasReport.pdf (last access: 7 June 2012) 2012. 6115
Deeter, M. N., Emmons, L. K., Francis, G. L., Edwards, D. P., Gille, J. C., Warner, J. X., Khat-tatov, B., Ziskin, D., Lamarque, J.-F., Ho, S.-P., Yudin, V., Attie, J.-L., Packman, D., Chen, J., Mao, D., Drummond, J. R., Novelli, P., and Sachse, G.: Evaluation of operational radiances for the Measurements of Pollution in the Troposphere (MOPITT) instrument CO thermal band 25
AMTD
7, 6113–6139, 2014The MOPITT Version 6 product
M. N. Deeter et al.
Title Page
Abstract Introduction
Conclusions References
Tables Figures
◭ ◮
◭ ◮
Back Close
Full Screen / Esc
Printer-friendly Version
Interactive Discussion
Discussion
P
a
per
|
Discus
sion
P
a
per
|
Discussion
P
a
per
|
Discussion
P
a
per
Deeter, M. N., Edwards, D. P., and Gille, J. C.: Retrievals of carbon monoxide profiles from MOPITT observations using lognormal a priori statistics, J. Geophys. Res., 112, D11311, doi:10.1029/2006JD007999, 2007. 6119
Deeter, M. N., Edwards, D. P., Gille, J. C., and Drummond, J. R.: CO retrievals based on MOPITT near-infrared observations, J. Geophys. Res., 114, D04303, 5
doi:10.1029/2008JD010872, 2009. 6120
Deeter, M., Edwards, D. P., Gille, J. C., Emmons, L., Francis, G. L., Ho, S.-P., Mao, D. Y., Worden, H. M., Drummond, J. R., and Novelli, P. C.: The MOPITT Version 4 CO product: algorithm enhancements, validation, and long-term stability, J. Geophys. Res., 115, D07306, doi:10.1029/2009JD013005, 2010. 6115
10
Deeter, M. N., Martínez-Alonso, S., Edwards, D. P., Emmons, L. K., Gille, J. C., Worden, H. M., Pittman, J. V., Daube, B. C., and Wofsy, S. C.: Validation of MOPITT Version 5 thermal-infrared, near-thermal-infrared, and multispectral carbon monoxide profile retrievals for 2000–2011, J. Geophys. Res., 118, 6710–6725, doi:10.1002/jgrd.50272, 2013. 6114, 6115, 6116, 6117, 6119, 6120, 6121, 6123
15
Drummond, J. R., Zou, J., Nichitiu, F., Kar, J., Deschambaut, R., and Hackett, J.: A review of 9-year performance and operation of the MOPITT instrument, Adv. Space Res., 45, 760–774, doi:10.1016/j.asr.2009.11.019, 2010. 6114
Emmons, L. K., Deeter, M. N., Gille, J. C., Edwards, D. P., Attié, J.-L., Warner, J., Ziskin, D., Francis, G., Khattatov, B., Yudin, V., Lamarque, J.-F., Ho, S.-P., Mao, D., Chen, J. S., Drum-20
mond, J., Novelli, P., Sachse, G., Coffey, M. T., Hannigan, J. W., Gerbig, C., Kawakami, S., Kondo, Y., Takegawa, N., Schlager, H., Baehr, J., and Ziereis, H.: Validation of Measure-ments of Pollution in the Troposphere (MOPITT) CO retrievals with aircraft in situ profiles, J. Geophys. Res., 109, D03309, doi:10.1029/2003JD004101, 2004. 6119
Emmons, L. K., Edwards, D. P., Deeter, M. N., Gille, J. C., Campos, T., Nédélec, P., Novelli, P., 25
and Sachse, G.: Measurements of Pollution In The Troposphere (MOPITT) validation through 2006, Atmos. Chem. Phys., 9, 1795–1803, doi:10.5194/acp-9-1795-2009, 2009. 6119 Emmons, L. K., Walters, S., Hess, P. G., Lamarque, J.-F., Pfister, G. G., Fillmore, D., Granier, C.,
Guenther, A., Kinnison, D., Laepple, T., Orlando, J., Tie, X., Tyndall, G., Wiedinmyer, C., Baughcum, S. L., and Kloster, S.: Description and evaluation of the Model for Ozone 30
AMTD
7, 6113–6139, 2014The MOPITT Version 6 product
M. N. Deeter et al.
Title Page
Abstract Introduction
Conclusions References
Tables Figures
◭ ◮
◭ ◮
Back Close
Full Screen / Esc
Printer-friendly Version
Interactive Discussion
Discussion
P
a
per
|
Discus
sion
P
a
per
|
Discussion
P
a
per
|
Discussion
P
a
per
Jiménez, R., Herndon, S., Shorter, J. H., Nelson, D. D., McManus, J. B., and Zahniser, M. S.: Atmospheric trace gas measurements using a dual quantum-cascade laser mid-infrared absorption spectrometer, in: Novel In-Plane Semiconductor Lasers IV, Proc. SPIE Vol. 5738, edited by: Mermelstein, C. and Bour, D. P., Bellingham, WA, 2005. 6121
Lamarque, J.-F., Emmons, L. K., Hess, P. G., Kinnison, D. E., Tilmes, S., Vitt, F., Heald, C. L., 5
Holland, E. A., Lauritzen, P. H., Neu, J., Orlando, J. J., Rasch, P. J., and Tyndall, G. K.: CAM-chem: description and evaluation of interactive atmospheric chemistry in the Community Earth System Model, Geosci. Model Dev., 5, 369–411, doi:10.5194/gmd-5-369-2012, 2012. 6116
Pan, L., Gille, J., Edwards, D. P., Bailey, P. L., and Rodgers, C. D.: Retrieval of tropospheric 10
carbon monoxide for the MOPITT instrument, J. Geophys. Res., 103, 32277–32290, 1998. 6118
Rienecker, M. M., Suarez, M. J., Gelaro, R., Todling, R., Bacmeister, J., Liu, E., Bosilovich, M. G., Schubert, S. D., Takacs, L., Kim, G.-K., Bloom, S., Chen, J., Collins, D., Conaty, A., da Silva, A., Gu, W., Joiner, J., Koster, R. D., Lucchesi, R., Molod, A., Owens, T., Pawson, 15
S., Pegion, P., Redder, C. R., Reichle, R., Robertson, F. R., Ruddick, A. G., Sienkiewicz, M., and Woollen, J.: MERRA: NASA’s Modern-Era Retrospective Analysis for Research and Applications, J. Climate, 24, 3624–3648, doi:10.1175/JCLI-D-11-00015.1, 2011. 6116 Rodgers, C. D.: Inverse Methods for Atmospheric Sounding, Theory and Practice, World
Sci-entific, Singapore, 2000. 6118, 6119 20
Shindell, D. T., Faluvegi, G., Stevenson, D. S., Krol, M. C., Emmons, L. K., Lamarque, J.-F., Petron, G., Dentener, F. J., Ellingsen, K., Schultz, M. G., Wild, O., Amann, M., Atherton, C. S., Bergmann, D. J., Bey, I., Butler, T., Cofala, J., Collins, W. J., Derwent, R. G., Doherty, R. M., Drevet, J., Eskes, H. J., Fiore, A. M., Gauss, M., Hauglustaine, D. A., Horowitz, L. W., Isaksen, I. S. A., Lawrence, M. G., Montanaro, V., Muller, J.-F., Pitari, G., Prather, M. J., Pyle, 25
J. A., Rast, S., Rodriguez, J. M., Sanderson, M. G., Savage, N. H., Strahan, S. E., Sudo, K., Szopa, S., Unger, N., van Noije, T. P. C., and Zeng, G.: Multimodel simulations of carbon monoxide: comparison with observations and projected near-future changes, J. Geophys. Res., 111, D19306, doi:10.1029/2006JD007100, 2006. 6114
Wofsy, S. C. and the HIPPO Science Team and Cooperating Modellers and Satellite Teams: 30
AMTD
7, 6113–6139, 2014The MOPITT Version 6 product
M. N. Deeter et al.
Title Page
Abstract Introduction
Conclusions References
Tables Figures
◭ ◮
◭ ◮
Back Close
Full Screen / Esc
Printer-friendly Version
Interactive Discussion
Discussion
P
a
per
|
Discus
sion
P
a
per
|
Discussion
P
a
per
|
Discussion
P
a
per
Worden, H. M., Deeter, M. N., Frankenberg, C., George, M., Nichitiu, F., Worden, J., Aben, I., Bowman, K. W., Clerbaux, C., Coheur, P. F., de Laat, A. T. J., Detweiler, R., Drummond, J. R., Edwards, D. P., Gille, J. C., Hurtmans, D., Luo, M., Martínez-Alonso, S., Massie, S., Pfis-ter, G., and Warner, J. X.: Decadal record of satellite carbon monoxide observations, Atmos. Chem. Phys., 13, 837–850, doi:10.5194/acp-13-837-2013, 2013. 6122
5
AMTD
7, 6113–6139, 2014The MOPITT Version 6 product
M. N. Deeter et al.
Title Page
Abstract Introduction
Conclusions References
Tables Figures
◭ ◮
◭ ◮
Back Close
Full Screen / Esc
Printer-friendly Version
Interactive Discussion
Discussion
P
a
per
|
Discus
sion
P
a
per
|
Discussion
P
a
per
|
Discussion
P
a
per
Table 1.NOAA validation site locations.
NOAA Validation Site Latitude Longitude Observational Period
AMTD
7, 6113–6139, 2014The MOPITT Version 6 product
M. N. Deeter et al.
Title Page
Abstract Introduction
Conclusions References
Tables Figures
◭ ◮
◭ ◮
Back Close
Full Screen / Esc
Printer-friendly Version
Interactive Discussion
Discussion
P
a
per
|
Discus
sion
P
a
per
|
Discussion
P
a
per
|
Discussion
P
a
per
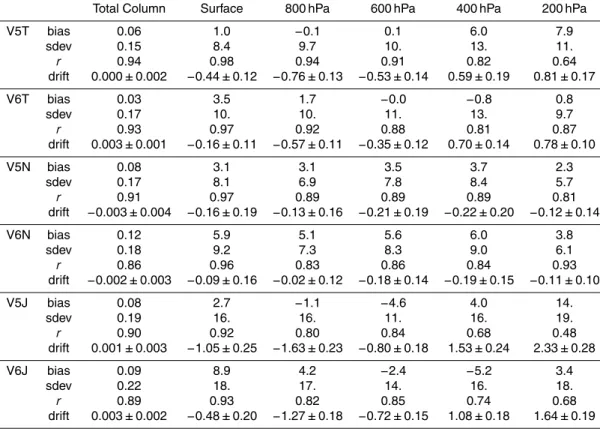
Table 2.Summarized validation results for V5 and V6 TIR-only (V5T and V6T), NIR-only (V5N and V6N) and TIR/NIR (V5J and V6J) products based on in-situ data from NOAA validation sites. Bias and standard deviation statistics for the total column are in units of 1018mol cm−2. Bias and standard deviations for retrieval levels are expressed in %. Total column drift is in units of 1018mol cm−2
yr−1
. Drift for the retrieval levels is expressed in % yr−1
.
Total Column Surface 800 hPa 600 hPa 400 hPa 200 hPa V5T bias 0.06 1.0 −0.1 0.1 6.0 7.9
sdev 0.15 8.4 9.7 10. 13. 11.
r 0.94 0.98 0.94 0.91 0.82 0.64
drift 0.000±0.002 −0.44±0.12 −0.76±0.13 −0.53±0.14 0.59±0.19 0.81±0.17 V6T bias 0.03 3.5 1.7 −0.0 −0.8 0.8
sdev 0.17 10. 10. 11. 13. 9.7
r 0.93 0.97 0.92 0.88 0.81 0.87
drift 0.003±0.001 −0.16±0.11 −0.57±0.11 −0.35±0.12 0.70±0.14 0.78±0.10 V5N bias 0.08 3.1 3.1 3.5 3.7 2.3
sdev 0.17 8.1 6.9 7.8 8.4 5.7
r 0.91 0.97 0.89 0.89 0.89 0.81
drift −0.003±0.004 −0.16±0.19 −0.13±0.16 −0.21±0.19 −0.22±0.20 −0.12±0.14 V6N bias 0.12 5.9 5.1 5.6 6.0 3.8
sdev 0.18 9.2 7.3 8.3 9.0 6.1
r 0.86 0.96 0.83 0.86 0.84 0.93
drift −0.002±0.003 −0.09±0.16 −0.02±0.12 −0.18±0.14 −0.19±0.15 −0.11±0.10 V5J bias 0.08 2.7 −1.1 −4.6 4.0 14.
sdev 0.19 16. 16. 11. 16. 19.
r 0.90 0.92 0.80 0.84 0.68 0.48
drift 0.001±0.003 −1.05±0.25 −1.63±0.23 −0.80±0.18 1.53±0.24 2.33±0.28 V6J bias 0.09 8.9 4.2 −2.4 −5.2 3.4
sdev 0.22 18. 17. 14. 16. 18.
r 0.89 0.93 0.82 0.85 0.74 0.68
AMTD
7, 6113–6139, 2014The MOPITT Version 6 product
M. N. Deeter et al.
Title Page
Abstract Introduction
Conclusions References
Tables Figures
◭ ◮
◭ ◮
Back Close
Full Screen / Esc
Printer-friendly Version
Interactive Discussion
Discussion
P
a
per
|
Discus
sion
P
a
per
|
Discussion
P
a
per
|
Discussion
P
a
per
Table 3.Summarized validation results for V5T and V6T products based on in-situ data from HIPPO field campaign. See caption to Table 2.
Total Column Surface 800 hPa 600 hPa 400 hPa 200 hPa
V5T bias 0.00 0.7 −1.7 −2.1 4.7 10.
sdev 0.08 7.7 9.6 9.9 10. 12.
r 0.97 0.97 0.96 0.95 0.94 0.88
V6T bias −0.02 0.7 −2.0 −4.8 −3.8 1.5
sdev 0.10 7.9 9.9 11. 9.7 7.7
AMTD
7, 6113–6139, 2014The MOPITT Version 6 product
M. N. Deeter et al.
Title Page
Abstract Introduction
Conclusions References
Tables Figures
◭ ◮
◭ ◮
Back Close
Full Screen / Esc
Printer-friendly Version
Interactive Discussion
Discussion
P
a
per
|
Discus
sion
P
a
per
|
Discussion
P
a
per
|
Discussion
P
a
per
AMTD
7, 6113–6139, 2014The MOPITT Version 6 product
M. N. Deeter et al.
Title Page Abstract Introduction Conclusions References Tables Figures ◭ ◮ ◭ ◮ Back Close
Full Screen / Esc
Printer-friendly Version Interactive Discussion Discussion P a per | Discus sion P a per | Discussion P a per | Discussion P a per
1.4 1.6 1.8 2.0 2.2 2.4 2.6 2.8 log(VMR), in-situ 1.4 1.6 1.8 2.0 2.2 2.4 2.6 2.8 log(VMR), MOPITT
V6T: 200 hPa
r = 0.87 bias = 0.8 % sdev = 9.7 %
1.4 1.6 1.8 2.0 2.2 2.4 2.6 2.8 log(VMR), in-situ 1.4 1.6 1.8 2.0 2.2 2.4 2.6 2.8 log(VMR), MOPITT
V6T: 400 hPa
r = 0.81 bias = -0.8 % sdev = 13. %
1.4 1.6 1.8 2.0 2.2 2.4 2.6 2.8 log(VMR), in-situ 1.4 1.6 1.8 2.0 2.2 2.4 2.6 2.8 log(VMR), MOPITT
V6T: 600 hPa
r = 0.88 bias = -0.0 % sdev = 11. %
1.4 1.6 1.8 2.0 2.2 2.4 2.6 2.8 log(VMR), in-situ 1.4 1.6 1.8 2.0 2.2 2.4 2.6 2.8 log(VMR), MOPITT
V6T: 800 hPa
r = 0.92 bias = 1.7 % sdev = 10. %
1.4 1.6 1.8 2.0 2.2 2.4 2.6 2.8 log(VMR), in-situ 1.4 1.6 1.8 2.0 2.2 2.4 2.6 2.8 log(VMR), MOPITT V6T: Surface
r = 0.97 bias = 3.5 % sdev = 10. %
0 1•1018 2•1018 3•1018 4•1018
CO total column, in-situ 0
1•1018
2•1018
3•1018
4•1018
CO colm, MOPITT
V6T: Column
r = 0.93 bias = 0.03 (1018)
sdev = 0.17 (1018
)
AMTD
7, 6113–6139, 2014The MOPITT Version 6 product
M. N. Deeter et al.
Title Page Abstract Introduction Conclusions References Tables Figures ◭ ◮ ◭ ◮ Back Close
Full Screen / Esc
Printer-friendly Version Interactive Discussion Discussion P a per | Discus sion P a per | Discussion P a per | Discussion P a per
1.4 1.6 1.8 2.0 2.2 2.4 2.6 2.8 log(VMR), in-situ 1.4 1.6 1.8 2.0 2.2 2.4 2.6 2.8 log(VMR), MOPITT
V6N: 200 hPa
r = 0.93 bias = 3.8 % sdev = 6.1 %
1.4 1.6 1.8 2.0 2.2 2.4 2.6 2.8 log(VMR), in-situ 1.4 1.6 1.8 2.0 2.2 2.4 2.6 2.8 log(VMR), MOPITT
V6N: 400 hPa
r = 0.84 bias = 6.0 % sdev = 9.0 %
1.4 1.6 1.8 2.0 2.2 2.4 2.6 2.8 log(VMR), in-situ 1.4 1.6 1.8 2.0 2.2 2.4 2.6 2.8 log(VMR), MOPITT
V6N: 600 hPa
r = 0.86 bias = 5.6 % sdev = 8.3 %
1.4 1.6 1.8 2.0 2.2 2.4 2.6 2.8 log(VMR), in-situ 1.4 1.6 1.8 2.0 2.2 2.4 2.6 2.8 log(VMR), MOPITT
V6N: 800 hPa
r = 0.83 bias = 5.1 % sdev = 7.3 %
1.4 1.6 1.8 2.0 2.2 2.4 2.6 2.8 log(VMR), in-situ 1.4 1.6 1.8 2.0 2.2 2.4 2.6 2.8 log(VMR), MOPITT V6N: Surface
r = 0.96 bias = 5.9 % sdev = 9.2 %
0 1•1018 2•1018 3•1018 4•1018
CO total column, in-situ 0
1•1018
2•1018
3•1018
4•1018
CO colm, MOPITT
V6N: Column
r = 0.86 bias = 0.12 (1018
) sdev = 0.18 (1018
)
AMTD
7, 6113–6139, 2014The MOPITT Version 6 product
M. N. Deeter et al.
Title Page Abstract Introduction Conclusions References Tables Figures ◭ ◮ ◭ ◮ Back Close
Full Screen / Esc
Printer-friendly Version Interactive Discussion Discussion P a per | Discus sion P a per | Discussion P a per | Discussion P a per
1.4 1.6 1.8 2.0 2.2 2.4 2.6 2.8 log(VMR), in-situ 1.4 1.6 1.8 2.0 2.2 2.4 2.6 2.8 log(VMR), MOPITT
V6J: 200 hPa
r = 0.68 bias = 3.4 % sdev = 18. %
1.4 1.6 1.8 2.0 2.2 2.4 2.6 2.8 log(VMR), in-situ 1.4 1.6 1.8 2.0 2.2 2.4 2.6 2.8 log(VMR), MOPITT
V6J: 400 hPa
r = 0.74 bias = -5.2 % sdev = 16. %
1.4 1.6 1.8 2.0 2.2 2.4 2.6 2.8 log(VMR), in-situ 1.4 1.6 1.8 2.0 2.2 2.4 2.6 2.8 log(VMR), MOPITT
V6J: 600 hPa
r = 0.85 bias = -2.4 % sdev = 14. %
1.4 1.6 1.8 2.0 2.2 2.4 2.6 2.8 log(VMR), in-situ 1.4 1.6 1.8 2.0 2.2 2.4 2.6 2.8 log(VMR), MOPITT
V6J: 800 hPa
r = 0.82 bias = 4.2 % sdev = 17. %
1.4 1.6 1.8 2.0 2.2 2.4 2.6 2.8 log(VMR), in-situ 1.4 1.6 1.8 2.0 2.2 2.4 2.6 2.8 log(VMR), MOPITT V6J: Surface
r = 0.93 bias = 8.9 % sdev = 18. %
0 1•1018 2•1018 3•1018 4•1018
CO total column, in-situ 0
1•1018
2•1018
3•1018
4•1018
CO colm, MOPITT
V6J: Column
r = 0.89 bias = 0.09 (1018)
sdev = 0.22 (1018
)
AMTD
7, 6113–6139, 2014The MOPITT Version 6 product
M. N. Deeter et al.
Title Page Abstract Introduction Conclusions References Tables Figures ◭ ◮ ◭ ◮ Back Close
Full Screen / Esc
Printer-friendly Version Interactive Discussion Discussion P a per | Discus sion P a per | Discussion P a per | Discussion P a per
1.4 1.6 1.8 2.0 2.2 2.4 2.6 2.8 log(VMR), in-situ 1.4 1.6 1.8 2.0 2.2 2.4 2.6 2.8 log(VMR), MOPITT
V6T: 200 hPa H1
H2 H3
H4 H5
r = 0.97 bias = 1.5 % sdev = 7.7 %
1.4 1.6 1.8 2.0 2.2 2.4 2.6 2.8 log(VMR), in-situ 1.4 1.6 1.8 2.0 2.2 2.4 2.6 2.8 log(VMR), MOPITT
V6T: 400 hPa
r = 0.94 bias = -3.8 % sdev = 9.7 %
1.4 1.6 1.8 2.0 2.2 2.4 2.6 2.8 log(VMR), in-situ 1.4 1.6 1.8 2.0 2.2 2.4 2.6 2.8 log(VMR), MOPITT
V6T: 600 hPa
r = 0.93 bias = -4.8 % sdev = 11. %
1.4 1.6 1.8 2.0 2.2 2.4 2.6 2.8 log(VMR), in-situ 1.4 1.6 1.8 2.0 2.2 2.4 2.6 2.8 log(VMR), MOPITT
V6T: 800 hPa
r = 0.95 bias = -2.0 % sdev = 9.9 %
1.4 1.6 1.8 2.0 2.2 2.4 2.6 2.8 log(VMR), in-situ 1.4 1.6 1.8 2.0 2.2 2.4 2.6 2.8 log(VMR), MOPITT V6T: Surface
r = 0.97 bias = 0.7 % sdev = 7.9 %
0 1•1018 2•1018 3•1018 4•1018
CO total column, in-situ 0
1•1018
2•1018
3•1018
4•1018
CO colm, MOPITT
V6T: Column
r = 0.96 bias = -0.02 (1018
) sdev = 0.10 (1018
)
AMTD
7, 6113–6139, 2014The MOPITT Version 6 product
M. N. Deeter et al.
Title Page
Abstract Introduction
Conclusions References
Tables Figures
◭ ◮
◭ ◮
Back Close
Full Screen / Esc
Printer-friendly Version
Interactive Discussion
Discussion
P
a
per
|
Discus
sion
P
a
per
|
Discussion
P
a
per
|
Discussion
P
a
per
2000 2002 2004 2006 2008 2010 2012 2014 -0.4
-0.2 0.0 0.2 0.4
log(VMR) bias
Bias Drift = 0.78 +/- 0.10 %/yr V6T: 200 hPa
2000 2002 2004 2006 2008 2010 2012 2014 -0.4
-0.2 0.0 0.2 0.4
log(VMR) bias
Bias Drift = 0.70 +/- 0.14 %/yr V6T: 400 hPa
2000 2002 2004 2006 2008 2010 2012 2014 -0.4
-0.2 0.0 0.2 0.4
log(VMR) bias
Bias Drift = -0.35 +/- 0.12 %/yr V6T: 600 hPa
2000 2002 2004 2006 2008 2010 2012 2014 -0.4
-0.2 0.0 0.2 0.4
log(VMR) bias
Bias Drift = -0.57 +/- 0.11 %/yr V6T: 800 hPa
2000 2002 2004 2006 2008 2010 2012 2014 -0.4
-0.2 0.0 0.2 0.4
log(VMR) bias
Bias Drift = -0.16 +/- 0.11 %/yr V6T: Surface
2000 2002 2004 2006 2008 2010 2012 2014 -1.0
-0.5 0.0 0.5 1.0
CO total column bias
Drift = 0.003 +/- 0.001 (1018
) mol/cm2
/yr V6T: Column
AMTD
7, 6113–6139, 2014The MOPITT Version 6 product
M. N. Deeter et al.
Title Page
Abstract Introduction
Conclusions References
Tables Figures
◭ ◮
◭ ◮
Back Close
Full Screen / Esc
Printer-friendly Version
Interactive Discussion
Discussion
P
a
per
|
Discus
sion
P
a
per
|
Discussion
P
a
per
|
Discussion
P
a
per
2000 2002 2004 2006 2008 2010 2012 2014 -0.4
-0.2 0.0 0.2 0.4
log(VMR) bias
Bias Drift = -0.11 +/- 0.10 %/yr V6N: 200 hPa
2000 2002 2004 2006 2008 2010 2012 2014 -0.4
-0.2 0.0 0.2 0.4
log(VMR) bias
Bias Drift = -0.19 +/- 0.15 %/yr V6N: 400 hPa
2000 2002 2004 2006 2008 2010 2012 2014 -0.4
-0.2 0.0 0.2 0.4
log(VMR) bias
Bias Drift = -0.18 +/- 0.14 %/yr V6N: 600 hPa
2000 2002 2004 2006 2008 2010 2012 2014 -0.4
-0.2 0.0 0.2 0.4
log(VMR) bias
Bias Drift = -0.02 +/- 0.12 %/yr V6N: 800 hPa
2000 2002 2004 2006 2008 2010 2012 2014 -0.4
-0.2 0.0 0.2 0.4
log(VMR) bias
Bias Drift = -0.09 +/- 0.16 %/yr V6N: Surface
2000 2002 2004 2006 2008 2010 2012 2014 -1.0
-0.5 0.0 0.5 1.0
CO total column bias
Drift = -0.002 +/- 0.003 (1018
) mol/cm2
/yr V6N: Column
AMTD
7, 6113–6139, 2014The MOPITT Version 6 product
M. N. Deeter et al.
Title Page
Abstract Introduction
Conclusions References
Tables Figures
◭ ◮
◭ ◮
Back Close
Full Screen / Esc
Printer-friendly Version
Interactive Discussion
Discussion
P
a
per
|
Discus
sion
P
a
per
|
Discussion
P
a
per
|
Discussion
P
a
per
2000 2002 2004 2006 2008 2010 2012 2014 -0.4
-0.2 0.0 0.2 0.4
log(VMR) bias
Bias Drift = 1.64 +/- 0.19 %/yr V6J: 200 hPa
2000 2002 2004 2006 2008 2010 2012 2014 -0.4
-0.2 0.0 0.2 0.4
log(VMR) bias
Bias Drift = 1.08 +/- 0.18 %/yr V6J: 400 hPa
2000 2002 2004 2006 2008 2010 2012 2014 -0.4
-0.2 0.0 0.2 0.4
log(VMR) bias
Bias Drift = -0.72 +/- 0.15 %/yr V6J: 600 hPa
2000 2002 2004 2006 2008 2010 2012 2014 -0.4
-0.2 0.0 0.2 0.4
log(VMR) bias
Bias Drift = -1.27 +/- 0.18 %/yr V6J: 800 hPa
2000 2002 2004 2006 2008 2010 2012 2014 -0.4
-0.2 0.0 0.2 0.4
log(VMR) bias
Bias Drift = -0.48 +/- 0.20 %/yr V6J: Surface
2000 2002 2004 2006 2008 2010 2012 2014 -1.0
-0.5 0.0 0.5 1.0
CO total column bias
Drift = 0.003 +/- 0.002 (1018
) mol/cm2
/yr V6J: Column
AMTD
7, 6113–6139, 2014The MOPITT Version 6 product
M. N. Deeter et al.
Title Page
Abstract Introduction
Conclusions References
Tables Figures
◭ ◮
◭ ◮
Back Close
Full Screen / Esc
Printer-friendly Version
Interactive Discussion
Discussion
P
a
per
|
Discus
sion
P
a
per
|
Discussion
P
a
per
|
Discussion
P
a
per
-0.3 -0.2 -0.1 0.0 0.1 0.2 0.3 log(VMR) Error
-90 -60 -30 0 30 60 90
Latitude
V6T: 200 hPa H1
H2 H3
H4 H5
-0.3 -0.2 -0.1 0.0 0.1 0.2 0.3 log(VMR) Error
-90 -60 -30 0 30 60 90
Latitude
V6T: 400 hPa
-0.3 -0.2 -0.1 0.0 0.1 0.2 0.3 log(VMR) Error
-90 -60 -30 0 30 60 90
Latitude
V6T: 600 hPa
-0.3 -0.2 -0.1 0.0 0.1 0.2 0.3 log(VMR) Error
-90 -60 -30 0 30 60 90
Latitude
V6T: 800 hPa
-0.3 -0.2 -0.1 0.0 0.1 0.2 0.3 log(VMR) Error
-90 -60 -30 0 30 60 90
Latitude
V6T: Surface
-6•1017 -4•1017 -2•1017 0 2•1017 4•1017 6•1017
Total Column Error -90
-60 -30 0 30 60 90
Latitude
V6T: Column