Capture, Movement, Trade, and
Consumption of Mammals in Madagascar
Kim E. Reuter1*, Haley Randell1, Abigail R. Wills2, Totozafy Eric Janvier3, Tertius Rodriguez Belalahy3, Brent J. Sewall1
1Temple University, Department of Biology, Philadelphia, Pennsylvania, United States of America,
2Mpingo Conservation & Development Initiative, Kilwa Masoko, Tanzania,3Département des Sciences de la Nature et de l’Environnement, Université d’Antsiranana, Antsiranana, Madagascar
Abstract
Wild meat trade constitutes a threat to many animal species. Understanding the commodity chain of wild animals (hunting, transportation, trade, consumption) can help target conser-vation initiatives. Wild meat commodity chain research has focused on the formal trade and less on informal enterprises, although informal enterprises contribute to a large portion of the wild meat trade in sub-Saharan Africa. We aimed to provide a more comprehensive understanding of the formal and informal components of these commodity chains by focus-ing on the mammalian wild meat trade in Madagascar. Our objectives were to: (1) identify hunting strategies used to capture different wild mammals; (2) analyze patterns of move-ment of wild meat from the capture location to the final consumer; (3) examine wild meat prices, volumes, and venues of sale; and (4) estimate the volume of wild meat consumption. Data were collected in May-August 2013 using semi-structured interviews with consumers (n = 1343 households, 21 towns), meat-sellers (n = 520 restaurants, open-air markets stalls, and supermarkets, 9 towns), and drivers of inter-city transit vehicles (n = 61, 5 towns). We found that: (1) a wide range of hunting methods were used, though prevalence of use dif-fered by animal group; (2) wild meat was transported distances of up to 166 km to consum-ers, though some animal groups were hunted locally (<10 km) in rural areas; (3) most wild meat was procured from free sources (hunting, gifts), though urban respondents who con-sumed bats and wild pigs were more likely to purchase those meats; and (4) wild meat was consumed at lower rates than domestic meat, though urban respondents consumed wild meat twice as much per year compared to rural respondents. Apart from the hunting stage, the consumption and trade of wild meat in Madagascar is also likely more formalized than previously thought.
Introduction
Consumption of wild meat is important for nutritional [1,2] and cultural reasons [3]. However, it also constitutes a threat to many animal species [4] especially wild mammals [5]. In the
OPEN ACCESS
Citation:Reuter KE, Randell H, Wills AR, Janvier TE, Belalahy TR, Sewall BJ (2016) Capture, Movement, Trade, and Consumption of Mammals in Madagascar. PLoS ONE 11(2): e0150305. doi:10.1371/journal.pone.0150305
Editor:Karen E. Samonds, Northern Illinois University, UNITED STATES
Received:October 17, 2015
Accepted:February 11, 2016
Published:February 29, 2016
Copyright:© 2016 Reuter et al. This is an open access article distributed under the terms of the
Creative Commons Attribution License, which permits unrestricted use, distribution, and reproduction in any medium, provided the original author and source are credited.
Congo Basin alone, up to 4.5 million tonnes of wild meat are consumed per year [6] and hunt-ing occurs at a rate six times higher than is sustainable [7]. Growing urban populations and increasing consumer affluence has increased demand for wild meat across sub-Saharan Africa [8]. This has depleted wild animal populations and increased wild meat prices [8]. Increased sale prices and market demand encourage hunters to switch to more efficient hunting methods [3]. In addition, as habitats near large urban markets become depleted of wildlife [8], hunters partner with a series of formal and informal actors to transport and sell wild meat to consumers at distances far removed from the hunting location [7,9]. An understanding of how wild ani-mals are hunted, and how wild meat is moved, traded, and consumed using formal and infor-mal enterprises—referred to as the commodity chain for wild meat—is needed to safeguard species from unsustainable hunting [4,10].
Past commodity-chain research suggests that the links between hunters and consumers are often well developed [4,5,10], though the length of the chain—the number of actors who move the wild animal from its natural habitat to the consumer—can differ [5]. In general, there are four principal stages in the process of moving wild meat through the commodity chain: (1) the hunting of wild animals or their live capture (followed by killing at a later stage); (2) the trans-port of the animal (body parts or the whole animal either dead or alive) away from the capture location to the point of exchange or consumption [3,4,10]; (3) exchange of wild meat or the live animal with transporters, other traders, or consumers via sale [1,3,4], via barter for non-monetary goods or to acquire social favors, or via gifting to relatives or friends; and (4) con-sumption for nutritional [1,2] or cultural reasons [3]. Consumption is the most-studied stage of the commodity chain and has been examined across Africa [11,12], Asia [13], and South America [6]; the other three stages are less well understood.
Past research on wild meat commodity chains has focused on Central and West Africa, where the trade is relatively formalized (involving a consistent set of actors and established ven-ues). Accordingly, most past research has focused on the formal trade [5] rather than examin-ing informal enterprises (small businesses that lack large capital investments, that may be ephemeral, or that exist outside government oversight) [14]. However, informal sectors account for over 50% of the GDP and employment in many African countries [14]. Moreover, most wild meat is illegally extracted [3] and is traded via informal enterprises [14]. Similarly, the emphasis of past studies has been on measuring the flow of goods that have market value [5], and have focused less on barter, gifts, and non-market exchanges of wild meat. Thus, excluding informal and non-market exchanges may lead to an incomplete understanding of the commodity chain in areas such as Madagascar, that have a less organized wild meat trade, where there are often household-to-household sales [15,16], where most wildlife biomass (66%) in rural areas is hunted illegally [16], and where people are known to barter wild meat for other items. A study of Madagascar could provide a more comprehensive understanding of commodity chains for wild meat, including informal and non-market exchange. Such study could also prove beneficial for conservation because hunting of Madagascar’s highly endemic mammal taxa may be unsustainable for lemurs [15], fosa [15], and bats [17], and because polit-ical instability following a 2009 coup d’état may have further increased trading volume [18].
Past research has clarified some basic elements of Madagascar’s wild meat commodity chain. A diversity of taxa are hunted (including protected species), hunting occurs throughout the year including outside established seasons in game animals, and a wide variety of hunting and capture methods are employed [19,20,21]. The sparse data available from Madagascar [19,22] suggest wild meat is transported only short distances from hunting locations (4.40 ± 2.90 km [15]; 15 km [23]), perhaps because—unlike in other sub-Saharan countries [4]–wild meat in Madagascar is usually sold fresh and not smoked. Wild meat is sold for<1–7
USD/kg in rural areas of the country [16,24], with preferred wild meat costing more, and less because respondents provided information about
potentially illegal activities and did so on the condition of anonymity. However, data from the study can be provided to interested parties in aggregated formats on a case-by-case basis. The authors are open to requests for data and can always try to accommodate requests as best as possible. To request aggregated data, please contact the corresponding author (KER) [email protected].
Funding:This material is based upon work supported by the National Science Foundation Graduate Research Fellowship under Grant No. (DGE-1144462) to KER (https://www.nsfgrfp.org), a National Science Foundation grant (DEB-1257916) to BJS (http://www.nsf.gov/funding/), an Explorers Club Grant to KER (https://explorers.org/expeditions/ funding/expedition_grants), and a Temple University Faculty Senate grant to BJS (https://www.temple.edu/ research/facinitiatives/facini_int_funding.html). The funders had no role in study design, data collection and analysis, decision to publish, or preparation of the manuscript.
Competing Interests:The authors have declared
preferred wild meats costing less than, domestic meat [21]. Consumption of wild meat is con-sumed occasionally; most households (95%)[15] and most people (60%)[25] consume wild meat at least once a year though it appears in just 1.3% of meals [26]. It is not clear how the commodity chain varies by animal taxa or between rural and urban areas in Madagascar.
Our aim in this study was to improve understanding of the formal and informal commodity chain for wild meat in Madagascar (Fig 1). Our objectives were to: (1) identify the principal methods used to hunt wild animals of different groups and the timing of hunting; (2) analyze the patterns of movement of different types of wild meat from the capture location to the final consumer; (3) examine the prices, volumes, and venues of sale of wild meats; and (4) estimate the volume of wild meat consumed. For objectives 2–4, we used the movement, sale, and con-sumption of domestic meat—i.e., meat from animals like zebu (a subspecies of cattle found in Madagascar), chickens, and pigs that were raised by farmers or ranchers—as a point of refer-ence for comparison with wild meat.
For our first objective, we determined hunting methods and timing. We hypothesized that hunting methods would: (1A) differ between urban and rural respondents due to the different resources available to hunters in each setting; (1B) differ before and after 2009, due to reports
Fig 1. Urban towns in central and northern Madagascar where interviews were conducted.The shaded rectangle shows the location of rural towns (in the vicinity of the Ankarana National Park) where interviews were conducted but exact locations are not shown to protect respondent anonymity. Figure originally published in Reuter et al. 2015 [27].
of decreased enforcement on hunting following a political coup d’état [18]; (1C) focus on sling-shots, spears, and other less-efficient tools when wild meat was for personal consumption; (1D) focus on nets, firearms, and other highly-efficient tools when wild meat was for sale. In addition, we hypothesized that the timing of hunting would: (1E) be year-round for all animals except for tenrecs, which estivate for a portion of the year [24]; and (1F) that rural respondents would be more likely than urban ones to report year-round hunting, given the potential of rural respondents for living in closer proximity to remnant animal habitats. For the same rea-son, we also hypothesized that (1G) the proportion of consumers who directly hunted wild meat would be lower in larger towns.
Our second objective was to describe the patterns of movement of wild meat from its cap-ture location to the final consumer, including differences by location and animal group (Con-ceptualized inFig 2). Given the short transport distances found in past studies [15,23], we hypothesized (2A) that wild meat would generally be sourced locally. We also hypothesized that (2B) some animal groups that are attracted to human-dominated landscapes would be hunted in close proximity to towns (e.g., wild cats [15]), whereas (2C) other groups of animals (e.g., lemurs) that avoid human-dominated landscapes would be hunted farther away. How-ever, because less forest habitat for wild animals may be present near large towns, we hypothe-sized that (2D) the transport distance would increase with a town’s population. In addition, because domestic meat is often raised near human settlements and habitats of wild animals may be remote from towns, we hypothesized that (2E) wild meat would be sourced at greater distances than domestic meat. Finally, given that most wild meat is caught illegally in Madagas-car [16], we hypothesized that to avoid drawing attention to illegal wild meat, (2F) the volume of wild meat transported on the inter-city transit system would be low.
Fig 2. Conceptual commodity chain models (A) and the sources from which consumers procure wild meat (B).The commodity chain (A) is not always linear and does not always include all actors; for example, in some cases, the consumer is also the hunter. In image (B) there are two tiers of arrows; the arrows that connect peripheral boxes to the“purchase”and“free”boxes represent direct quantities measured (black arrows) while the arrows connecting the“purchase”and“free”boxes to the consumer represent sums of the peripheral boxes of each type (gray arrows).
Our third objective was to examine the prices, volumes, and venues of sale of wild meats, rel-ative to domestic meat. We hypothesized that due to increased distances and costs of transport of wild meat in towns with higher populations [8] and increased costs of living in larger towns, (3A) prices would be positively correlated with the population of a town. Based on the urban meat price estimates [21] we hypothesized that (3B) average prices of wild and domestic meat would be similar, but that wild meat prices would vary by animal group (bat meat would be cheaper than domestic meat; wild pig meat would be the same price as domestic meat; tenrec meat would be more expensive than domestic meat). In addition, we hypothesized (3C) that the cost of wild meat would differ depending on the source from which it was purchased. Specifi-cally, due to profit-taking by middlemen, we hypothesized that (3D) the per-unit price paid by the consumer would increase when wild meat was not purchased directly from the hunter. In terms of the volume of sale, given that most wild meat is caught illegally in Madagascar [16], we hypothesized that to avoid drawing attention to a potentially illegal activity, wild meat would be (3E) sold less at markets than domestic meat and (3F) traded less frequently through established venues than domestic meat. In addition, because wild meat hunting may require specialized methods, tools, or knowledge, or access to remnant forest habitats, and because of past research suggesting substantial portions of wild meat are sold to markets and restaurants [21], we hypothesized that (3G) most consumers would obtain wild meat from a third party rather than hunting it themselves. Finally, because impacted habitats near larger towns might increase the logistics and distance associated with obtaining wild meat by urban consumers, we hypothesized (3H) that the proportion of wild meat purchased from a middleman (rather than hunted by the consumer or purchased directly from the hunter) would increase with the population of a town.
Our fourth objective was to estimate the relative volume of consumption of wild meat. Given that price [16] and preference [21] differ by animal and impact the likelihood of con-sumption, we hypothesized that (4A) the volume of consumption would differ by animal group. In addition, given that regular consumption of wild meat is low in Madagascar [21,26] we hypothesized that (4B) the volume of consumption would be lower in wild meat that in domestic meat for all animal groups.
Methods
Study site
Data were collected (May-August 2013) at twelve urban and nine rural towns in central and northern Madagascar (Table 1). Urban towns were located along the 1,092 km-long highway connecting the northern regional capital Antsiranana with the national capital Antananarivo, located in the center of the country (Fig 1). Rural towns were located around the perimeter of Ankarana National Park, a large protected area (18220 ha) next to this highway that contains one of the world’s highest densities of primates [28].
Legality of wild meat hunting and consumption in Madagascar
Hunting in Madagascar is regulated using legal instruments, with the right to hunt belonging to the state and allowed through a permit-based hunting system [30]. Regulations restrict the species that can be hunted, hunting methods, and hunting seasons; they also prohibit the pos-session, transport, sale, and export of illegally acquired animals (S1 Appendix).
Research permissions
authorization of the Madagascar Ministry of Water and Forests and Madagascar National Parks. Permission to conduct research was also gained in each town from the highest ranking, locally elected official. Verbal informed consent was secured from all research participants prior to the onset of data collection; the Institutional Review Board approved the use of verbal consent. Written consent was not obtained due to concerns with literacy levels in the respon-dent pool. Verbal consent was documented during the administration of the interview; inter-views were not administered without verbal consent.
Social surveys
Data were collected from the following actors of the commodity chain: (1) hunters (informal enterprises); (2) inter-city transporters (formal enterprises); (3) meat-sellers (both formal and informal enterprises; open-air markets, restaurants, and supermarkets); (4) and consumers. No hunters reported obtaining a permit or regularly selling wild meat; thus all of the hunters inter-viewed were considered part of the informal trade. In this study, a‘restaurant’was any business
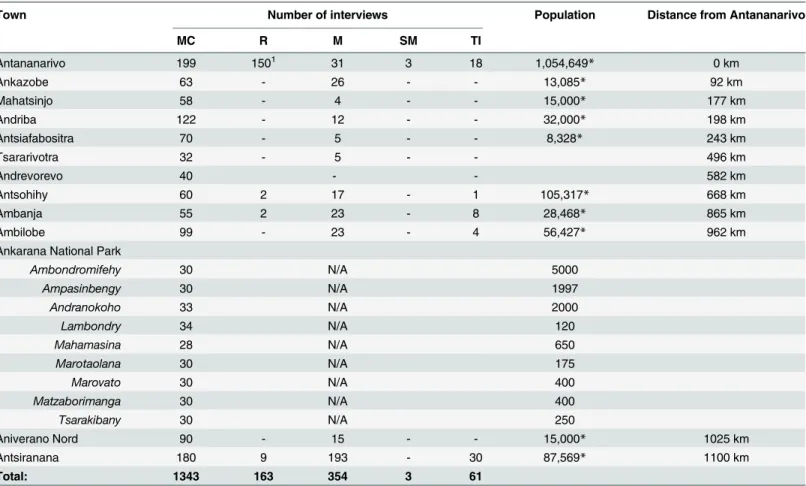
Table 1. Table of study sites included in research project.
Town Number of interviews Population Distance from Antananarivo
MC R M SM TI
Antananarivo 199 1501 31 3 18 1,054,649
* 0 km
Ankazobe 63 - 26 - - 13,085* 92 km
Mahatsinjo 58 - 4 - - 15,000* 177 km
Andriba 122 - 12 - - 32,000* 198 km
Antsiafabositra 70 - 5 - - 8,328* 243 km
Tsararivotra 32 - 5 - - 496 km
Andrevorevo 40 - - 582 km
Antsohihy 60 2 17 - 1 105,317* 668 km
Ambanja 55 2 23 - 8 28,468* 865 km
Ambilobe 99 - 23 - 4 56,427* 962 km
Ankarana National Park
Ambondromifehy 30 N/A 5000
Ampasinbengy 30 N/A 1997
Andranokoho 33 N/A 2000
Lambondry 34 N/A 120
Mahamasina 28 N/A 650
Marotaolana 30 N/A 175
Marovato 30 N/A 400
Matzaborimanga 30 N/A 400
Tsarakibany 30 N/A 250
Aniverano Nord 90 - 15 - - 15,000* 1025 km
Antsiranana 180 9 193 - 30 87,569* 1100 km
Total: 1343 163 354 3 61
The number of interviews completed at each study site are listed by interview type. The distance of population centers from Antananarivo are listed; Antananarivo was the southernmost population center included in this study while Antsiranana was the northernmost. Population estimatesflagged with (*) are estimates retrieved from the Ilo database [29]. All other estimates were provided by locally elected officials. MC: meat consumption interview; R: restaurants; M: open-air markets; SM: supermarkets; TI: transportation interviews.
1150 restaurants were approached (105 in person and 45 by phone) for information regarding their history of wild meat; 140 restaurants had never sold wild meat and provided no additional information and 10 restaurants were given a full meat-seller interview.
that sold prepared foods for consumption, including Malagasy-owned restaurants targeting Malagasy customers referred to asgargottesorhotelyand the more expensive Malagasy and expatriate-owned restaurants targeting wealthier Malagasy individuals and foreigners. Meat-sellers involved in formal enterprises included the more expensive restaurants, some of the largerhotely, the supermarkets, and the permanent open-air market stands, whereas meat-sell-ers involved in informal enterprises included the smallerhotelyand the intermittent open-air market stands (e.g., those only open on some market days).
Data were collected using three semi-structured interviews [31] with three protocols and respondent groups: (1) meat consumption interviews with members of the community; (2) meat-seller interviews targeted to employees at meat selling venues; and (3) transportation interviews targeted to employees of inter-city transportation companies (bus and boat). Data from hunters were collected through the meat consumption interviews; all interviewees were asked how they sourced their wild meats (including hunting) and whether they ever sold wild meat (Questions 1, 1a, and 1c in Meat Consumption Interviews,S2 Appendix). All surveys were administered by research teams composed of two individuals, including one lead
researcher (KER, AW, HG) and one translator (TEJ, TRB). Surveys were administered orally in the interviewees’language of choice (local Malagasy dialect or French). Face-to-face recruit-ment was used to enroll respondents into the study. Verbal informed consent was always received prior to the onset of data collection. To protect respondent anonymity, no identifying information was collected.
Meat consumption interviews were administered at select households in each town. In rural towns (range: 120–5,000 inhabitants) every 5thhousehold was sampled. In urban towns (range: 6,622–1,054,649 inhabitants) random sampling was stratified by administrative unit. To ensure independence of samples, interviews were requested with one person per household. Respon-dents included both males and females, were 18 years or older, and considered themselves to have a major buying power for household goods. If an eligible individual refused or if no one was present, an adjacent household was approached. Meat consumption interviews lasted an average of 11 ± 0.27 minutes (± 95% CI), and 1343 people were interviewed (Table 1); we had no prior knowledge of respondents’histories of hunting and consuming wild meat.
The meat consumption interviews were designed to collect data on meat consumption hab-its (Questionnaire inS2 Appendix). In the first section, respondents were asked to discuss any type of meat consumption and provide information (including data on hunting, purchasing and other attainment methods) about recent (within the last three days) meat consumption and preferred meat types. In the second section, respondents were asked questions regarding their history of wild meat consumption (amount, species, preference), sources of wild meat (e.g. hunting or purchase), and the circumstances of consumption. In the third section, respon-dents were asked about any changes in their wild and domestic meat consumption as well as meat-related taboos.
in every permanent open-air market in the city. In the largest town of Antananarivo, a few meat-sellers (n = 1–5) were sampled randomly from major open-air markets in 14 quarters, spread evenly across the city. These quarters represented a wide range of communities, includ-ing areas of different ethnic, religious, and socioeconomic characteristics. We also opportunis-tically sampled three supermarkets (enclosed, upscale food stores with diverse merchandise) in Antananarivo.
In all towns except Antananarivo, knowledge derived from meat-sellers at open-air markets and meat consumption interviews was then used to identify restaurants with a prior history of selling wild meat. In Antananarivo, the size of the city and number of restaurants precluded the use of interview responses as the sole source of information about restaurants selling wild meat. We therefore visited 105 restaurants across 10 quarters and made telephone contact with an additional 45 restaurants spread across the city. After obtaining informed consent, we asked respondents from these Antananarivo restaurants if wild meat had ever been sold at the restau-rant. If the respondent indicated the restaurant had never sold wild meat (n = 140), we ended the interview. For all others (n = 10), we completed the standard meat-seller interview.
For all types of meat-sellers in all towns, we ensured independence of samples by selecting only one worker per establishment for an interview; this was the proprietor or manager or their designee. Full meat-seller interviews (excluding initial contacts with restaurants in Antanana-rivo that did not result in a full meat-seller interview) lasted an average of 8 ± 0.26 minutes and we interviewed representatives from a total of 354 open-air markets, 3 supermarkets, and 163 restaurants (Table 1). Questions included: recent meat sales (species, volume, rate, and price of sale during the previous three days); lifetime sale of wild meat; methods for attaining meat (hunting, purchasing, or other methods; meat-related food taboos; and changes in type or rate of meat sales over time (Questionnaire inS2 Appendix).
Finally, transportation interviews were conducted in a few (n = 5) of the larger towns, to understand how domestic and wild meats were moved between towns. Interviews were con-ducted with boat and bush taxi drivers at major bus stations and ports (Table 1). Transporta-tion interviews lasted an average of 8 ± 0.01 minutes, and 61 people were interviewed
(Table 1). Respondents were asked to quantify the amount of meat transported within the last three days (including information about departure and destination points, as well as any fees associated with transportation) and their lifetime history of wild meat transportation (Ques-tionnaire inS2 Appendix).
Pilot interviews (for all interview types) indicated that respondents typically could not iden-tify exact species (neither from photographs nor by name) and did not always categorize ani-mals as they might be categorized by scientists (e.g., by family and by genus). However, the general public could differentiate between broader animal groups. Therefore, and based on the feedback from the respondents in the pilot interviews, data were aggregated into the following mammal groups which are most identifiable to the Malagasy general public: lemurs (Lemuroi-dea), bats (Chiroptera), tenrecs (Tenrecinae), fosa (Cryptoprocta ferox), mongoose (Eupleri-dae), rats and mice (Rodentia), civets (Viverridae and Eupleri(Eupleri-dae), wild cat (Felis silvestris), and wild pig (Potamochoerus larvatus).
Madagascar found that recalls of the prior year were more accurate than extrapolation of recalls of the prior month [33]. Third, the time frame of the study was limited (surveys conducted over a four-month time period; some questions used a 3-day recall period). However, many survey questions were phrased in a way to collect data about respondents’interactions with wild meat throughout the year (seeS2 Appendix). It should be noted that questions generally utilized a 3-day diet recall when it was likely that respondents would not be able to accurately provide data for a longer time period (e.g., respondents would not be able to state how many times in their lifetime they had consumed chicken; diet recall in Madagascar for non-rare food-related events decreases substantially after three days [26]). The geographic scope of the study prohibited data collection over multiple time points. In contrast, much of the data presented here is based on questions that asked respondents to describe their lifetime consumption pat-terns. It should be noted that we conducted interviews during the time of year when food is rel-atively abundant. Therefore, under the assumption that wild meat is consumed more in times of food scarcity, and if our interview period did affect respondents’responses, then we would assume that the data presented in this study are conservative estimates.
Analysis
Results are presented as means with 95% confidence intervals and towns are replicates unless otherwise noted (when n<20). All analyses were completed using JMP statistical software
(JMP, Version 10. SAS Institute, Cary, NC, 1989–2007).
For objective one, Pearson’s Chi-squared Tests were used when n>1000 and Fisher’s Exact
Tests were used when n<1000 in analyses of hunting methods (hypotheses 1A-1D). A
Bonfer-roni correction was used when determining significance in multiple post-hoc tests to maintain experiment-wise error at an alpha level of 0.05. Data were eliminated from analyses in 16 cases where respondents were not clear whether they used a slingshot or a firearm.
For hypothesis (1E), respondents were not asked directly whether they hunted within a spe-cific season, but many volunteered an explicit time. We used these data to analyze seasonality of hunting by quarter of the year in which most hunting took place (Quarter 1: January—
March; Quarter 2: April—June; Quarter 3: July—September; Quarter 4: October—December). In most towns, Quarters 1 and 4 are warmest and receive the most rain, while Quarter 3 is the coolest and has the least rain, and Quarter 2 is intermediate. For hypothesis (1G), we regressed the natural log of town population against the arcsine transformed percentage of respondents consuming wild meat; towns were replicates.
For objective two, when the source location of a meat was a known town or landmark located on a road, the distance between that location and a respondent’s town of residence was calculated from satellite images and maps using the shortest route along the country’s road network. When the source location was not on a road, the distance was the sum of the shortest route along roads to the closest point, and the direct overland distance from that point to the source location (with-out considering walking trails, which could not be detected in the satellite images and maps). When a single respondent listed more than one source location, distances were averaged for that respondent. For hypotheses (2D) and (2E), a mixed effects model was used with the natural log of
‘town population’,‘type of meat’(i.e. wild or domestic), and‘animal group’(nested within‘type of meat’) as the fixed effects,‘town’as the random effect, and the natural logarithm of distance to purchase location (in km) as the response. For wild meat, we also separately examined a model with the natural log of‘town population’and‘animal group’as the fixed effects,‘town’as the ran-dom effect, and the natural logarithm of distance to hunting location (in km) as the response.
responses from meat consumption interviews to estimate wild meat prices (S4 Table). Only price data provided by respondents referring to recent purchases (during 2012 and 2013) were used to decrease inaccuracies from incorrect information recall over longer time periods. For hypothesis (3B) a mixed effects model was used with‘type of meat’(i.e. wild or domestic) and
‘animal group’(nested within‘type of meat’) as fixed effects,‘town’and‘unit of purchase’(i.e. whether the purchase was of a whole animal, kilogram of meat, or plate of meat at a restaurant) as random effects, and the natural log of the price of meat (Malagasy Ariary) as the response. For hypothesis (3C) a mixed effects model was used with‘purchase venue’(i.e. hunter, open-air market, restaurant, or middleman) as the fixed effect,‘town’,‘animal group’, and‘unit of purchase’as random effects, and the natural log of the price of meat (Malagasy Ariary) as the response. For hypothesis (3H), we regressed the natural log of town population against the arc-sine transformed percentage of consumers buying wild meat from middlemen; towns were replicates.
For objective four, hypotheses (4A) and (4B) used a mixed effects model with‘type of meat’
(i.e. wild or domestic meat), and‘animal group’nested within‘type of meat’as the fixed effects,
‘town’as the random effect, and the natural log of consumption frequency (number of times consumed per year) as the response.
Results
Capture/hunting of wild animals (objective one)
Respondents to the meat consumption interviews (n = 1343) across all towns reported 1463 records of hunting animals, of which 84% provided information about the hunting method(s) used. Many urban and rural respondents (54 ± 10% and 46 ± 23%, towns as replicates) had hunted a wild animal at least once in their lifetimes.
The most popular hunting method included tracking and capturing the animal with a dog (33%, individuals are replicates), followed by: catching with a trap/net (21%); catching with bare hands, alone or with other people (17%); striking with a rock hurled from a slingshot or thrown (11%); hitting with a stick or stabbing with a spear (10%); shooting with a firearm (3%); felling the tree in which the animal was hiding (2%); digging up the animal’s burrow (1%); and darting with a blow tube or spit tube (<1%). Hunting methods differed significantly
by animal group (Pearson’s Chi-Squared Test,χ2= 1257.331, p<0.0001;Fig 3). Lemurs were
the only animals hunted by cutting down the entire tree; this hunting strategy was often associ-ated with hollow-dwelling nocturnal lemurs. Tenrecs were the only animals hunted by digging up their burrows.
In accordance with hypothesis (1A), hunting methods differed between urban and rural respondents (Pearson’s Chi-Squared Test,χ2= 215.107, p<0.0001;Fig 3). Some methods/
tools were reported exclusively by respondents living in urban areas: blow tubes (n = 8), fire-arms (n = 32), cutting down trees (n = 29), and digging up burrows (n = 14). Some animal groups were hunted using different methods when urban respondents hunted them, as opposed to rural respondents, including: 1) bats (post-hoc Fisher’s Exact Test, p<0.0001); 2)
lemurs (p<0.0001); 3) tenrecs (p<0.0001); 4) and wild pigs (p<0.0001). Sample sizes were
too small to test fosa and mongoose, and there was no difference in how wild cats or civets were hunted.
There was mixed support for hypothesis (1B). When all hunting reports were aggregated, the type of hunting method differed in the pre-2009 period and the 2009 to mid-2013 period (Pearson’s Chi-Squared Test,χ2= 64.455, p<0.0001). However, there was no significant shift
Forty-three individuals across ten urban and four rural towns had caught wild meat for commercial purposes themselves (8 ± 3% of people in towns where at least one individual had caught wild meat for sale). Most individuals had only caught and sold one type of wild meat, though five (12% of n = 43) had caught and sold two different types of wild meat, thereby pro-viding 48 records of wild meat hunting for commercial reasons. In accordance with hypotheses (1C, 1D) there was a difference between the hunting methods used when an animal was caught for personal consumption compared to sale (Fisher’s Exact Test, p<0.0001;Fig 5). Though
sample sizes were too small to examine statistically the differences in hunting methods within individual animal groups, some animals captured for resale tended to be caught using more
Fig 4. Hunting methods used pre-2009 and between 2009–2013 for (A) urban- and (B) rural hunters (percentages).Data taken from meat consumption interviews. Only animal groups with5 respondents in each time class are presented. Individuals are replicates. Hands = catching with hands by one or multiple people. Trap/Net = includes nets, cable traps, bait with traps. Spit Tube = a blow tube or a device to shoot darts. Stick = includes hitting animal with stick or spearing animal with stick. Individuals are replicates. Other = includes other hunting methods (e.g. fire, using a cross bow).
doi:10.1371/journal.pone.0150305.g004
Fig 3. Hunting methods used to capture wild mammals by urban (1A) and rural (1B) respondents (percentages).Individuals are replicates; data taken from meat consumption interviews. Hands = catching with hands by one or multiple people. Trap/Net = includes nets, cable traps, bait with traps. Spit Tube = a blow tube or a device to shoot darts. Stick = includes hitting animal with stick or spearing animal with stick. Individuals are replicates. Other = includes other hunting methods (e.g. fire, using a cross bow).
efficient methods than animals captured for personal consumption. In particular, bats caught for personal consumption were caught using nets proportionately less than bats caught for resale (Fig 5), and tenrecs captured for personal consumption were caught using a variety of methods while tenrecs caught for sale were almost always captured using dogs (Fig 5).
Of the 1463 hunting records, 259 (17.7%) referenced hunting during a specific time of the year (e.g. an informal or formal hunting season) for at least one animal group. In accordance with hypothesis (1E), tenrecs were the only group where over 10% of both urban and rural respondents (towns as replicates) mentioned a hunting season (S1 Fig), though in general for most animal groups, respondents reported hunting animals in the second (April-June) and fourth quarter (October-December) more than other times of the year (Fig 6). In contrast, although we did not ask meat-sellers whether hunting seasons impacted the sale of meat, a few respondents (at an open-air market in Antsiranana and at three restaurants in Antananarivo) noted that the third quarter (June-August) represented the season when wild pig meat was eas-ier to procure and sell. Contrary to hypothesis (1F), both urban and rural respondents reported hunting seasonally at similar proportions for each animal group (all Fisher’s Exact Tests, p>0.14; wild cat, mongoose, and fosa not tested due to small sample sizes). Finally, contrary
to hypothesis (1G), the percentage of consumers who directly hunted wild meat did not change with the population of a town (Regression, ln(population) = 0.05, F1,16= 1.3815, p = 0.24, R2=
0.01, towns as replicates with percentage of consumers arcsine transformed).
Fig 5. Comparison of hunting methods used to capture wild mammals for sale and for personal consumption (percentages).Individuals are replicates; data taken from meat consumption interviews. Hands = catching with hands by one or multiple people. Trap/Net = includes nets, cable traps, bait with traps. Spit Tube = a blow tube or a device to shoot darts. Stick = includes hitting animal with stick or spearing animal with stick. Individuals are replicates. Other = includes all other hunting methods (e.g. slingshots, fire, using a cross bow).
doi:10.1371/journal.pone.0150305.g005
Fig 6. Time of year when respondents hunt for different types of wild mammals (individuals are replicates).Sample sizes are listed for each animal group. Data taken from meat consumption interviews. Quarter 1: January-March; Quarter 2: April-June; Quarter 3: July-September; Quarter 4: October-December.
Movement of wild and domestic meat (objective two)
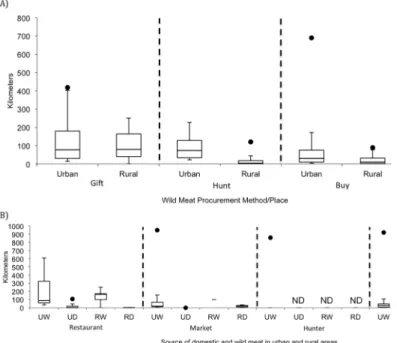
The 1343 respondents of the meat consumption interviews provided 1879 records of wild meat consumption and 1234 records of domestic meat consumption with information needed to cal-culate the distances traveled during the procurement of meat by consumers. Contrary to hypothesis (2A), wild meat obtained by urban respondents was often sourced from areas at an intermediate distance or far from (10–700 km) a respondent’s town of residence, whereas respondents in rural regions obtained wild meat more locally (Fig 7A;S1 Table). In contrast, data from the meat-seller interviews indicated wild meat sold in urban markets and restaurants tended to be sourced from areas close to or at an intermediate distance from those establish-ments (within 42 kilometers;S2 Table).
For hunting of wild meat, 42.0% of 1089 respondents from the meat consumption inter-views traveled to hunt wild meat. In accordance with hypotheses 2B and 2C, respondents were always least likely to travel to hunt animal groups that are attracted to human-dominated land-scapes (0% of respondents traveled beyond their home neighborhood to hunt rats; 25.7% trav-eled to hunt wild cats, 34.7% travtrav-eled to hunt civets), whereas the respondents were most likely to travel to hunt animal groups that avoid human-dominated areas (51.4% traveled to hunt lemurs). Of the cases where the respondent traveled to hunt wild meat, animal group was also an important predictor of distance traveled (Mixed Effects Model; ln(population) = 0.38, F1,
18.01= 30.74, p<0.0001; animal group, F7, 413= 4.33, p = 0.0001; R2= 0.36). Although
respon-dents traveled farther to hunt mongooses and bats than they traveled to hunt tenrecs and wild pigs, there were no differences evident among other animal groups, including those that were attracted to or avoid human-dominated landscapes (Tukey HSD post-hoc test). In addition, in accordance with hypotheses (2D) and (2E), a greater percentage of people traveled to purchase
Fig 7. Distances that meat was transported prior to consumption.Data taken from meat consumption interviews. Distances that meat was transported to, or that urban and rural consumers traveled, to (A) procure wild meat as a gift, from hunting, or purchase; and (B) domestic and wild meat purchased from restaurants, markets, hunters, and middlemen. The whiskers extend to data points within 1.5 times the interquartile range; black circles indicate outliers. Towns are replicates. ND: No Data; UW: Urban seller of wild meat; UD: Urban seller of domestic meat; RW: Rural seller of wild meat; RD: Rural seller of domestic meat.
wild meat (22.3% of 703 respondents purchasing wild meat traveled beyond their home neigh-borhood) than to purchase domestic meat (11.1% of 1234 respondents). Further, of those con-sumers who did travel, the distance traveled to purchase meat from any source (including restaurants, markets, hunters, and middlemen) was greater for wild meat than domestic meat, and the purchase distance increased more with the population of a town for wild meat than for domestic meat (Nested Mixed Effects Model; ln(town population) = 0.13, F1, 19.3= 2.75,
p = 0.11; type of meat = 1.17, F1, 267.6= 81.0, p<0.0001; animal group[type of meat], F7, 263.2=
2.57, p = 0.014; ln(town population) by type of meat interaction = 0.29, F1, 276= 122.4,
p<0.0001; R2= 0.78). Wild meat sold in urban areas was consistently sourced from farther
away than wild meat sold in rural areas or domestic meat sold in urban or rural areas (Fig 7B). Similarly, the distance traveled to hunt wild meat was greater in larger towns (see model pre-sented above for 2B and 2C).
From the transportation interviews (n = 61), most transporters (65 ± 25%, towns as repli-cates) had transported meat in the three days prior to their interview. Few transporters inter-viewed (2.7 ± 5.2% or n = 4) had transported wild meat (including bats, tenrecs, and wild pigs) in the three days prior to the interview (all who had transported wild meat in the three days prior, were interviewed in Antsiranana). All transporters who had moved wild meat in the past three days had also transported domestic meat during that time period as well. One-third (34 ± 27%) of transporters had transported wild meat at some point in the past. In accordance with hypothesis (2F), the percentage of drivers who had ever transported chicken (62 ± 24%) was higher than the percentage of drivers who had ever transported any type of wild meat (means for five different wild meats24%,S3 Table). Wild meat was transported by respon-dents less frequently than domestic meat. However, when wild meat was transported, the num-ber of carcasses of individual animals transported per trip were similar to that of a shipment of domestic animals (Column:“When transporting, how many are transported per trip?”;S3 Table); in other words, shipments of wild meat and domestic meat were generally similar in size even if wild meat was shipped less often than domestic meat.
Sale of wild and domestic meat (objective three)
Prices of wild and domestic meat are reported by meat-seller interviews inS2 Tableand data from consumer interviews are inS4 Table. In accordance with hypothesis (3A), in 7 out of 9 cases where comparable purchases were made (same animal group, source type, and unit of purchase), the average price paid by consumers in urban areas was higher than that in rural areas (S4 Table); the exceptions were for purchases of wild pig (S4 Table).
In contrast to hypothesis (3B), according to respondents of the meat consumption inter-views, prices varied by animal group but wild meat was less expensive overall (Nested mixed effects model; type of meat, F1, 1613= 259.2, p<0.0001; animal group [type of meat], F5, 1611=
58.0, p<0.0001; R2= 0.61). Relative costs were only partially in line with expectations: bat
meat was indeed less expensive than all domestic meat, but contrary to expectations, tenrec and wild pig meats generally were as well (S2 Fig).
In contrast to hypotheses (3C) and (3D), the cost of wild meat (as reported by respondents of the meat consumption interviews) did not differ depending on whether it was purchased from a hunter, in an open-air market, at a restaurant, or from a middleman (Mixed Effects Model, F3, 35.6= 1.96, p = 0.14, model R2= 0.33;S4 Table).
In accordance with hypothesis (3F), and based on data taken from the meat consumption interviews, the patterns of movement of domestic and wild meat (S3,S4andS5Figs) from the source to the consumer may reflect their status as a legal, semi-legal (can be legally hunted some of the time), or illegal substance (legal domestic meats versus semi-legal and illegal wild meats,Fig 8). Domestic meat is often obtained through purchase or raised by the consumer rather than being provided as a gift (S5 Table), though urban respondents tend to purchase domestic meat from markets while (apart from zebu meat) rural respondents tend to own and raise domestic meat (S3 Fig). In contrast, the patterns of procurement for mammals that are commonly consumed as wild meat are less clear but include a variety of means including pur-chasing and hunting (S4 Fig). In further contrast, animals that are not commonly consumed or which are typically killed through human-wildlife conflict (e.g. carnivores that killed livestock or wild pigs that trampled rice fields) were almost exclusively consumed after being killed by the consumer (S5 Fig).
There was little support for hypothesis (3G). As reported in the meat consumption inter-views, a higher percentage of respondents procured meat from free sources (e.g. by hunting or receiving the meat as a gift) than through purchase from a third party (S6 Table). The excep-tion was that a higher percentage of urban respondents purchased bat and wild pig meat than procured it from free sources (S6 Table).
In contrast to hypothesis (3H), the population of a town had no effect on the percentage of consumers who bought wild meat (Regression, ln(population = 0.03, F1,16= 1.88, p = 0.17, R2=
0.01, towns as replicates with percentage of consumers arcsine-transformed).
Fig 8. Patterns of movement for wild and domestic meats as reported by urban and rural respondents.The arrows point in the direction of the consumer and the thickness of the arrow is proportional to the percentage of consumers (towns are replicates) who procured domestic meat from that source. When no arrow is present, no respondents reported procuring meat from that source. There are two tiers of arrows; the arrows that connect peripheral boxes to the“purchase”and“free”boxes represent direct quantities measured (black arrows) while the arrows connecting the“purchase”and“free”boxes to the consumer represent sums of the peripheral boxes of each type (gray arrows).
Volume of meat consumption (objective four)
The 1343 respondents to the meat consumption interviews provided 1046 estimates of yearly consumption rates for nine types of wild meat and 1282 estimates for three types of domestic meat. Most individuals had consumed wild meat at least once in their lifetimes (78 ± 7% across all respondents, 76 ± 9% of rural respondents, 80 ± 11% of urban respondents, towns as repli-cates); very few respondents were vegetarian (<1%).
Urban respondents estimated that they had consumed wild meat 86 ± 56 (mean ± 95% CI, towns as replicates) times in their lifetime and 10 ± 6 times per year in the recent past (from 2009–2013). Rural respondents estimated that they had consumed wild meat 117 ± 122 times in their lifetime and 5 ± 5 times per year in the recent past (S7 Table).
In accordance with hypotheses (4A) and (4B), the frequency of wild meat consumption per year differed substantially by animal group and domestic meat was consumed much more fre-quently per year than wild meat in this same period (Nested Mixed Effects Model; type of meat, F1, 2269= 673.7, p<0.0001; animal group [type of meat], F9, 2261= 39.8, p<0.0001;
model R2= 0.46). Specifically, the most-consumed meats were zebu, pig, and chicken (all domestic meats) in that order, followed by all the wild meats. Among wild meats it was clear that tenrec, wild pig, and bat were consumed more than civet or wild cat; lemur was also con-sumed more than wild cat. Consumption of fosa and mongoose relative to other wild meats could not be discerned (S6 Fig). Urban and rural regions consumed domestic meat an average of 51 ± 11 and 41 ± 17 times per year, respectively.
Discussion
This is the first study to examine all stages of the commodity chain for wild meat in Madagas-car, from hunter through transport, sale, and to the consumer. It is also the first study to com-pare aspects of the Malagasy wild meat trade across rural and urban areas, and to include both formal and informal enterprises. We also examined how the trade of wild meat differed by mammalian group and from domestic meats. Our findings suggest that, apart from the hunting stage, which was entirely informal, the commodity chain for wild meat in Madagascar is likely more formalized than previously thought. The characteristics of the stages in the commodity chain varied between wild meat and domestic meat, by wild meat type, and between urban and rural respondents. These results and their implications are discussed in more detail, below.
Hunting and capture of wild meat
Our data confirm that hunting methods differ depending on intent and between urban and rural locations. For example, animals captured for sale were caught using more efficient meth-ods than those captured for personal consumption (Fig 5) and the majority (93%) of animal captures for sale were by urban hunters. Therefore, it is reasonable to hypothesize that urban respondents might generally hunt for commercial reasons (although hunting for pleasure or when visiting family in rural areas may also be secondary motivators). In contrast, rural respondents might be more likely to hunt for subsistence [16] or to protect their agricultural lands and livestock from nuisance animals (wild pigs and carnivores) [15]. However, there are exceptions to these generalizations and rural respondents also do occasionally use more effi-cient hunting methods [19,20] and also sell their wild meat catches when they have caught sur-plus animals [16].
Movement of wild animals away from the capture location
Many animal groups were hunted locally (<10 km) in rural areas, confirming observations
from other studies [15]. However, we also found that the distance that respondents traveled to hunt wild meat increased with the population of a respondent’s town of residence. Urban indi-viduals typically traveled farther than rural respondents to hunt wild meat (Fig 8A); the average distance traveled by urban individuals to hunt was always greater than 70 km from their town of residence (S1 Table).
The distances that commercial wild meat (wild meat that was purchased by the end con-sumer) traveled from the capture location to the consumer depended on the vendor type (Fig 7B,S1 Table). Also, the distance traveled by consumers to purchase wild meat increased with the population of a town. This makes sense given that consumers attempting to purchase wild meat might have to travel farther to areas where wild meat is sold (perhaps to regions closer to remnant habitat). Alternatively, this large travel distance may also be because some types of wild meat were consumed using expendable income (e.g. consumed for a special occasion) dur-ing an overnight visit with family members or on a business trip. While these distances are large—and while transporters reported moving wild meat up to 389 kilometers, on average—
the commodity chain of Madagascar seems to cover the same distances as those examined in other areas of sub-Saharan Africa [4,10].
respondent pool (S7 Table)—were most frequently transported. These data suggest that: (1) animals like carnivores, that are often caught as a byproduct of human-wildlife conflict, are not typically moved far from the capture location; (2) some wild meats—like that from lemurs, which are illegal to hunt—are probably being moved from the capture location but potentially in private vehicles due to the illicit nature of the trade; and (3) some wild meats—like from bats, tenrecs, and wild pigs—are commonly moved via the country’s intercity transit system.
Exchange of wild meat via sale, barter, or gifting
With the exception of urban respondents who consumed bat and wild pig meat, more respon-dents procured wild meat from free sources (e.g., by hunting or receiving the meat as a gift) than through purchase from a third party. However, many respondents did still purchase meat, and the percentage of consumers who purchased wild meat did not change with town popula-tion size.
Wild meat is typically consumed when it is a cheaper protein option than domestic meats [1,38]. We found that wild meat (with the exception of wild pig, which was priced similarly to zebu) was less expensive than domestic meat when portion sizes and venue of purchase were accounted for. This contrasts with prior studies in Madagascar, which reported that some types of wild meat were more expensive than domestic meat [21,23]. In addition, we found that wild meat was more expensive in urban areas than in rural areas but in contrast to other wild meat markets in Africa [4], wild meat did not differ in cost by type of venue (e.g., restaurant, mar-ket), when controlling for town, animal group, and unit of purchase.
In comparison to domestic meat, which was widely available, wild meat was sold at only a few open-air markets (S2 Table) and restaurants in each town. Usually, where these market stalls and restaurants were established enterprises, they were well known in the communities for their status as serving wild meat. Market stalls—regardless of whether they sold domestic or wild meat—usually specialized in the sale of one or two types (taxonomic groups) of meat. In contrast, restaurants—regardless of whether they sold wild meat or not—usually offered at least three different types of meat per week.
Consumption of wild meat. In accordance with prior studies [21,24,26] we found that wild meat was not consumed as frequently as domestic meat (S7 Table). However, we found that there were marked differences between urban and rural respondents in the consumption of wild meat; urban respondents consumed 24% more domestic meat per year and twice as much wild meat per year as their rural counterparts (S7 Table).
travel to rural areas (where wild animals might still exist in remnant habitats) or sufficient financial capital to purchase wild meat in urban markets.
Conservation implications
Our data indicate that the transport and exchange of wild meat in Madagascar are more com-mercial and more formalized than previously thought. They also highlight how interconnected and interdependent the informal and formal aspects of the commodity chain are; hunting appears to be mostly informal while other actors involved in the commodity chain include both formal and informal enterprises. Prior studies—which were based predominantly in rural areas of Madagascar and/or were limited to one geographic region—suggested that 98% of an individual’s wild meat was hunted by the consumer [16] and that hunting for wild meat is con-ducted for sustenance only [24]. However, our data indicate that while hunting is still an important source of wild meat, a large portion of wild meat passes through third-party actors. For example, urban respondents purchased 56% and 62% of the bats and wild pigs prior to consumption, while rural respondents purchased 28% and 31% of the bats and lemurs that they consumed (S6 Table). In addition, a significant portion of wild animals in Madagascar are moved across long distances using the intercity transit system and sold through venues known for their status as‘wild meat selling establishments’. These venues include market stalls that specialize in selling wild meat (bats, tenrecs, and wild pigs) most days of the week. Given: (1) the distance traveled by consumers to purchase wild meat (S1 Table); (2) the well-known status of individual restaurants as‘wild meat-selling establishments’in each town where data was col-lected; and (3) that<1% of meat-sellers at open-air markets sold wild meat in the three days
prior to our interviews (S2 Table), it is reasonable to assume that the majority of the volume of wild meat trading in Madagascar is either hunted by a consumer [16,24] or sold through a small number of specialized market sellers and/or restaurants who are known to offer wild meat to consumers. The small number of dedicated wild meat-sellers may explain why prior researchers hypothesized that the Malagasy wild meat trade is not as formalized as in other areas of Africa [15]. However, these few dedicated meat-sellers may still be selling large amounts of wild meat and, similar to other wild meat commodity chains in sub-Saharan Africa [4], we found that the system of moving wild meat from rural areas to select urban venues using inter-city transport across large distances seems to be relatively organized. Together, the formal and informal commodity chain in Madagascar appears capable of moving at least thou-sands of wild meat carcasses per year at minimum from the point of capture to the final con-sumer (S3 Table).
Understanding the commodity chain can help identify points along the chain for conserva-tion intervenconserva-tions [4,5]. Conservation initiatives in Madagascar would need to have a broad focus in order to tackle sustainability issues during the first stage of the commodity chain, cap-ture and hunting, since hunting is mostly informal (e.g. most hunters do not have hunting per-mits [26]), carried out by a variety of actors, and can be legal or illegal, depending on the animal group (S1 Appendix). In some cases, partial limits on hunting (such as restriction of methods or time periods in which hunting may take place) may be more difficult to enforce than outright bans, since the illegal nature of capture may not be evident at later stages, such as at the point of sale or consumption; this may thwart any enforcement efforts or confuse cus-tomers eager to follow the rules. In such cases, highly threatened species may benefit from hunting bans. It is unlikely that hunting bans alone will substantially reduce unsustainable hunting though [5], given that most hunting in Madagascar is done illegally already [16]. Any tightened restrictions would likely have to be paired with increased enforcement to be success-ful, but increasing enforcement would be difficult to mobilize given limited budgets and per-sonnel and other pressing socio-economic priorities in Madagascar. If obstacles to increasing enforcement are too great, voluntary monitoring or citizen science programs could be insti-tuted. For example, locally based monitoring programs in sub-Saharan Africa that worked with wild meat hunters to collect monitoring data, were found to be a cost-effective and accurate method of data collection [41]. At a minimum, these would help inform managers of current capture rates and help provide information for how programs could help influence the demand for wild meat at other points in the commodity chain. In addition, it can help inform commu-nity-based conservation programs [42] or Integrated Conservation and Development Pro-grams [43]. For example, information collected from hunters and communities in northeast Madagascar has led to the development of alternative livelihoods programs which aim to decrease natural resource use within the boundaries of a protected area while providing hunters with more sustainable economic opportunities [2,15].
The second stage of the commodity chain—transportation—provides some opportunities for conservation programming. Some animals groups—including bats, tenrecs, and wild pigs—
were often transported by inter-city transit (S3 Table) and were sometimes even delivered directly to restaurants for sale to the final consumer. These meats could be monitored using existing legal frameworks that require transporters and restaurants to have permits to move and sell wild meat (S1 Appendix), although enforcement and monitoring at transit hubs would need to be increased. Given that inter-city transit operations did not exclusively move wild meat (and wild meat transport did not constitute the major source of income for any driver interviewed), and already did not transport some illegal meats (like lemurs), drivers could be expected to cooperate with such a program. However, conservation initiatives would need to be prepared for the possibility that increased enforcement but unchanging consumer demand could increase the informal transportation of wild meat.
registering themselves as a wild meat-selling venue with different levels of voluntary and man-datory reporting requirements, depending on the types and quantity of wild meat being sold. Voluntary programs, where restaurants pledge not to sell certain types of foods (e.g. sustainable seafood;www.fish2fork.com) have been used by non-profit and multilateral groups in the past; these public pledges could be used in Madagascar to leverage the desire for tourists and other entities to support environmentally-friendly businesses. In addition, monitoring systems could provide early warning signals for the potential declines of wild populations; a permit system could be used to keep legal harvests sustainable and increased enforcement could be used to protect species that are not legal to sell.
Finally, the last step of the commodity chain—consumption by the consumer—presents opportunities for conservation programs aimed at curbing demand for species that are traded illegally or through informal venues, or where most of the hunting is conducted by the con-sumer. For these animal groups—like lemurs—public education and outreach might be the most effective way to decrease wild meat hunting consumption [45]. It has been noted that the Malagasy public has low knowledge of wildlife laws and only 43% of individuals could correctly classify different species into their legal categories (e.g. protected, game, and nuisance animals) [39]. Therefore, outreach to the public could include information about: (1) specific species and their legal status; (2) types of hunting methods that are prohibited; (3) seasons in which hunting is legal; and (4) permitting procedures. These outreach campaigns must consider that in urban areas, wild meat consumption in Madagascar may be driven by preference rather than by food security needs and that human-wildlife conflict may also be a factor contributing to hunting in rural areas. Therefore, successful outreach campaigns could appeal to the consumer in a way that acknowledges and leverages cultural and social norms—a tactic that has been suc-cessful in increasing community compliance in a marine reserve in southwest Madagascar [46]
—while providing alternatives to individuals who are hunting mammals due to human-wildlife conflict [45] or for food security reasons [15]. Since compensation for damages caused by wild-life does not always succeed at protecting biodiversity, proposals to use compensation should be carefully considered prior to implementation [47], especially where funding sources needed to support such initiatives cannot be guaranteed over time. Finally, outreach in urban areas must be especially cognizant that, relative to rural consumers, urban consumers are willing to pay higher prices for wild meat, travel farther to procure wild meat, and utilize different hunt-ing methods (such as firearms).
In some cases, there is no single best point along the commodity chain for conservation interventions [4]; it is important to consider all aspects of the commodity chain as targeted pro-gramming can have unintended consequences on other stages of the commodity chain [5]. For instance, the provision of alternative protein sources to communities can decrease hunter income and cause hunters to increase their hunting or to target higher value and possibly rarer species (to make up for lost income [5]). The political ecology of the commodity chain—the relationships and political agendas of different stakeholders and their impact on conservation programming—should also be considered as this can greatly impact the success of manage-ment and policy interventions [42]. To be effective, conservation programs will need to engage, empower, and support local communities [42]; when the local context is carefully considered and when appropriate frameworks and governance approaches are selected, conservation pro-gramming can succeed without sacrificing social development propro-gramming [48].
Supporting Information
S2 Appendix. Interview materials. (DOC)
S1 Fig. Percent of respondents who reported hunting wild mammal groups on a seasonal basis.Towns are replicates; data taken from meat consumption interviews.
(TIFF)
S2 Fig. Cost per unit of wild versus domestic meats (A) and by animal group (B).In figure (B) types of meat on the right-hand side of the graph are domestic meats while those on the left are wild meats. Figure (B) shows least squares means of significant relationships between different animal groups calculated using a Tukey HSD post-hoc test; letters indicate significant differences. (TIFF)
S3 Fig. Sources of domestic meat in urban (left column) and rural regions (right column). The arrows point in the direction of the consumer and the thickness of the arrow is propor-tional to the percentage of consumers (towns are replicates) who procured domestic meat from that source. When no arrow is present, no respondents reported procuring meat from that source. There are two tiers of arrows; the arrows that connect peripheral boxes to the“ pur-chase”and“free”boxes represent direct quantities measured (black arrows) while the arrows connecting the“purchase”and“free”boxes to the consumer represent sums of the peripheral boxes of each type (gray arrows).
(TIFF)
S4 Fig. Sources of commonly consumed wild mammals in urban (left column) and rural regions (right column).The arrows point in the direction of the consumer and the thickness of the arrow is proportional to the percentage of consumers (towns are replicates) who pro-cured wild meat from that source. When no arrow is present, no respondents reported procur-ing wild meat from that source. There are two tiers of arrows; the arrows that connect
peripheral boxes to the“purchase”and“free”boxes represent direct quantities measured (black arrows) while the arrows connecting the“purchase”and“free”boxes to the consumer represent sums of the peripheral boxes of each type (gray arrows).
(TIFF)
S5 Fig. Sources of meat for wild mammals not commonly consumed or killed through human-wildlife conflict.Sources of meat for wild mammals that are not commonly consumed or are typically killed through human-wildlife conflict in urban (left column) and rural regions (right column). The arrows point in the direction of the consumer and the thickness of the arrow is proportional to the percentage of consumers (towns are replicates) who procured domestic meat from that source. When no arrow is present, no respondents reported procuring meat from that source. There are two tiers of arrows; the arrows that connect peripheral boxes to the“purchase”and“free”boxes represent direct quantities measured (black arrows) while the arrows connecting the“purchase”and“free”boxes to the consumer represent sums of the peripheral boxes of each type (gray arrows).
(TIFF)
S1 Table. Average distances (in kilometers ± 95% CI, towns are replicates) traveled by the consumer to procure wild meat (no data from Rats/Mice).
(DOCX)
S2 Table. Sale of meat at open-air markets, restaurants, and supermarkets.Data are shown as the mean ± 95% CI (towns as replicates). Information taken from meat-seller interviews. (DOCX)
S3 Table. Meat transport via the bus and boat transport system (61 respondents across 5 urban towns).Data are shown as the mean ± 95% CI. Towns were used as replicates when sample sizes were higher (towns as replicates = TR) and individuals were used as replicates when sample sizes were low (individuals as replicates = IR).
(DOCX)
S4 Table. Price paid by consumer for wild meat from different sellers (average, towns are replicates).All price estimates are from 2012 or 2013 unless otherwise noted. Body size esti-mate for wild cats was retrieved from Brockman et al. (2008). All other body size estiesti-mates were calculated from Garbutt (2007) as the mean of all species in the taxon, using the maxi-mum weight recorded for each species.
(DOCX)
S5 Table. Percent of people who procured domestic meat from different sources in urban and rural regions.Averages ± 95% CI are shown with towns as replicates.
(DOCX)
S6 Table. Percent of people who procured wild meat from different sources in urban and rural regions.Averages ± 95% CI are shown and towns are replicates.
(DOCX)
S7 Table. The volume of wild meat consumption.Includes individuals who had consumed wild meat at least once in a lifetime and the volume per year. Significant differences between towns are noted. Columns note whether towns or individual respondents are treated as cates and depict the mean ± 95% Confidence Interval. Where individuals were used as repli-cates, sample sizes are listed behind each mean in parentheses. ND: No Data.
(DOCX)
Acknowledgments
Many thanks to Sahondra Hanitriniaina, Jocelyn Randrianarivelo, and Claudesse Barat for serving as research assistants. Thanks to Robert Sanders, Erik Cordes, Jacqueline Tanaka, Hamil Pearsall, and two reviewers for feedback that substantially increased the quality of the manuscript. The authors are indebted to the host communities for their hospitality and assis-tance with the research. This research was completed with administrative assisassis-tance from the Madagascar Institute for the Conservation of Tropical Environments.
Author Contributions
References
1. Fa JE, Currie D, Meeuwig J. Bushmeat and food security in the Congo Basin: linkages between wildlife and people’s future. Environ Conserv J. 2003; 30: 71–78.
2. Golden CD, Fernald LCH, Brashares JS, Rasolofoniaina BJR, Kremen C. Benefits of wildlife consump-tion to child nutriconsump-tion in a biodiversity hotspot. PNAS. 2011; 108:19653–19656. doi:10.1073/pnas. 1112586108PMID:22106297
3. Lindsey PA, Balme G, Becker M, Begg C, Bento C, Bocchino C, et al. The bushmeat trade in African savannas: impacts, drivers, and possible solutions. Biol Conserv. 2013; 160: 80–96.
4. Cowlishaw G, Mendelson S, Marcus Rowcliffe J. Structure and operation of a bushmeat commodity chain in Southwestern Ghana. Conserv Biol. 2005; 19:139–149.
5. Bowen-Jones E, Brown D, Robinson EJZ. Economic commodity or environmental crisis? An interdisci-plinary approach to analyzing the bushmeat trade in Central and West Africa. Area. 2003; 35: 390–402.
6. Nasi R, Taber A, Van Vliet N. Empty forests, empty stomachs? Bushmeat and livelihoods in the Congo and Amazon Basins. International Forestry Review. 2011; 13: 355–368.
7. Bennett EL. Is there a link between wild meat and food security? Conserv Biol. 2002; 16: 590–592.
8. Crookes DJ, Ankudey N, Milner-Gulland EJ. The value of a long-term bushmeat market dataset as an indicator of system dynamics. Environ Conserv J. 2005; 32: 333–339.
9. Kumpel NF, Milner-Gulland EJ, Cowlishaw G, Rowcliffe JM. Incentives for hunting: the role of bushmeat in the household economy in rural Equatorial Guinea. Human Ecology. 2010; 38: 251–264.
10. Kamins AO, Restif O, Ntiamoa-Baidu Y, Suu-Ire R, Hayman DTS, Cunninham AA, et al. Uncovering the fruit bat bushmeat commodity chain and the true extent of fruit bat hunting in Ghana, West Africa. Biol Conserv. 2011; 144: 3000–3008. PMID:22514356
11. Wilkie DS, Carpenter J. Bushmeat hunting in the Congo Basin: an assessment of impacts and options for mitigation. Biodivers Conserv. 1999; 8: 927–955.
12. Fa JE, Peres C. Hunting in tropical forests. In: Reynolds JD, Mace GM, Redford KH, Robinson JG, edi-tors. Conservation of exploited species. Cambridge: Cambridge University Press; 2001. pp. 203–241.
13. Karesh WB, Cook RA, Bennett EL, Newcomb J. Wildlife trade and global disease emergence. Emerg-ing Infectious Diseases. 2005; 11: 1000–1002. PMID:16022772
14. Benjamin N, Mbaye AA. Informality, growth, and development in Africa: WIDER Working Paper 2014/ 052. Helsinki: World Institute for Development Economics Research; 2014.
15. Golden CD. Bushmeat hunting and use in the Makira Forest, northeastern Madagascar: a conservation and livelihoods issue. Oryx. 2009; 43: 386–392.
16. Golden CD, Bonds MH, Brashares JS, Rasolofoniaina BJR, Kremen C. Economic valuation of subsis-tence harvest of wildlife in Madagascar. Conserv Biol. 2014; 28: 234–243. doi:10.1111/cobi.12174
PMID:24405165
17. Cardiff SG, Ratrimomanarivo FH, Rembert G, Goodman SM. Hunting, disturbance and roost persis-tence of bats in caves at Ankarana, northern Madagascar. Afr J Ecol. 2009; 47: 640–649.
18. Schwitzer C, Mittermeier RA, Johnson SE, Donati G, Irwin M, Peacock H, et al. Averting lemur extinc-tions amid Madagascar’s political crisis. Science. 2014; 343: 842–843.
19. Vasey N. Clinging to life: Varecia variegate rubra and the Masoala Coastal Forests. Lemur News. 1996; 2: 7–9.
20. Goodman SM, Raselimanana A. Hunting of wild animals by Sakalava of the Menabe region: a field report from Kirindy-Mite. Lemur News. 2003; 8: 4–6.
21. Randrianandrianina FH, Racey PA, Jenkins RKB. Hunting and consumption of mammals and birds by people in urban areas of western Madagascar. Oryx. 2010; 44: 411–415.
22. Martinez B. Occurrence of Bamboo lemurs, Hapalemur griseus occidentalis, in an agricultural land-scape on the Masoala Peninsula. Lemur News. 2008; 13: 11–14.
23. Tucker B. Applying behavioral ecology and behavioral economics to conservation and development planning: An example from the Mikea Forest, Madagascar. Human Nature. 2007; 18: 190–208. doi:10. 1007/s12110-007-9017-xPMID:26181059
24. Gardner CJ, Davies ZG. Rural bushmeat consumption within multiple-use protected areas: qualitative evidence from southwest Madagascar. Hum Ecol. 2014; 42: 21–34.