Adv. Radio Sci., 6, 67–70, 2008 www.adv-radio-sci.net/6/67/2008/
© Author(s) 2008. This work is distributed under the Creative Commons Attribution 3.0 License.
Advances in
Radio Science
Characterisation of human gait using a continuous-wave radar at
24 GHz
C. Hornsteiner and J. Detlefsen
Technische Universit¨at M¨unchen, Lehrstuhl f¨ur Hochfrequenztechnik, Fachgebiet Hochfrequente Felder und Schaltungen, 80333 M¨unchen, Germany
Abstract. Human locomotion consists of a complex move-ment of various parts of the body. The reflections generated by body parts with different relative velocities result in dif-ferent Doppler shifts which can be detected as a superposi-tion with a Continuous-Wave (CW) Radar. A time-frequency transform like the short-time Fourier transform (STFT) of the radar signal allows a representation of the signal in both time-and frequency domain (spectrogram). It can be shown that even during one gait cycle the velocity of the torso, which constitutes the major part of the reflection, is not constant. Further a smaller portion of the signal is reflected from the legs. The velocity of the legs varies in a wide range from zero (foot is on the ground) to a velocity which is higher than that of the torso. The two dominant parameters which characterise the human gait are the step rate and the mean velocity. Both parameters can be deduced from suitable por-tions of the spectrogram. The statistical evaluation of the two parameters has the potential to be included for discrimi-nation purposes either between different persons or between humans and other moving objects.
1 Human gait analysis
The human gait was investigated for a long time beginning in the nineteenths century under scientific considerations. With the upcoming improvements in photography it was possible to analyse the movement of different body parts with a se-ries of pictures. In our days the photo camera was replaced by a CCD camera and with several viewpoints from differ-ent angles it is possible to extract 3-dimensional data of the scene. A model which used such a motion capture system has been developed by Zonghua and Troje (2004). To get
pe-Correspondence to:C. Hornsteiner
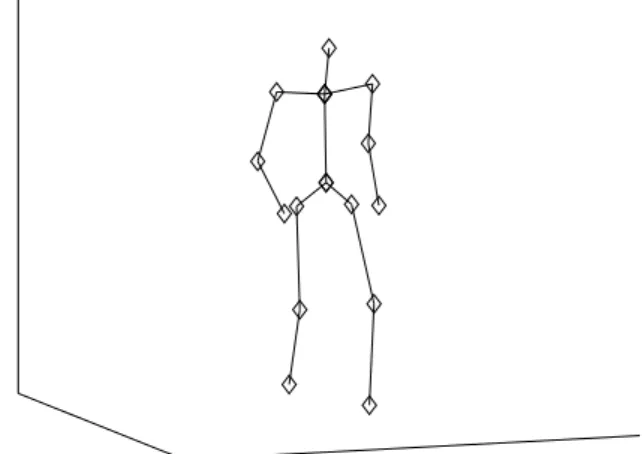
Fig. 1.Gait model of Zonghua and Troje (2004) with 15 points.
riodic data the test persons were placed on a treadmill. For identification of different body parts for the later processing each persons wore 15 reflective markers (s. Fig. 1). The 3-dimensional position was then expressed in a Fourier series
p(t )=p0+p1sin(ωt )+q1cos(ωt )+
+p2sin(2ωt )+q2cos(2ωt )
(1)
for each coordinate axis x, y andz. With this representa-tion it is easily possible to look at the process from every viewpoint. To get a velocity representation of the movement Eq. (1) has to be derived. This can be done either analytically by taking the derivative from each summand or numerically by taking the derivative of the discretised time data ofp(t ). The largest velocity components arise in the direction of lo-comotion. Therefore, this direction is of main interest for the measurement with a radar sensor. The obtained veloc-ity over time for all 15 marker points is displayed in Fig. 2.
68 C. Hornsteiner and J. Detlefsen: Characterisation of human gait using a continuous-wave radar at 24 GHz
0
time
velocity
Fig. 2. Velocity in the direction of locomotion of all 15 markers over time.
Fig. 3.Block diagram of a CW-Radar with I/Q-Demodulation.
Although the treadmill is running with constant velocity, the velocity of the torso is not constant. It is changing nearly si-nusoidal with the step frequency. The highest velocities are expectedly observed from the legs. While one leg attains its maximum velocity the other is in its minimum. The velocity contribution of the knees and arms lies in between torso and legs.
2 Doppler radar
For the measurements a CW-Radar at a carrier frequency of 24 GHz was used. With the Doppler formula
fD=2fc
v
c (2)
it can be seen that velocityvis proportional to the measured frequencyfD. Because of increasing Doppler frequencies
Time / s
Frequency / Hz
0.5 1 1.5 2 2.5 3 3.5 4 4.5 5
−1000 −800 −600 −400 −200 0 200 400 600 800
10 20 30 40 50 60 70 80 90 100 110
A B
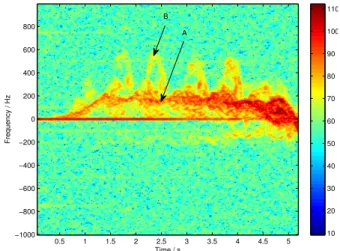
Fig. 4.Spectrogram of a walking person (window length 128 ms).
fDwith increasing carrier frequencyfcat constant velocity, the choice of a high carrier frequency leads to a better veloc-ity resolution for a constant time interval. The basic block di-agram of the radar sensor can be seen in Fig. 3. With the use of a I/Q-demodulation it is possible to discriminate between positive and negative frequencies and therefore between ap-proach and receding motion. A spectral transform is used to derive the frequency and so the velocity. By doing this with the complete time signal the best frequency resolution is ob-tained giving no time resolution. In the short-time Fourier transform (STFT) only parts of the signal are transformed to frequency domain subsequently applying a windowing func-tionw(t )which is moved over the time signalx(t ).
STFT(τ, f )=
+∞ Z
−∞
x(t )·w(t−τ )·exp(−j2πf t )dt
The so called spectrogram are the absolute values of the STFT displayed on a logarithmic scale.
3 Feature extraction
The spectrogram of a measured motion can be seen in Fig. 4. The spectral amplitude corresponds to the radar cross section of the moving parts. The main contribution (A) comes from the torso, but since it is non-rigid there is no distinct line but a spectral spread. The contribution of the legs (B) is much smaller but it can be seen that it is still above noise level. The visible velocity response of the legs is in accordance to the model. Lower frequency components occur while one foot is on the ground and the other reaches its maximum. The velocity of the torso movement (A) may be detected by tak-ing the frequency at which the maximum amplitude occurs. Due to the spectral spread this curve will include errors if the
C. Hornsteiner and J. Detlefsen: Characterisation of human gait using a continuous-wave radar at 24 GHz 69
0 1 2 3 4 5 6
0 0.5 1 1.5 2 2.5 3 3.5 4
time / s
velocity / m/s
Fig. 5.Extracted velocity pattern of torso (-) and legs (- -).
2 4 6 8 10 12 14 16 18 20 −50
−40 −30 −20 −10 0 10 20 30
dB
frequency / Hz
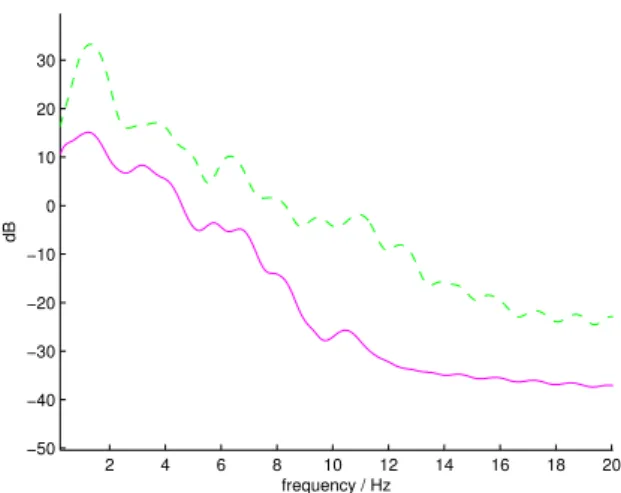
Fig. 6.Spectrum of velocity pattern from torso (-) and legs (- -).
detected velocity is not identical to the mean velocity of the torso.
The spectral components of the moving legs (B) above the torso are surrounded mostly by noise. Detection of signal above noise level is the standard process in signal theory. The resulting velocity patterns for torso and legs are displayed in Fig. 5. In both graphs the step frequency is visible. The legs with a high velocity deviation and the torso with lower veloc-ity deviation and also visible error. For the robust detection of periodic oscillations it will be changed from time domain to frequency domain. To avoid low frequency components from acceleration process a high pass filter is applied to the signal. The resulting spectrum is shown in Fig. 6. As ex-pected the magnitude at the step frequency of 1.3 Hz is for the legs more than 10 dB higher than those of the torso. Con-sequently the leg movement will be used for further evalua-tion.
0 1 2 3 4 5
0 0.5 1 1.5 2 2.5 3 3.5 4 4.5 5
velocity / m/s
step frequency / Hz
person other object
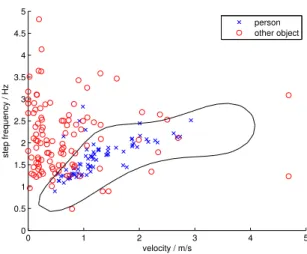
Fig. 7.Scatterplot with linear decision boundary.
Table 1. Confusion matrix with actual classes (I: Person, II: Other object) as columns and predicted classes as rows for linear discrim-ination.
I II
I 0.385 0.143 II 0.022 0.450
4 Statistical evaluation
Due to the periodic nature the step frequency is a feature can-didate for a statistical evaluation. Because of known depen-dencies between step frequency and velocity for human gait, it is expected to be useful to combine these both features. Other objects which also produce a Doppler spectrum will not show these dependencies and should not be localized in the feature space. For discrimination two classes are created with class one including all walking persons and class two in-cluding all other objects. Class one consists of 74 data points and class two of 108 data points. The scatter plot shows a localisation of class one which makes it possible to separate both classes. The easiest way to do this is to construct a linear separation boundary using methods of linear discrim-ination analysis. The scatterplot with the decision boundary can be seen in Fig. 7 and the resulting confusion matrix in Table 1. The resubstitution misclassification rate with this trained classifier is 16.5%. The linear classifier is not able to discriminate between points of class two lying below the lo-calized class one. This can be improved by the construction of a nonlinear classifier. A widely used method to do this is the use of support vector machines (SVM). The nonlinearity is obtained with the use of nonlinear kernel functions. The kernel functions used here were radial basis functions. The resulting decision boundary with this classifier can be seen in
70 C. Hornsteiner and J. Detlefsen: Characterisation of human gait using a continuous-wave radar at 24 GHz
0 1 2 3 4 5
0 0.5 1 1.5 2 2.5 3 3.5 4 4.5 5
velocity / m/s
step frequency / Hz
person other object
Fig. 8.Scatterplot with nonlinear decision boundary.
Table 2. Confusion matrix with actual classes (I: Person, II: Other object) as columns and predicted classes as rows for discrimination with SVM.
I II
I 0.385 0.088 II 0.022 0.505
Fig. 8 and in Table 2 the associated confusion matrix. With this classifier the resubstitution misclassification rate sinks to 11%.
5 Summary
The movement of different body parts can be made visible with a short-time Fourier transform of a CW radar signal. From this display it is possible to extract different velocity curves. The main parameters describing the human gait are step rate and mean velocity which could be obtained from this curves. The two dimensional scatter plot of these two features shows the possibility to discriminate between human gait and other objects. This discrimination was first done by a linear classifier and then improved with a nonlinear classifier using support vector machines.
References
F¨olster, F., Rohling, H., and Ritter, H.: Observation of a walking pedestrian with a 24GHz automotive radar sensor, GeMiC 2006, Session 10b-4, 2006.
Gandhi, T., Gandhi, T., and Trivedi, M. M.: Pedestrian Protection Systems: Issues, Survey, and Challenges, Intelligent Transporta-tion Systems, IEEE TransacTransporta-tions, 8, 413–430, 1524–9050, 2007. Geisheimer, J. L., Marshall, W. S., and Greneker, E.: A continuous-wave (CW) radar for gait analysis, in: Signals, Systems and Computers, 2001, Conference Record of the Thirty-Fifth Asilo-mar Conference, 1, 834–838, 2001.
Otero: Application of a continous wave radar for human gait recog-nition, The MITRE Corporation, 2005.
Zonghua, Z. and Troje, N. F.: 3D Periodic Human Motion Recon-struction from 2D Motion Sequences, in: Computer Vision and Pattern Recognition Workshop, 2004 Conference, pp. 186–186, 2004.