the Assessment of Angiogenesis in Brain Tumors
Dafna Ben Bashat1*., Moran Artzi1,2., Haim Ben Ami1
, Orna Aizenstein1, Deborah T. Blumenthal3, Felix Bokstein3, Benjamin W. Corn2,3, Zvi Ram2,4, Avraham A. Kanner2,4, Biatris Lifschitz-Mercer5, Irit Solar5, Tsafrir Kolatt6,7, Mika Palmon1, Yifat Edrei8, Rinat Abramovitch8
1Functional Brain Center, The Wohl Institute for Advanced Imaging, Tel Aviv Sourasky Medical Center, Tel Aviv, Israel,2Sackler Faculty of Medicine, Tel-Aviv University, Tel Aviv, Israel,3Neuro-Oncology Service, Institute of Radiotherapy, Tel Aviv Sourasky Medical Center, Tel Aviv, Israel,4Department of Neurosurgery, Tel Aviv Sourasky Medical Center, Tel Aviv, Israel,5Pathology, Diagnostic and Research Cancer Center, Tel Aviv Sourasky Medical Center, Tel Aviv, Israel,6Applied Spectral Imaging, Haifa, Hadassah Hebrew University Medical Center, Jerusalem, Israel,7Israeli Institute for Advanced Research, Rehovot, Hadassah Hebrew University Medical Center, Jerusalem, Israel,8The Goldyne Savad Institute for Gene Therapy, Hadassah Hebrew University Medical Center, Jerusalem, Israel
Abstract
Blood oxygenation level dependence (BOLD) imaging under either hypercapnia or hyperoxia has been used to study neuronal activation and for assessment of various brain pathologies. We evaluated the benefit of a combined protocol of BOLD imaging during both hyperoxic and hypercapnic challenges (termed hemodynamic response imaging (HRI)). Nineteen healthy controls and seven patients with primary brain tumors were included: six with glioblastoma (two newly diagnosed and four with recurrent tumors) and one with atypical-meningioma. Maps of percent signal intensity changes (DS) during hyperoxia (carbogen; 95%O2+5%CO2) and hypercapnia (95%air+5%CO2) challenges and vascular reactivity mismatch maps (VRM; voxels that responded to carbogen with reduced/absent response to CO2) were calculated. VRM values were measured in white matter (WM) and gray matter (GM) areas of healthy subjects and used as threshold values in patients. Significantly higher response to carbogen was detected in healthy subjects, compared to hypercapnia, with a GM/WM ratio of 3.8 during both challenges. In patients with newly diagnosed/treatment-naive tumors (n = 3), increased response to carbogen was detected with substantially increased VRM response (compared to threshold values) within and around the tumors. In patients with recurrent tumors, reduced/absent response during both challenges was demonstrated. An additional finding in 2 of 4 patients with recurrent glioblastoma was a negative response during carbogen, distant from tumor location, which may indicate steal effect. In conclusion, the HRI method enables the assessment of blood vessel functionality and reactivity. Reference values from healthy subjects are presented and preliminary results demonstrate the potential of this method to complement perfusion imaging for the detection and follow up of angiogenesis in patients with brain tumors.
Citation:Ben Bashat D, Artzi M, Ben Ami H, Aizenstein O, Blumenthal DT, et al. (2012) Hemodynamic Response Imaging: A Potential Tool for the Assessment of Angiogenesis in Brain Tumors. PLoS ONE 7(11): e49416. doi:10.1371/journal.pone.0049416
Editor:Jay Pillai, Johns Hopkins School of Medicine, United States of America
ReceivedJuly 10, 2012;AcceptedOctober 10, 2012;PublishedNovember 27, 2012
Copyright:ß2012 Ben Bashat et al. This is an open-access article distributed under the terms of the Creative Commons Attribution License, which permits unrestricted use, distribution, and reproduction in any medium, provided the original author and source are credited.
Funding:This study was funded by the James S. McDonnell Foundation (grant number 220020176), http://www.jsmf.org/. The funders had no role in study design, data collection and analysis, decision to publish, or preparation of the manuscript.
Competing Interests:Tsafrir Kolat was employed by Applied Spectral Imaging, Migdal Haemek at the time of this study. There are no patents, products in development or marketed products to declare. This does not alter the authors’ adherence to all the PLOS ONE policies on sharing data and materials. * E-mail: [email protected]
.These authors contributed equally to this work.
Introduction
Blood vessel visualization and the quantification of different parameters that characterize vessel reactivity and functionality play an important role in the diagnosis and follow-up of several brain pathologies [1]. Previous studies showed high correlations between increased vascularity and tumor malignancy [2,3]. The complex mechanisms of brain tumor neovascularization formation were recently described. In addition to angiogenesis, vessel co-option and vessel mimicry were also evident in glioblastoma tumors, especially following anti-angiogenic therapies [4]. Yet, noninvasive methods for characterizing tumor vasculature and detecting angiogenesis and other neo-vascularization processes are currently limited.
Magnetic resonance imaging (MRI) is the method of choice for the diagnosis and follow-up of patients with brain lesions. In addition to structural imaging, other techniques provide informa-tion regarding brain vascularity and have been increasingly used for clinical decision making. The most common technique is T1
weighted (T1W) post-contrast enhanced imaging, which identifies
applications including diagnosis, grading, and assessment of therapeutic response in patients with brain tumors. Additional methods include dynamic contrast enhancement (DCE), which can provide additional information regarding tissue vasculraity and permeability [9], and arterial spin labeling (ASL), which does not require the use of an exogenous contrast agent and provides vascular information mainly regarding CBF [10].
Blood oxygenation level-dependent (BOLD) MRI was originally proposed by Ogawa et al. [11] to study hemodynamic changes related to neuronal activation, and is currently extensively used in functional MRI (fMRI) studies. BOLD imaging was also used in patients with brain tumors during a given task and during rest (resting-state fMRI), to study brain activation and to distinguish tumoral from non-tumoral tissue [12,13].
BOLD MRI uses deoxyhemoglobin as an endogenous contrast agent, which enables detection of changes in blood flow, volume and oxygenation. Increased BOLD signal can occur due to endogenous effects such as neuronal activity or due to exogenous stimuli such as respiratory challenges of hyperoxia or hypercapnia. Inhalation of pure oxygen causes increased blood oxygenation and reduced blood flow [14], while inhalation of a gas mixture of oxygen with different concentrations of CO2 (i.e. carbogen) was
shown to increase blood oxygenation and flow. Most studies of brain response to respiratory challenges were based on signal changes in T2* imaging [15,16,17].
Oxygen inhalation, with or without various concentrations of CO2, has been previously used for several applications: the evaluation of cerebrovascular responses in healthy subjects [18,19], in patients with brain tumors [15] and in patients with severe carotid stenosis [20]; and for the prediction of tumor response to radiation therapy [17].
Hypercapnic challenge, with brief inhalation of CO2or
breath-holding, has also been used in several applications including: assessment of cerebrovascular reactivity in healthy subjects [21], in patients with intracranial stenosis [16] or with cerebral vasculo-pathy [22]; for understanding the signal mechanism of the BOLD phenomena and for calibrating the fMRI signal [23].
Several animal studies combined both hyperoxia and hyper-capnia to distinguish neural from non-neural contributions to fMRI signals [24]; to study changes in the MRI relaxation in brain tumors [25]; to investigate whether breathing a hyperoxic hypercapnic gas mixture could improve the oxygenation of meningiomas [26]; to characterize cerebrovascular responses to both conditions [27]; and to detect mature vessels resistant to anti-angiogenic therapy [28].
The clinical potential of combining hyperoxia and hypercapnia challenges holds great promise. Yet, only a few human studies combine these two conditions for the assessment of brain lesions [29,30,31]. During hyperoxia challenge all functional blood vessels are expected to show increased BOLD signal due to changes in blood oxygenation. During hypercapnia challenge, only mature blood vessels, coated with pericyte or smooth muscle cell, will show increased BOLD signal due to vasodilatation, whereas new-immature blood vessels (which form part of the tumor neo-vascularization) will show no changes in BOLD signal. Therefore, by combining these two methods we expect to be able to differentiate between normal and abnormal vascularization, a hallmark indicating pathological vascular conditions such as tumor angiogenesis. This methodology may contribute crucial informa-tion to decision-making regarding treatment strategy and for assessment of anti-angiogenic treatment response. The aim of the current study was to evaluate the potential of a protocol combining both hyperoxia (carbogen) and hypercapnia challenges (hemody-namic response imaging (HRI)) for the detection of angiogenesis in
patients with brain tumors. For this purpose, reference values were first established in healthy subjects.
Methods
Study population
Nineteen healthy subjects (12 women, 7 men; mean age 32.8611.6 years; mean body weight 69613 kg) served as a control group. Only subjects with no history of neurological or other diseases and without any brain abnormalities detected by conventional brain imaging were included. The study group comprised seven patients (5 men, 2 women; age range 26– 74 years; mean body weight 70613 kg) with primary brain tumors (six with glioblastoma (GB) - two newly diagnosed and four with recurrent tumors, and one with atypical-meningioma). Patients’ clinical data is presented in Table 1. Approval for this study was granted by the local ethics committee in our institute and written informed consent was obtained from all subjects.
MRI Protocol
MRI scans were performed on a 3T scanner (GE Signa EXCITE HDx, Milwaukee, WI, USA) using a transmit-receive quadrature head coil. The MR protocol consisted of conventional imaging including: 3D inversion recovery spoiled gradient echo sequence T1 weighted imaging (WI) (TR/TE/TI = 6.8/1.8/
450msec), spin-echo T2WI (TR/TE = 10500/114msec) and fluid
attenuation inversion recovery (FLAIR) images (TR/TE/ TI = 10002/117/2500msec). All axial slices were aligned along the fourth ventricle and fronto-orbital gyrus. Dynamic suscepti-bility contrast (DSC) imaging and T1 WI post contrast agent
injection were performed in all patients. DSC imaging was performed using 2D gradient echo echo-planar imaging (GE-EPI) sequence, acquired alongside administration of Gadolinium-DTPA, with injection rate of 5 ml/sec following by a flush saline. Other imaging parameters were: FOV/matrix = 240 mm/ 1286128; TR/TE = 1300/30msec, 13 slices with 5 mm thickness with no gap (located at the tumor area) and 78 repetitions.
HRI was performed using GE-EPI sequence with the following parameters: FOV/matrix = = 240 mm/96x96 (reconstructed to 1286128), TR/TE = 5000/35msec, slices identical to the slices acquired in the conventional imaging sequences. The HRI protocol was applied using a block design paradigm in which subjects inhaled a gas mixture of 95% air+5% CO2(hypercapnia)
or a gas mixture of 95% O2+5% CO2(hyperoxia, i.e. carbogen),
via a standard Hudson face mask, with a rate of 8 pounds per square inch. Initially, optimization of the protocol of both conditions (hyperoxia and hypercapnia) was performed. Based
Table 1.Patients’ clinical information.
Patient
No Age (y) Gender Diagnosis Treatment
1 64 F Atypical Meningioma Untreated 2 26 M Glioblastoma Untreated 3 34 M Glioblastoma Untreated 4 74 F Recurrent Glioblastoma RT+Chemo
5 45 M Recurrent Glioblastoma RT+Chemo 6 58 M Recurrent Glioblastoma RT+Chemo 7 41 M Recurrent Glioblastoma RT+Chemo
on these results, the final protocol included two separate paradigms starting with HRI-CO2 relative to room air serving
as baseline (1 min room air, 1.5 min hypercapnia, 2 min room air, 1.5 min hypercapnia, 1 min room air; total of 7 min) followed by HRI-O2 (1min room air, 1 min hyperoxia, 1.5 min room air,
1min hyperoxia, 1min room air; total of 5.5 min). The two paradigms were separated in time for at least 10 min during which anatomical images were acquired.
Data Analysis
HRI analysis. Following motion correction, maps of percent signal change (DS) during the hyperoxia (DS-O2, carbogen) and
hypercapnia (DS-CO2) challenges were calculated for each subject,
using in-house scripts written in MATLAB and SPM5. The MR signal intensity was correlated to the breathing paradigms (block design analysis), andDS values were calculated only for voxels that passed the statistical threshold of p,0.05, relative to the first inhalation block (in order to avoid physiological adaptation).
Vascular reactivity mismatch (VRM) maps. In order to identify voxels which responded to carbogen but with reduced/ absent response to CO2, VRM maps were calculated. First,DS-O2
andDS-CO2values were normalized, resulting inDDS~ -O2andDDS~
-CO2maps, using the following equations:
~
D
DS-O2(x)~
DS-O2(x){mDS-O2
sDS-O2
~
D
DS-CO2(x)~
DS-CO2(x){mDS-CO2
sDS-CO2
Where: x is the voxel coordinates; DS-O2/DS-CO2 are the DS
values in each voxel on the original maps;mDS-O2/mDS-CO2are
the mean brainDS values andsDSO2/sDSCO2are the standard
deviation (SD) of the brainDS values. Themandsvalues were obtained from the GM and WM areas from both hemispheres in healthy subjects, and from the tumor contra-lateral hemisphere in patients. The GM and WM areas were defined for each healthy subject based on SPM5 segmentation of the HRI-EPI images, by using a probabilistic threshold of 0.8. The ventricle area was excluded using MNI mask. VRM maps were calculated by subtracting the DDS~ -CO2 map from the DDS~ -O2 map for each
subject. The mean and SD values of the VRM in GM and WM of the healthy subjects were measured and served as reference values. In patients, VRM maps were calculated and only voxels above two SD relative to the WM reference value obtained from the healthy subjects were considered as abnormal.
Volumes of interest (VOI) analysis. The tumor areas were defined as the enhanced area in the T1W post contrast images for all patients, excluding patient number 2. This patient had a non enhancing tumor and therefore the tumor area was defined as the hyperintense area in FLAIR images. The tumor contra lateral side (CLS) was defined by flipping the tumor VOI (left-right flip). Mean values of relative CBF,DS-O2and DS-CO2were measured for each VOI. Thresholds were applied to the VRM maps of two SD above mean WM values (for patients number 2–6, having a glial origin lesion), and by two SD above mean GM values (for patient number 1 who had Meningioma). Vascular reactivity index was calculated, representing the number of voxels above the defined threshold (percentage relative to the entire VOI volume).
Perfusion analysis. CBV maps were calculated using the perfusion graphical user interface (Penguin) software (www.cfin.au. dk/software). CBV maps were calculated relative to values in the
normal appearing WM (rCBV) defined manually in the hemi-sphere contra lateral to the tumor at the level of the tumor.
All anatomical images and calculated maps were realigned into the MNI152 standard space using FMRIB’s linear image registration tool (FLIRT, part of FSL).
Histology. Tumor vascularity and vessel-maturation were assessed using histopathological analysis on paraffin-embedded specimens obtained from samples of the tumor tissue (taken from patient number 2 as part of routine surgery protocol). Cell proliferation was assessed by Ki67 immunohistochemistry, tissue vascularity was detected by CD31, and vascular maturation was indicated by anti-SMA. Paraffin sections were immunohistochem-ically stained using the following antibodies: anti-Ki67 clone SP6 (Thermo Scientific, NeoMarkers), anti-CD31 clone JC70A (Dako) and anti-smooth muscle actin (SMA) clone 1A4 (Dako). Immu-nohistochemical staining was performed on the Benchmark XT autostainer (Ventana Medical Systems Inc.) using the I-View DAB detection kit (Ventana).
Statistical analysis. Statistical analysis was performed on data obtained from the healthy subjects (n = 19) using SPSS 12.0 (SPSS Inc., Chicago, IL, USA). Paired sample t-tests were used to compare the meanDS values of the GM and the WM. The mean and SD values of the HRI parameters ( and VRM) obtained from the healthy controls were used as reference values for the patients.
Results
HRI in healthy subjects
Increased MR signal was detected in all healthy subjects during both hyperoxic and hypercapnic challenges in most brain areas. BothDS-O2andDS-CO2maps showed good separation between GM and WM (Figure 1A,B). The mean DS values for both hyperoxic and hypercapnic challenges calculated for GM and WM from all healthy subjects are given in Table 2. MeanDS-O2 and DS-CO2 values obtained from the GM were significantly
higher compared to those obtained from the WM (p,0.001), demonstrating the higher vascularity of this tissue. The brain response to hyperoxic challenge was significantly higher, almost two fold, compared to hypercapnic challenge (p,0.002; Figure 1; Table 2).
Following data normalization, distributions of the normalized values (-O2 and -CO2) in all healthy subjects were similar, yet
several brain areas demonstrated positive VRM. These areas were mainly located in the large veins and arteries and in some cortical areas, as identified by a senior neuro-radiologist. The mean VRM values for GM and WM of the healthy subjects, which served as reference values for the patient group, are given in Table 2.
HRI results in patients
Preliminary HRI results were obtained from seven patients with primary brain tumors, demonstrating the applicability and the
Table 2.Means and standard deviations of HRI values calculated from all healthy subjects.
GM WM GM/WM
DS-O2 2.5460.63 0.7160.30 3.8461.01
DS-CO2 1.3360.33 0.4060.24 3.6960.98 VRM 0.5060.15 0.2260.10
DS = percent signal intensity changes; GM = gray matter; WM = white matter; VRM = vascular reactivity mismatch.
clinical potential of the HRI method. Qualitative and quantitative assessment of the DS and VRM maps were performed in all patients. Values of DS-O2, DS-CO2, VRM and rCBV of all patients in the tumor and contra-lateral areas are presented in Table 3.
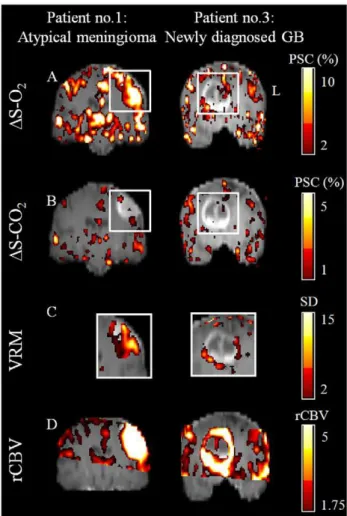
Patients with newly diagnosed tumors (patients 1– 3). Figure 2 shows results obtained in a patient with atypical meningioma (patient number 1) and a patient with newly
diagnosed GB (patient number 3). Increased MR signal was detected in these two patients during hyperoxic challenge, predominantly in the tumor areas (Figure 2A), and to a much lesser extent during hypercapnic challenge (Figure 2B). This divergence is demonstrated on the VRM maps, showing areas that responded to hyperoxia with less response to hypercapnia, within and around these tumors (Figure 2C). In the newly diagnosed GB, a ring-like pattern around the tumor can be observed on the VRM Figure 1. Hemodynamic Response Imaging in the healthy brain.Representative HRI results obtained from a 29 year old healthy subject. (A) DS-O2map; (B)DS-CO2map; (C) the corresponding T1-weighted (anatomical) image; (D) the gray and white matter masks (GM and WM, respectively); the mean time courses of the signal intensity change (%) during hyperoxic challenge (E) and hypecapnic (F) challenges, calculated from the GM VOI of this subject.
doi:10.1371/journal.pone.0049416.g001
Table 3.HRI and rCBV values calculated at the lesion and contra lateral side VOIs.
Patient No rCBV DS-O2(%) DS-CO2(%) Vascular reactivity index1
lesion CLS lesion CLS lesion CLS lesion CLS
1 Atypical Meningioma 8.2 1.9 3.32 2.82 1.09 0.93 19% 9%
2 Glioblastoma 2.5 1.2 1.94 1.93 0.72 1.08 27% 7%
3 Glioblastoma 4.1 NA2 1.10 NA2 0.33 NA2 13% NA2
4 Recurrent Glioblastoma 2.6 1.7 1.00 2.02 0.19 0.60 12% 7% 5 Recurrent Glioblastoma 3.7 1.9 1.05 1.93 0.38 0.87 15% 10% 6 Recurrent Glioblastoma NA3 NA3 1.07 1.50 0.63 0.80 2% 12% 7 Recurrent Glioblastoma NA3 NA3 0.55 1.48 0.09 0.15 13% 43%
DS = percent signal intensity changes; rCBV = relative cerebral blood volume; CLS = contralateral side. 1Vascular reactivity index, number of voxels (in percentages) above the defined VRM threshold. 2Lesion crosses brain midline, thus contralateral side VOI could not be defined.
map. High perfusion values (rCBV) were detected in large areas within and around the tumors in these two patients (more than 1.75 fold increase relative to normal appearing WM) (Figure 2D, Table 3). Quantitative assessment of the tumor and CLS areas in patients 1 and 2, showed high VRM values, indicating the abnormal vascularity of these tumors (Table 3). In the patient with meningioma (patient number 1), increased DS-O2 value was detected with high VRM value indicating abnormal blood vessels. In the second patient with GB, high response to hyperoxia was observed in both brain hemispheres; however high VRM values were measured only in the tumor. These results may be interpreted as representing tumor angiogenesis. The third patient with newly diagnosed GB in whom no increase in mean HRI values were seen from the entire tumor, had a necrotic area within the tumor, a possible explanation for the obtained values.
Figure 3 shows the imaging results obtained from a 26 year old patient with a newly diagnosed GB (patient 2). In this patient, high vascularity was detected by increasedDS-O2and high rCBV, even though this was a non-enhancing tumor (with intact blood brain barrier, BBB). The VRM map revealed a ring pattern around the
tumor, with high vascular reactivity index value (27%) within the tumor, indicating the presence of new immature blood vessels, Pathological evaluation of samples obtained from this tumor indicated high proliferation index, as demonstrated by Ki67 immunohistochemical staining (Figure 2F); and high vascular density, as shown by anti CD31 immunostaining of endothelial cells (Figure 2G), with only a few SMA positive vessels (Figure 2H). Patients with recurrent GB (patients 4–7). In the four patients with recurrent GB previously treated with radiation and chemotherapy, a lower or absent response to both challenges was detected within the tumor and in its surrounding areas. The quantitative results from these tumors and the CLS are given in Table 3. A further notable finding was a prominent negative response during hyperoxia challenge (DS-O2,0) detected in two of these patients (patients 4 and 5) in some of the tumor areas and also in normal-appearing brain areas, distant from the tumor location. Figure 4 shows representative data obtained in patient
Figure 2. Hemodynamic Response Imaging in patients. HRI results obtained from a patient with atypical meningioma (Left; patient number 1) and from a patient with newly diagnosed glioblastoma (Right; patient number 3); For both patients a representative coronal slice through the tumor center of (A)DS-O2maps, (B)DS-CO2maps, (C) VRM maps (of the tumors area which are marked by white rectangle on figures A and B) and (D) rCBV maps. All the maps are superimposed on the anatomical images. Color scales for all maps are located on the right side. PSC- percent signal change; SD- standard deviation.
doi:10.1371/journal.pone.0049416.g002
Figure 3. Hemodynamic Response Imaging and pathological findings.Results obtained from a newly diagnosed patient with GB (patient number 2). Representative sagital (left), axial (center) and coronal (right) orientations taken through the tumor center of (A) T1-weighted images; (B)DS-O2maps; (C)DS-CO2maps; (D) VRM maps (of the tumor area marked by white rectangle on figure 3B,C) and (E) rCBV maps. The maps are superimposed on the anatomical images; color scales for all maps are located on the right side. Immunohistochemical staining of samples from the same tumor with: (F) Ki67 antibody for proliferation; (G) CD31 antibody for endothelial cells indicating vascularity and (H) SMA antibody for smooth muscle cells indicating vascular maturation.
number 4, demonstrating the negative DS-O2 response in the
subcortical WM. Note that these regions were not enhanced in the T1WI image obtained post contrast agent injection and showed
only mild hyperintense signal on the T2FLAIR images.
Discussion
In this study, HRI was applied in healthy controls and in patients with primary brain tumors, via a combined protocol of hyperoxic and hypercapnic challenges, in order to indirectly detect the formation of new, immature abnormal blood vessels i.e. angiogenesis. Normal HRI values were obtained from healthy subjects, and used as a reference for the detection of abnormal areas in patients. Results of this study suggest that HRI may provide additional information beyond conventional MR imaging methods regarding vascular reactivity, functionality and matura-tion and may therefore be useful in the evaluamatura-tion and follow-up of brain tumors.
The optimized HRI protocol used in this study consisted of two separate scans, each with a block-designed paradigm of either hyperoxic or hypercapnic challenges. A single protocol with alternated blocks of both hypercapnia and hyperoxia was also tested, yet lower signal was detected during hypercapnia when applied after oxygen inhalation. Therefore, when separated into two different protocols the hypercapnic challenge was performed prior to hyperoxia. The two paradigms were distinct in length due to differences in hemodynamic response for each gas [21]. The minimal time interval required between the two gas challenges was defined experimentally to be at least 10 minutes, and was supported by previous findings [32]. In addition, in each paradigm, two blocks of gas inhalation were applied in order to improve the reliability of the statistical maps.
Reference values of normal brain response to hyperoxic and hypercapnic challenges were obtained from healthy subjects. As expected, higher response was detected in the GM compared to WM, reflecting higher vascularity, and enabling a good separation between these tissues. In this study, GM/WM ratios were above 3.5 during both hyperoxic and hypercapnic challenges. Previous studies showed that blood flow is about four times higher in GM compared to WM, whereas blood volume is about two-fold higher in GM compared to WM [33,34]. Our results from healthy subjects provide combined information about vascular density and blood-flow that might represent vascular reactivity. In the current study, GM and WM VOIs included the entire tissue based on segmentation of the EPI images, thus minimizing partial volume effects.
In patients with GB, abnormal values within the VRM maps were defined only for voxels with 2 SD above the mean WM reference value obtained from all the healthy subjects. Whereas the selection of WM reference is reasonable for tumors of glial origin such as GB, it is less suitable for meningiomas which arise from the arachnoid villi of the meninges. Since there is no ideal reference tissue within the brain for meningioma, for the patient with meningioma, the VRM maps were defined only for voxels with 2 SD above the mean GM reference value obtained from all the healthy subjects. However, other reference values can be used as appropriate in other pathologies.
In patients with newly diagnosed tumors, areas with increased VRM were detected within and around the tumors, likely indicating the presence of angiogenic immature blood vessels that usually characterize high grade brain-tumors. Increased VMR was also detected in the patient with meningioma. This result demonstrates the additional potential application of the HRI method for patients with extra-cranial lesions. The HRI results were validated in one patient with GB using pathological analysis of the tumor. In this patient, a high response during hyperoxia was detected within and around the tumor, indicating areas of high blood vessel density, further supported by anti CD31 immuno-staining of endothelial cells. In addition, low response during hypercapnia was detected in this tumor, indicating the inability of the blood vessels to vasodilate, characteristic of immature blood vessels that lack smooth muscle coverage. Pathological findings supported this result with the detection of only focal positivity in SMA staining, as expected in such tumors [35]. Additional studies are needed to validate the HRI results with histological findings using stereotactic biopsy. The usage of a combined hyperoxic and hypercapnic challenge and the calculated VRM maps enables monitoring of the maturation status of the tumor blood vessels. This information, which currently can only be obtained from histological evaluation, may contribute significantly to the diagnosis and grading of brain tumors.
A reduced or absent vascular reactivity to both challenges was observed in all patients with recurrent GB, who had previously undergone aggressive treatment including multiple surgeries, radiation and chemotherapies. This pattern may indicate either the direct therapy effects on blood vessels or the effect of tumor progression, resulting in vasogenic edema leading to pressure on the vasculature, both of which may affect vessel reactivity. These findings indicate that the use of the HRI method may be less suitable in patients who have already undergone treatment, yet future studies are needed to assess the use of HRI method to monitor changes following anti-angiogenic therapies which are expected to ‘‘normalize’’ the abnormal tumor blood vessels [36].
Furthermore, in two patients with recurrent GB, large areas with a strong negative response during hyperoxia, and a lack of response during hypercapnia were detected both adjacent to, and Figure 4. Negative DS-O2 response. Representative results
obtained from a patient with recurrent GB (patient number 4), showing negativeDS-O2 response during hyperoxic challenge observed distant from the tumor area. (A) DS-O2map; (B) T1WI post contrast agent injection and (C) fluid attenuation inversion recovery (FLAIR) image. (D) The mean time courses of the signal intensity change (%) during hyperoxic challenge obtained from the area with negative response (VOI is marked by red rectangle on Figure 4A).
distant from the tumors. This phenomenon may be related to ‘‘intracerebral steal’’ effect, attributed to shunting of blood flow away from non-autoregulating ischemic areas by the action of normally reactive vessels in an attempt to increase the flow to ischemic areas [37]. The use of carbogen inhalation, which contains 5% CO2, may induce a similar effect, resulting in reduced
MR signal. GB tumors are usually heterogenic with ischemic areas that may also cause ‘‘intracerebral steal’’. Further studies should test this hypothesis and determine whether these changes are reversible following anti-angiogenic therapy, and whether this finding may predict therapy response.
The strength of this study is the demonstration of the feasibility of the HRI method for indirect structural and functional imaging of brain vascularity. Currently, characterization of vascular tissue properties, and indication of the presence of angiogenesis in patients, can be obtained only based on pathological findings. Thus, non-invasive imaging methods that can provide similar information is of great clinical importance. The combination of HRI with other advanced MRI methods, such as DSC and dynamic contrast enhanced imaging, which provide different vascular features, may assist in tumor diagnosis and follow-up. Contrast-enhanced imaging is the most commonly used technique in brain tumor imaging, representing the BBB breakdown. However, this method is non-specific and lacks sensitivity, particularly in infiltrative high grade gliomas [2]. Although contrast-enhancement usually correlates with tumor malignancy, some high grade tumors do not enhance with contrast agents [38] as was observed in patient number 2. Another common method for brain tumor diagnosis and follow-up is DSC imaging [7,39]. This method provides information regarding blood vessel density and flow; however, it necessitates intravenous access and contrast agent injection. This is not a trivial matter for populations such as pediatric groups, patients who have received extensive chemo-therapy, pregnant women and patients with renal failure. Another limitation of this method is that it only covers partial brain volumes due to the necessity of high temporal resolution. HRI, as
shown in this study, provides functional dynamic information from the entire brain without the need for contrast agent administra-tion, and can thus be used in patients who have contraindications.
Conclusions
This study demonstrates the applicability of the combined hyperoxic and hypercapnic fMRI protocol in healthy subjects and in patients with primary brain tumors. Preliminary results in these patients show that HRI, correlating with pathological findings, may provide complementary vascular information to the DSC method and in combination with additional structural and functional information (such as diffusion weighted imaging) may provide a more comprehensive assessment. Further large-scale studies correlating between HRI and pathological findings are needed in order to better understand and interpret the HRI contrast in normal and pathological brain lesions, and to assess the clinical value of this method in the diagnosis and grading of brain tumors. Future applications may include follow-up of patients with brain tumors receiving anti-angiogenic therapy, early prediction of radiotherapy response and assessment of vascular reactivity to predict stroke risk.
Acknowledgments
We thank Vicki Myers for editorial assistance.
We are grateful to the patients and their families, who so willingly participated in this study.
Author Contributions
Conceived and designed the experiments: DB RA. Performed the experiments: DB RA MA MP OA. Analyzed the data: MA YE TK IS BL HB. Contributed reagents/materials/analysis tools: HB TK YE. Wrote the paper: HB TK YE. Recruited patients: ZR FB AK DTB MP BC. Study Radiologist: OA.
References
1. Jain RK, di Tomaso E, Duda DG, Loeffler JS, Sorensen AG, et al. (2007) Angiogenesis in brain tumours. Nat Rev Neurosci 8: 610–622.
2. Lupo JM, Cha S, Chang SM, Nelson SJ (2005) Dynamic susceptibility-weighted perfusion imaging of high-grade gliomas: characterization of spatial heteroge-neity. AJNR Am J Neuroradiol 26: 1446–1454.
3. Pathak AP, Schmainda KM, Ward BD, Linderman JR, Rebro KJ, et al. (2001) MR-derived cerebral blood volume maps: issues regarding histological validation and assessment of tumor angiogenesis. Magn Reson Med 46: 735–747. 4. Hardee ME, Zagzag D (2012) Mechanisms of Glioma-Associated
Neovascular-ization. Am J Pathol.
5. Ren A, Gao P, Sun Y (2002) Correlation of MR imaging and histopathology after partial resection of normal rabbit brain. Chin Med J (Engl) 115: 247–253. 6. Watanabe M, Tanaka R, Takeda N (1992) Magnetic resonance imaging and
histopathology of cerebral gliomas. Neuroradiology 34: 463–469.
7. Toyooka M, Kimura H, Uematsu H, Kawamura Y, Takeuchi H, et al. (2008) Tissue characterization of glioma by proton magnetic resonance spectroscopy and perfusion-weighted magnetic resonance imaging: glioma grading and histological correlation. Clin Imaging 32: 251–258.
8. Ostergaard L (2005) Principles of cerebral perfusion imaging by bolus tracking. J Magn Reson Imaging 22: 710–717.
9. Tofts PS, Kermode AG (1991) Measurement of the blood-brain barrier permeability and leakage space using dynamic MR imaging. 1. Fundamental concepts. Magn Reson Med 17: 357–367.
10. Sourbron S (2010) Technical aspects of MR perfusion. Eur J Radiol 76: 304– 313.
11. Ogawa S, Lee TM, Kay AR, Tank DW (1990) Brain magnetic resonance imaging with contrast dependent on blood oxygenation. Proc Natl Acad Sci U S A 87: 9868–9872.
12. Feldman SC, Chu D, Schulder M, Pawar R, Barry M, et al. (2009) The blood oxygen level-dependent functional MR imaging signal can be used to identify brain tumors and distinguish them from normal tissue. AJNR Am J Neuroradiol 30: 389–395.
13. Jiang Z, Krainik A, David O, Salon C, Tropres I, et al. (2010) Impaired fMRI activation in patients with primary brain tumors. Neuroimage 52: 538–548. 14. Watson NA, Beards SC, Altaf N, Kassner A, Jackson A (2000) The effect of
hyperoxia on cerebral blood flow: a study in healthy volunteers using magnetic resonance phase-contrast angiography. Eur J Anaesthesiol 17: 152–159. 15. Hsu YY, Chang CN, Jung SM, Lim KE, Huang JC, et al. (2004) Blood
oxygenation level-dependent MRI of cerebral gliomas during breath holding. J Magn Reson Imaging 19: 160–167.
16. Mandell DM, Han JS, Poublanc J, Crawley AP, Fierstra J, et al. (2011) Quantitative measurement of cerebrovascular reactivity by blood oxygen level-dependent MR imaging in patients with intracranial stenosis: preoperative cerebrovascular reactivity predicts the effect of extracranial-intracranial bypass surgery. AJNR Am J Neuroradiol 32: 721–727.
17. Rijpkema M, Kaanders JH, Joosten FB, van der Kogel AJ, Heerschap A (2002) Effects of breathing a hyperoxic hypercapnic gas mixture on blood oxygenation and vascularity of head-and-neck tumors as measured by magnetic resonance imaging. Int J Radiat Oncol Biol Phys 53: 1185–1191.
18. Losert C, Peller M, Schneider P, Reiser M (2002) Oxygen-enhanced MRI of the brain. Magn Reson Med 48: 271–277.
19. Prisman E, Slessarev M, Han J, Poublanc J, Mardimae A, et al. (2008) Comparison of the effects of independently-controlled end-tidal PCO(2) and PO(2) on blood oxygen level-dependent (BOLD) MRI. J Magn Reson Imaging 27: 185–191.
20. Ziyeh S, Rick J, Reinhard M, Hetzel A, Mader I, et al. (2005) Blood oxygen level-dependent MRI of cerebral CO2 reactivity in severe carotid stenosis and occlusion. Stroke 36: 751–756.
21. Yezhuvath US, Lewis-Amezcua K, Varghese R, Xiao G, Lu H (2009) On the assessment of cerebrovascular reactivity using hypercapnia BOLD MRI. NMR Biomed 22: 779–786.
23. Leontiev O, Buxton RB (2007) Reproducibility of BOLD, perfusion, and CMRO2 measurements with calibrated-BOLD fMRI. Neuroimage 35: 175– 184.
24. Sicard KM, Duong TQ (2005) Effects of hypoxia, hyperoxia, and hypercapnia on baseline and stimulus-evoked BOLD, CBF, and CMRO2 in spontaneously breathing animals. Neuroimage 25: 850–858.
25. Muller A, Remmele S, Wenningmann I, Clusmann H, Traber F, et al. (2010) Intracranial tumor response to respiratory challenges at 3.0 T: impact of different methods to quantify changes in the MR relaxation rate R2*. J Magn Reson Imaging 32: 17–23.
26. Rijpkema M, Schuuring J, Bernsen PL, Bernsen HJ, Kaanders JH, et al. (2004) BOLD MRI response to hypercapnic hyperoxia in patients with meningiomas: correlation with Gadolinium-DTPA uptake rate. Magn Reson Imaging 22: 761– 767.
27. Lu J, Dai G, Egi Y, Huang S, Kwon SJ, et al. (2009) Characterization of cerebrovascular responses to hyperoxia and hypercapnia using MRI in rat. Neuroimage 45: 1126–1134.
28. Abramovitch R, Itzik A, Harel H, Nagler A, Vlodavsky I, et al. (2004) Halofuginone inhibits angiogenesis and growth in implanted metastatic rat brain tumor model–an MRI study. Neoplasia 6: 480–489.
29. Muller A, Remmele S, Wenningmann I, Clusmann H, Traber F, et al. (2011) Analysing the response in R2* relaxation rate of intracranial tumours to hyperoxic and hypercapnic respiratory challenges: initial results. Eur Radiol 21: 786–798.
30. Bulte DP, Kelly M, Germuska M, Xie J, Chappell MA, et al. (2012) Quantitative measurement of cerebral physiology using respiratory-calibrated MRI. Neuro-image 60: 582–591.
31. Gauthier CJ, Hoge RD (2012) Magnetic resonance imaging of resting OEF and CMRO(2) using a generalized calibration model for hypercapnia and hyperoxia. Neuroimage 60: 1212–1225.
32. Sechzer PH, Egbert LD, Linde HW, Cooper DY, Dripps RD, et al. (1960) Effect of carbon dioxide inhalation on arterial pressure, ECG and plasma catecholamines and 17-OH corticosteroids in normal man. J Appl Physiol 15: 454–458.
33. Herzog H, Seitz RJ, Tellmann L, Rota Kops E, Julicher F, et al. (1996) Quantitation of regional cerebral blood flow with 15O-butanol and positron emission tomography in humans. J Cereb Blood Flow Metab 16: 645–649. 34. Sourbron S, Ingrisch M, Siefert A, Reiser M, Herrmann K (2009)
Quantification of cerebral blood flow, cerebral blood volume, and blood-brain-barrier leakage with DCE-MRI. Magn Reson Med 62: 205–217. 35. Benjamin LE, Golijanin D, Itin A, Pode D, Keshet E (1999) Selective ablation of
immature blood vessels in established human tumors follows vascular endothelial growth factor withdrawal. J Clin Invest 103: 159–165.
36. Jain RK (2005) Normalization of tumor vasculature: an emerging concept in antiangiogenic therapy. Science 307: 58–62.
37. Symon L (1968) Experimental evidence for ‘‘intracerebral steal’’ following CO2 inhalation. Scand J Clin Lab Invest Suppl 102: XIII:A.
38. White ML, Zhang Y, Kirby P, Ryken TC (2005) Can tumor contrast enhancement be used as a criterion for differentiating tumor grades of oligodendrogliomas? AJNR Am J Neuroradiol 26: 784–790.