AN APPROACH FOR DETECTING CHANGES RELATED TO NATURAL DISASTERS
USING SYNTHETIC APERTURE RADAR DATA
N. Milisavljević a, *, D. Closson a, F. Holecz b, F. Collivignarelli b, P. Pasquali b
a Department of Communication Information Systems & Sensors (CISS), Royal Military Academy, Brussels, Belgium - (nada,
dclosson)@rma.ac.be b
Sarmap, Purasca, Switzerland - (fholecz, fcolli, ppasquali)@sarmap.ch
Commission VI, WG VI/4
KEY WORDS: SAR, Natural disasters, Christchurch, Classification, Urban zones, Data fusion, Coherent change detection
ABSTRACT:
Land-cover changes occur naturally in a progressive and gradual way, but they may happen rapidly and abruptly sometimes. Very high resolution remote sensed data acquired at different time intervals can help in analyzing the rate of changes and the causal factors. In this paper, we present an approach for detecting changes related to disasters such as an earthquake and for mapping of the impact zones. The approach is based on the pieces of information coming from SAR (Synthetic Aperture Radar) and on their combination. The case study is the 22 February 2011 Christchurch earthquake.
The identification of damaged or destroyed buildings using SAR data is a challenging task. The approach proposed here consists in finding amplitude changes as well as coherence changes before and after the earthquake and then combining these changes in order to obtain richer and more robust information on the origin of various types of changes possibly induced by an earthquake. This approach does not need any specific knowledge source about the terrain, but if such sources are present, they can be easily integrated in the method as more specific descriptions of the possible classes.
A special task in our approach is to develop a scheme that translates the obtained combinations of changes into ground information. Several algorithms are developed and validated using optical remote sensing images of the city two days after the earthquake, as well as our own ground-truth data. The obtained validation results show that the proposed approach is promising.
* Corresponding author
1. INTRODUCTION
Change detection approaches (Lu et al., 2004; Mercier et al., 2009) are used to identify or emphasize significant differences in images acquired at different times (differences in the state of an object or a phenomenon by observing it at different times). Thus, change detection provides the ability to quantify changes using multi-spectral, multi-resolution and/or multi-source imagery captured at different moments.
Land-cover changes occur naturally in a progressive and gradual way. However, due to anthropogenic activities, they may happen rapidly and abruptly sometimes. Very high resolution remote sensed data acquired at different time intervals can help in analyzing the rate of changes as well as the causal factors (or drivers of changes). Detecting regions of change in multiple images of the same scene, taken at different times, is of a wide interest since it covers a variety of applications in numerous disciplines (Radke et al., 2005), such as remote sensing, medical diagnosis and treatment or surveillance. In case of remote sensing, land-cover surveillance and classification are among the most explored applications. Nowadays, remote sensing has become an important tool for supplying disaster management too. In particular, in case of an earthquake (or flood), the rapid detection of damaged houses, buildings and infrastructures has a crucial role for the civil protection rescue activities (Bitelli et al., 2004). In addition, Synthetic Aperture Radar (SAR) systems are becoming widely used in environmental studies thanks to their capability to operate in conditions almost completely independent of the
weather (due to the large signal wavelength) and time (because of the active scene illumination) (Soergel et al., 2005). Thus, the exploitation of SAR sensitivity to changes in scenarios is a promising tool for damage evaluation purposes (Balz et al., 2009; Chini, 2009).
Multi-temporal observations from SAR can be used to detect urban changes in different ways. Firstly, image intensity changes can be analyzed, as in the case of optical imagery. Secondly, one can take advantage from the information on the phase of the returned signal, which is specific of the SAR technique (Milisavljević et al., 2010, Milisavljević et al., 2012). In this paper, in order to detect changes on the surface caused by an earthquake, we take into account two important features: - the SAR amplitude (intensity) changes, related to changes in the magnitude of the radar return; as stated in (Matikainen et al., 2006), factors that affect the intensity of radar echoes from surface objects, especially for urban environments, are various and complex; for example, the backscattering coefficient determined after the collapse of an isolated building is likely to be smaller than the one obtained prior to the event, while the backscattered returns in the case of orderly uniform buildings with flat roofs become stronger in the post-earthquake image (Matsuoka and Yamazaki, 2004);
(Fanelli et al., 2000) and its value, both on short-term and long-term acquisition interval basis, is typically high, so its abrupt changes might be a good indicator of potential damages. Since they provide different pieces of information concerning changes in the scene, by combining these two features before and after the earthquake, we expect to obtain richer and more robust information about the scene changes possibly related to an earthquake.
2. BUILDINGS IN SAR
In normal urban situations, there are typically four zones in SAR amplitude images of buildings (Balz and Liao, 2010; Brunner et al., 2010):
- corner reflection (double-bounce scattering, the strength of which strongly depends on the height of the building and its aspect angle, i.e. the orientation of the building relative to the viewing direction of the sensor),
- layover (mixed zone of building-wall reflections and ground reflections),
- roof (behind the layover, but often dark because of its material, though chimneys are visible),
- shadow (building shadow is often inseparable from the surrounding area such as roads; shadows may also be overlapped by the layover of surrounding buildings).
In case of an earthquake, various types of damages are possible, so a variety of backscattering cases may occur as well, such as: A. a collapsed building, with no strong reflections at the building corner (but some weaker reflections on corners of the remaining walls can still be present), various double bounces between the parts of the ruins, possible appearance of strong direct reflections, no layover area, possible foreshortened area, reduced or even missing shadow areas;
B. a collapsed building close to an undamaged building, with various possible situations, in function of the damage and its position with respect to the undamaged building and the SAR orbit (e.g., if the buildings share the sale undamaged wall, a strong double-bounce reflection might occur);
C. a partly destroyed building, with different possible situations here as well, depending on the degree of the damage and its position with respect to the SAR illumination (for example, if the roof has collapsed, strange shadow shapes may appear). Thus, the backscattering process of damaged buildings is very complex and may result in amplitude images that are very difficult to interpret and determine whether some response is related to the damage or not. Coherence (phase) data provide another information layer which may help in distinguishing damage from the rest and that is the path we follow here.
3. STUDY AREA AND DATA
On 4 September 2010, the magnitude 7.1 earthquake struck the Canterbury region in New Zealand's South Island, which caused significant damage to Christchurch (New Zealand's second-most populous city) and the central Canterbury region, but there were no direct fatalities. On 22 February 2011, a 6.3 earthquake struck the Canterbury region again. This time, the earthquake was centred 10 kilometres south-east of the centre of Christchurch and 181 people were killed. This earthquake caused widespread damage across Christchurch, especially in the central city and eastern suburbs, with damage aggravated by buildings and infrastructure already being weakened by the 4 September 2010 earthquake and its aftershocks. Significant liquefaction affected the eastern suburbs as well.
The identification of damaged or destroyed buildings using SAR data is a challenging task. Our approach is to apply change detection by comparing post-seismic to pre-seismic images, both in amplitude and in phase, and then to combine the obtained changes. A special task here is to develop a scheme that translates the obtained combinations of changes (e.g., low-amplitude and coherence before the earthquake, high-amplitude and low-coherence after) into ground information (possible landscape classes). The reason why we have not introduced this scheme directly in the algorithm but rather left it apart is to be able to cover a wider range of situations with this algorithm (such as types of damage in war-conflict scenarios). Namely, the algorithm can be applied rapidly as such to these other situations without adaptations, and the only changes would be introduced in the translation scheme (since possible landscape classes would be different).
Figure 1. Average amplitude image of Christchurch before the earthquake of 22 February 2011
Figure 2. Average amplitude image of Christchurch after the earthquake of 22 February 2011
Figure 3. Average coherence image of Christchurch before the earthquake of 22 February 2011
Figure 4. Coherence image of Christchurch after the earthquake of 22 February 2011
Note that we work on average data here when possible, in order to decrease the influence of noise (speckle), on the one hand, and to keep track of only significant changes, on the other hand, but that the method we describe afterwards can be applied as soon as we have one amplitude image before and one amplitude image after an event, as well as one coherence image before and one after the event.
Figure 5. Comparison of the average amplitude data before and after the earthquake
4. OUR METHOD FOR MAPPING DISASTER ZONES
Using levels estimated automatically from the image histogram, we threshold images from Figures 1 and 2, that is, amplitude images before and after the earthquake. Our threshold method finds, through an iterative procedure, the level by which the image is divided in equally populated parts thus providing an automatic tool for optimal binary image segmentation.
The obtained thresholded amplitude images before and after the earthquake are then combined and the resulting image is given in Figure 5, where the colour code is as follows:
- black - low amplitude both before and after the earthquake, - green - high amplitude before and low amplitude after the earthquake,
- red - low amplitude before and high amplitude after the earthquake,
- white - high amplitude both before and after the earthquake. Taking into account the meaning of low and high amplitudes, we might say that the black zones correspond to surfaces that were smooth both before and after the earthquake (such as water, mud flat areas, smooth roads and streets), that the white zones correspond to surface that remained diffuse, i.e. rough (such as rough roads, non-flat roofs, metal elements on the roofs), etc.
Figure 6. Comparison of the (average) coherence data before and after the earthquake
If we apply the same thresholding and combination procedure to the coherence images from Figures 3 and 4, using the same colour code as for Figure 5, we obtain the image given in Figure 6:
- black - low coherence both before and after the earthquake, - green - high coherence before and low amplitude after the earthquake,
- red - low coherence before and high after the earthquake, - white - high coherence both before and after the earthquake. Similarly as above, if we take into account the meaning of low and high coherences, we might say that the black zones correspond to surfaces that were active both before and after the earthquake (such as roads and streets), that the white zones correspond to surfaces that remained non-active (such as buildings), etc.
On the one hand, the intensity correlation is related to change in the magnitude of the radar return. One of the main problems is that this magnitude might remain the same, even if different backscattering mechanisms are involved before and after the damage.
On the other hand, coherence is influenced by the phase difference between radar returns, related to the spatial arrangement of the scatterers within the pixel and thus to their possible displacements. In urban areas, one of the main problems of the usefulness of coherence is that if the baseline is moderate, coherence is more sensitive than intensity to the damage level.
amplitude, C - coherence, 1 - before the earthquake, 2 - after the earthquake, L - low, H - high.
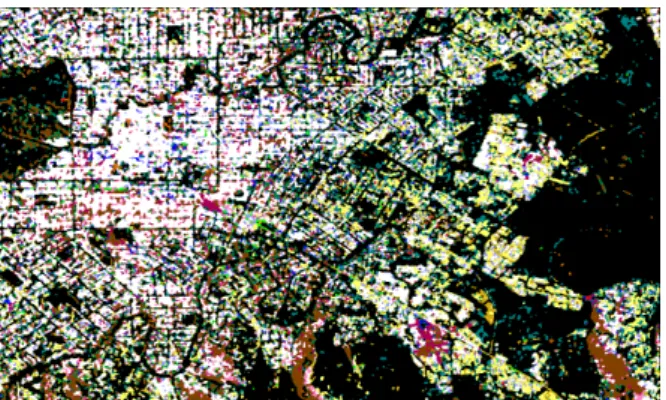
Figure 7. Comparison of the amplitude and coherence changes before and after the Christchurch earthquake; the meaning of
the colours is given in Table 1
Colour Meaning
A1L, A2L, C1L, C2L A1L, A2L, C1H, A2L A1L, A2L, C1L, C2H A1L, A2L, C1H, C2H A1H, A2L, C1L, C2L A1H, A2L, C1H, C2L A1H, A2L, C1L, C2H A1H, A2L, C1H, C2H A1L, A2H, C1L, C2L A1L, A2H, C1H, C2L A1L, A2H, C1L, C2H A1L, A2H, C1H, C2H A1H, A2H, C1L, C2L A1H, A2H, C1H, C2L A1H, A2H, C1L, C2H A1H, A2H, C1H, C2H
Table 1. Colour code for Figure 7
5. INTERPRETATION OF THE OBTAINED RESULTS
In order to make use of the obtained result, we develop a scheme that translates the obtained combinations of changes into possible landscape classes. This step is scenario-related since the set of possible or interesting landscape classes varies with the application. In case of an earthquake, we have developed the translation scheme as given in Table 2. Here, specular surfaces are alternatively named as smooth since they have mirror-like reflections, while the rougher the surface, the more diffuse the scattering of waves.
The method presented here does not ask for external knowledge sources. However, the possibility of including such sources is still possible at different levels, from the change detection step (where we can introduce knowledge on specific classes at specific points in order to bias the change detection process, i.e. search for classes having similar behaviour both in amplitude and in coherence domain) up to the interpretation (where classes in Table 2 would then become more specific, e.g.). In addition, spatial regularization is the final step of our method where the central pixel obtains either mean or median value of its neighbourhood. In such a way, we smooth the image which might cause disappearance of some isolated points that could correspond to some very local changes, so if the user wants to
preserve the output before the spatial regularization, that final step can be easily excluded from the program.
Finally, the result obtained here can be used and presented in different ways, depending on the user needs, and some of these possibilities are given in the following section.
Meaning Possible situations A1L, A2L,
C1L, C2L
Specular surface (water, mud flat areas, trees, shrubs)
A1L, A2L, C1H, A2L
Specular surface such as a roof or low-traffic smooth streets affected by the earthquake A1L, A2L,
C1L, C2H
Specular surface such as a high-traffic smooth street affected by the earthquake A1L, A2L,
C1H, C2H
Not affected specular surface (e.g., roofs or low-traffic smooth streets)
A1H, A2L, C1L, C2L
Diffuse surface becoming specular due to liquefaction, but remaining highly active A1H, A2L,
C1H, C2L
Diffuse surface becoming specular, not active before, active after (e.g., low traffic road becoming active due to mud cleaning operations)
A1H, A2L, C1L, C2H
Diffuse surface that became specular, active before, not active after (e.g., high-traffic rough road becoming smooth due to mud, not used anymore)
A1H, A2L, C1H, C2H
Rough surface becoming specular with no activity before nor after (low-traffic road affected by liquefaction, e.g.)
A1L, A2H, C1L, C2L
Smooth surface becoming rough and being active before and after (e.g. a smooth high-traffic street becoming rough due to fractures, and being used before and after)
A1L, A2H, C1H, C2L
Specular surface such as a roof becoming rough (e.g., a collapse of chimney) and not being active before while it loses coherence as it keeps on collapsing
A1L, A2H, C1L, C2H
Specular surface becoming rough, active before while not being active after (smooth high-traffic street becoming rough due to fractures and not being used after)
A1L, A2H, C1H, C2H
Specular surface such as a roof becoming rough (due to a collapse of chimney, e.g.) and not being active before nor after
A1H, A2H, C1L, C2L
Diffuse surface remaining diffuse and being active before and after (e.g., non-flat roofs not being affected by the earthquake) A1H, A2H,
C1H, C2L
Diffuse surface such as a rough road affected by liquefaction
A1H, A2H, C1L, C2H
Surface remained rough, but the angle of the illuminated surface changed so that the coherence increased
A1H, A2H, C1H, C2H
Surface remained rough and not active, not being affected by the earthquake
Table 2. Possible classes – interpretation of the obtained result
6. PRESENTATION OF THE OBTAINED RESULTS
2 1
3
4
5 6 Then, we can fix values of two features and look what happens
with the other two features. For example, if we want to see what happens regarding the coherence with the pixels where the amplitude remains high (so, A1H and A2H), we obtain the image shown in Figure 9. In this particular case, thus, we are interested in (changes in) activities in the zones having a rough surface both before and after the earthquake: a low coherence means there is an activity, a high coherence means there is no activity, C1L and C2H means there was an activity before the earthquake, but there is no activity after the earthquake etc.
Figure 8. Black: A1L, A2L, C1L, C2L; white: background (all other combinations)
Figure 9. A1H and A2H. The colour code is: C1L, C2L - grey; C1H, C2L - green; C1L, C2H - blue; C1H, C2H - red;
background (all other combinations) - white.
Figure 10. C1H and C2H. The colour code is: A1L, A2L - grey; A1H, A2L - green; A1L, A2H - blue; A1H, A2H - red;
background (all other combinations) - white.
Similarly, Figure 10 contains the image obtained by fixing the coherence values to C1H and C2H, meaning that we are this
time interested to see what happens with the smoothness of the surface for zones which are not active neither before nor after the earthquake (to see, e.g., where some smooth roofs became rough because of a collapse or cracks, or where low-traffic rough streets became smooth due to a possible liquefaction). Last but not least, using the obtained results, we can display zones that are affected by the earthquake vs. zones that are not affected by the earthquake (Figure 11). The affected zones can be further separated based on their activity before and after the earthquake as shown in Figure 12.
Figure 11. Zones not affected by the earthquake (black) vs. zones affected by the earthquake (white)
Figure 12. Zones not affected (black) vs. zones affected by the earthquake: yellow - always active, green - always not active, blue - active before and not active after, red - not active before
and active after the earthquake.
7. VALIDATION – SOME RESULTS
We have aerial photos of the region of Christchurch from two days after the earthquake, as well as ground-truth information from our mission. Thanks to that, we have a possibility to validate the results. We discuss here some of the validation points, randomly chosen, in order to illustrate the quality of the results shown in the previous section. Note that we are currently working on a more general validation scheme, by translating the ground-truth information into the corresponding classes from Table 2, in order to obtain an automatic validation procedure that would handle easily and rapidly the huge number of validation points.
Positions of six randomly chosen validation points are shown in Figure 13.
7.1 Validation point 1
An enlarged cut of the change detection result given in Figure 7 that contains validation point 1 from Figure 13 is shown in Figure 14 (left). At the central point itself, the change detection result indicates that it is class (A1H, A2H, C1L, C2L), so a diffuse surface remaining diffuse (e.g., non-flat roofs not being affected by the earthquake). Ground-truth information, obtained from the aerial photo of this region (Figure 14 right), shows that it is a tilted roof, i.e., that the change detection result is correct.
Figure 14. Left: a cut of the change detection result from Figure 7 that corresponds to the surroundings of validation point 1 in
Figure 13; right: an aerial photo that covers the region of validation point 1.
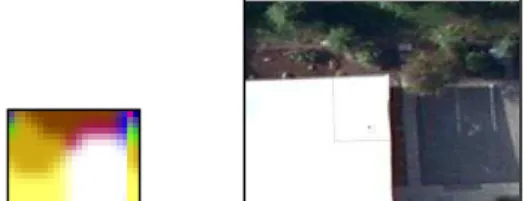
7.2 Validation point 2
In Figure 15 (left), we show an enlarged cut of the change detection result given in Figure 7 that contains validation point 2 from Figure 13. The change detection result marks the central point as class (A1H, A2H, C1L, C2L), so, again, a diffuse surface remaining diffuse (such as non-flat roofs not affected by the earthquake). The ground-truth information (Figure 15 right), shows that, at that place, there is a roof, a garden, vertical walls, and waste, not affected by the earthquake indeed.
Figure 15. Left: a cut of the change detection result from Figure 7 that corresponds to the surroundings of validation point 2 in
Figure 13; right: an aerial photo that covers the region of validation point 2.
7.3 Validation point 3
An enlarged cut of the change detection result given in Figure 7, which contains validation point 3 from Figure 13, is presented in Figure 16 (left). The change detection result indicates that it
is class (A1L, A2L, C1L, C2L), so a specular surface such as water, mud flat areas, not affected by the earthquake. Ground-truth information, obtained from the aerial photo of this region (Figure 16 right), proves that it is water in reality.
Figure 16. Left: a cut of the change detection result from Figure 7 that corresponds to the surroundings of validation point 3 in
Figure 13; right: an aerial photo that covers the region of validation point 3.
7.4 Validation point 4
Figure 17 contains an enlarged cut of the change detection result given in Fig. 7, which covers validation point 4 from Figure 13. The change detection result indicates that it is, again, class (A1L, A2L, C1L, C2L), so a specular surface such as water or mud flat areas. Ground-truth information, obtained from the aerial photo of this region (Figure 17 right), proves that it is mud indeed, which, in turn, means that the change detection result is valid again.
Figure 17. Left: a cut of the change detection result from Figure 7 that corresponds to the surroundings of validation point 4 in
Figure 13; right: an aerial photo that covers the region of validation point 4.
7.5 Validation point 5
An enlarged cut of the change detection result given in Figure 7 that contains validation point 5 from Figure 13 is presented in Figure 18 (left). The change detection result labels the central point as class (A1L, A2L, C1H, C2H), so a specular surface such as a roof or low-traffic smooth streets not affected by the earthquake. The aerial photo of this region (Fig. 18 right), representing the ground-truth information, shows that it is a parking place (so a smooth surface), not affected by the earthquake indeed.
Figure 18. Left: a cut of the change detection result from Figure 7 that corresponds to the surroundings of validation point 5 in
7.6 Validation point 6
In Figure 19 (left), we show an enlarged cut of the change detection result given in Figure 7 that contains validation point 6 from Figure 13. At the central point itself, the change detection result suggests that it is class (A1H, A2H, C1L, C2H), that is, a surface that remained rough, but the angle of the illuminated surface changed so the coherence increased (e.g., a roof that got tilted due to the earthquake). The aerial photo of this region (Figure 19 right), representing the ground-truth information, shows that it is a flat roof and a parking, but it is difficult to judge from the photo whether the roof has tilted with respect to its state before the earthquake. This means that the further validation is necessary, but that it is highly possible that we have found a roof that changed its angle, so that using the change detection approach, involving both amplitude and phase information, we can indeed detect changes that are not visible from aerial photos alone. That would be an important achievement of the proposed method and the proof of its usefulness as it is aimed indeed in detecting changes where methods using only amplitude information would fail. However, further analysis in this direction is necessary in order to derive such general conclusions and, as said earlier, our on-going validation analysis should tell us more in this sense as well.
Figure 19. Left: a cut of the change detection result from Figure 7 that corresponds to the surroundings of validation point 6 in
Figure 13; right: an aerial photo that covers the region of validation point 6.
8. CONCLUSION
Natural disasters such as earthquakes present a challenge for remote sensing damage mapping techniques and a great test of their usefulness. Multi-temporal Synthetic Aperture Radar (SAR) observations may be used to detect such changes in an urban environment since the intensity correlation provides information about changes in the magnitude of the SAR return, while the technique of coherent change detection in repeat-pass SAR imagery has the potential to detect very subtle scene changes such as changes in man-made targets or potential human activities.
This paper deals with the mapping of the impact zones of an earthquake using SAR data. The case study is the Christchurch earthquake from February 2010. We present a new mapping method and validate it using the optical remote sensing images of the city two days after the earthquake, as well as our own ground-truth data. A first step of the proposed method consists in finding amplitude changes as well as coherence changes before and after the earthquake. In a next step, we combine these changes in order to obtain richer and more robust information on the origin of various types of changes possibly induced by an earthquake.
This method does not need any specific knowledge source about the terrain, but if such sources are present, they can be easily integrated in the method as, for example, more specific descriptions of the possible classes. The first validation steps
show that the proposed method gives results in accordance with the field reality.
The proposed method can be applied to other situations (such as flood or types of damage in war-conflict scenarios) without significant adaptations: the only changes would have to be introduced in the translation scheme, since possible landscape classes would be different.
In a future work, a more general validation scheme than the one presented here will be developed, in order to obtain an automatic validation procedure that would handle easily and rapidly the huge number of validation points.
ACKNOWLEDGEMENTS
The Italian Space Agency and e-GEOS are acknowledged for the provision of the Cosmo-SkyMed data.
This work has been done in the scope of the SPARE-SAFE project launched by the Belgian Ministry of Defense.
REFERENCES
Balz, T., Perissin, D., Soergel, U., Zhang, L. and Liao M., 2009. Post-seismic infrastructure damage assessment using high-resolution SAR satellite data. In: 2nd International Conference on Earth Observation for Global Change, Chengdu, China, pp. 180-191.
Balz, T. and Liao M., 2010. Building-damage detection using post-seismic high-resolution SAR satellite data. International Journal of Remote Sensing, 31(13), pp. 3369-3391.
Bitelli G., Camassi, R., Gusella, L. and Mognol, A., 2004. Image change detection on urban area: the earthquake case. In: Int. Arch. of the Photogrammetry, Rem. Sens. and Spatial Information Sciences, Istanbul, Turkey, XXXV, Part B, pp. 692-697.
Brunner, D., Lemoine, G., Bruzzone, L. and Greidanus, H., 2010. Building height retrieval from VHR SAR imagery based on an iterative simulation and matching technique. IEEE Transactions on Geoscience and Remote Sensing, 48(3), pp. 1487-1504.
Chini, M., 2009. Earthquake damage mapping techniques using SAR and Optical remote sensing satellite data. In: Advances in Geoscience and Remote Sensing (G. Jedlovec, Ed.), InTech, Vienna, Austria, chapter 12, pp. 269-278.
Fanelli, A., et al., 2000. Understanding ERS Coherence over Urban Areas. In: ERS-Envisat Symposium: Looking Down to
Earth in the New Millennium, ESA-SP-461 (Editor),
Gothenburg, Sweden, unpaginated CD-ROM.
Lu, D. et al., 2004. Change Detection Techniques. International Journal of Remote Sensing, 25(12), pp. 2365-2407.
Matikainen, L., Hyyppä, J. and Engdahl, M.E., 2006. Mapping Bulit-Up Areas from Multitemporal Interferometric SAR Images - A Segment-based Approach. Photogrametric Engineering & Remote Sensing, 72(6), pp. 701-714.
Geoscience and Remote Sensing Symposium (IGARSS’04), Anchorage, AK, USA, pp. 1099-1102.
Mercier, G., Derrode, S., Trouvé, E. and Bombrun, L., 2009. Change detection in remote sensing observation. In: Multivariate Image Processing: Methods and Applications (J. Chanussot, Ch. Collet and K. Chehdi, Eds.), Digital Signal and Image Processing Series, ISTE Ltd and John Wiley & Sons Inc.
Milisavljević, N., Closson, D. and Bloch, I., 2010. Detecting potential human activities using coherent change detection. In: International Conference on Image Processing Theory, Tools and Applications (IPTTA10), Paris, France, pp. 482-485.
Milisavljević, N., Holecz, F., Bloch I., Closson, D. and Collivignarelli, F., 2012. Estimation of crop extent using multi-temporal PALSAR data. In: IEEE International Geoscience and Remote Sensing Symposium (IGARSS), Munich, Germany, pp. 5943-5946.
Preiss, M., Gray, D.A. and Stacy, N.J.S., 2006. Detecting Scene Changes Using Synthetic Aperture Radar Interferometry. IEEE Transactions on Geoscience and Remote sensing, 44(8), pp. 2041-2054.
Radke, R.J., Andra, S., Al-Kohafi, O. and Roysam, B., 2005. Image Change Detection Algorithms: A Systematic Survey. IEEE Transactions on Image Processing, 14(3), pp. 294-307.
Soergel, U., Michaelsen, E., Thoennessen, U. and Stilla, U., 2005. Potential of high-resolution SAR images for urban analysis. In: IEEE/ISPRS Joint workshop on remote sensing and data fusion over urban areas (Urban 2005), Vol. XXXVI-8/W27, Tempe, AZ, USA, unpaginated CD-ROM.
Touzi, R., et al., 1999. Coherence Estimation for SAR Imagery. IEEE Transactions on Geoscience and Remote sensing, 37(1), pp. 135-149.