Preparing the Terrain: Conditioning Factors for the
Regionalization of the Vote for Federal Deputy in São Paulo
*Glauco Peres da Silva
Universidade de São Paulo, São Paulo, São Paulo, Brazil
Graziele Silotto
Universidade de São Paulo, São Paulo, São Paulo, Brazil
This article proposes a new interpretation of the regional distribution of votes in the dispute for legislative offices in Brazil. The literature has traditionally understood regionalization to be evidence that politicians deliberately create zones of influences in certain areas. We argue, however, that other dimensions of the Brazilian electoral system, notably the large size and magnitude of electoral districts, reinforce the information that reaches voters and adds value to geographic aspects, such as the home city of the candidates, accounting for the spatial concentration of votes. Using new, previously unpublished, data on the hierarchy of cities, the results for São Paulo between 1998 and 2014 confirm this interpretation. This result suggests a new theoretical understanding about how the Brazilian political system works by introducing another explanation for how certain areas become influential, thereby revealing new research agendas.
Keywords: Electoral incentives; proportional representation; district
magnitude; Congressmen, regionalization of votes.
(*) http://dx.doi.org/10.1590/1981-3821201800020006
This publication is registered under a CC-BY Licence.
For data replication, see www.bpsr.org.br/files/archives/Dataset_Silva_Silotto
raditional interpretations of the Brazilian electoral system are based on its incentives for disaggregation and the historical explanations for how political parties were formed. On the one hand, Brazilian parties do not have strong roots in society, and are instead patronage machines (SAMUELS, 1997; 2002); on the other hand, this disaggregation arises from the use of open-list proportional representation (PR) in electoral districts with large magnitudes. Furthermore, coalitions and high numbers of candidates are other reasons that put the system under risk of collapse. The existence of an electoral connection (MAYHEW, 1974) dooms the system to failure.
Our understanding of the incentives of electoral systems, however, comes from comparative studies, which implies that the effect of a given institutional configuration is relative; it does not apply in absolute terms. This leads to two findings in Brazil: 01. there are other factors present in the electoral arena besides those mentioned above; and 02. the incentive for the personal vote, although present, can have a marginal effect in comparison to others. Put this way, this is not a new argument. When Carvalho (2003) and Nicolau (2006) discussed the behavior of deputies, their empirical observations led them to assume the possibility of different tactics, despite the rules being the same throughout the entire country. Although personalism exists, not all deputies act as though that were the only incentive (ANDRÉ, DEPAUW and MARTIN, 2016), and we still know little about their different strategies. Moreover, the importance of context for the formation of these strategies for Brazil still has not been evaluated.
It is necessary, therefore, to make progress identifying other factors that act upon politicians in regard to elections. Our argument is that there are two other incentives to consider that are different from those stemming from the electoral connection: the institutional tendency toward the spatialization of the vote and the type of electoral race. The first characteristic is not the result of any purposeful actions by politicians through their relationship with the electorate, but instead from the fact that the electoral contest takes place in a PR (proportional representation) system. Latner and McGann (2005) argue that parties adopt strategies that depend on regionalization, which creates spatial patterns of votes in PR systems. These patterns are not choices of the politicians involved, but rather a restriction imposed by electoral rules.
The second characteristic is indicated by the high magnitude of the electoral districts (BLAIS and LAGOS, 2009). This incentivizes large numbers of candidates to run
and amplifies the communication difficulties between politicians and voters. When districts have large magnitudes, both politicians and voters have difficulties coordinating and anticipating which candidates will be competitive, making the number of candidates larger than ideal. In addition, these candidates compete against one another for contact with voters. This contest is mediated by the distribution of the population throughout the territory, and therefore, by geographic relationships.
In this context, both the spatialization of the vote and the electoral race are subject to the relationships established between voters, which will in turn influence the information flow of the candidates, the dispersion of the votes, and candidates' chances of getting elected. Both dimensions reduce the candidates' control of how word of their candidacy gets spread and of how communication is established with voters. As a result, the election is subject to information flows and is conditioned geographically and socially. These relationships, which are formed outside of the electoral contest, serve as the structure within which the competition is established and parties' strategies are built. The relevance of these dimensions is conditioned by district magnitude, which is reflected by in the dispersion of votes throughout the territory.
As far as we could see, such an interpretation is new to the Brazilian case. Ames (2003), for example, bases his study on the idea that the regionalization of votes will occur because of the direct relationship between politicians and voters that takes place through the practice of pork barrel politics1. In order to evaluate this new perspective, we use REGIC-IBGE data2 (2007) as a proxy for the structure of relationships between municipalities. REGIC establishes the hierarchy between cities in accordance with the flows of people, commerce, communication, etc. These relationships compose a basic network to which every candidate and voter is subject; as a result, they influence both politicians and voters3, if not necessarily homogenously4. As a result, this article looks to make both empirical (by using new data to evaluate electoral results) and theoretical
_____________________________________________________________________________________________________ 1 The critique of Melo (2005) is scathing in this respect.
2 Regional Influences of Cities (REGIC – IBGE), whose initial benchmark was linked to the
Division of Brazil study on functional urban regions in 1966, had the goal of understanding the relationships between municipalities through an analysis of flows of goods and services.
3 Candidates linked to a specific social segment, such as teachers or members of the military, use
this set of relationships concomitantly. We use the broadest and most basic version in order to take the argument to its extreme.
4 Candidates with different resources, such as access to the media, would find it easier to go
(by applying a new explanatory framework) contributions to the study of dynamics of legislative elections in Brazil.
This article is divided into four more sections. The next section will reconstruct the traditional argument, reinforcing electoral incentives that are rarely explored and showing the importance of the composition of networks for conditioning the vote. Next, a methodological section introduces a strategy for identifying these areas, which is followed by an empirical section on evaluating elections. We then conclude with a discussion section and final considerations.
Which Institutional Incentives?
The traditional interpretation of the Brazilian political system understands its incentives for political behavior as stemming from electoral rules, circling back to the 1988 Constitution5. Referring to these rules, it argues that the latitude for politicians to act stems from open-list PR and increases intra-party competition, creating incentives for politicians to engage in individualist behavior, which consequently weakens parties (CAREY and SHUGART, 1995; SAMUELS, 2002). The implications of this argument would be seen in Congressmen behaving in undisciplined ways, chasing the personal vote, and focusing on localist strategies to the detriment of national discussions, which reduces parties to 'patronage machines' (SAMUELS, 2002). This argument is based off of the concept of the electoral connection (MAYHEW, 1974), which is mobilized by Ames (1995a, 1995b, 2003) to identify, within these incentives, the possibility that politicians' strategic actions will be reflected in the spatial dimension of the vote.
Alternatively, Latner and McGann (2005) single out other institutional characteristics in order to explain spatial voting patterns. They show that geographical representation is a component of the PR system, and that parties' strategies stem from that. Voters vote for candidates who are geographically proximate or are similar in terms of class, race, or gender, and are able to combine these characteristics (LATNER and McGANN, 2005, p. 710). This occurs despite the actions taken by representatives, who are structural elements of the system. Their strategic action recognizes the incentive for regionalization. As a result, parties have two reasons to regionalize their
_____________________________________________________________________________________________________ 5 Such an arrangement between a strong federalism, with electoral rules that favor individualist
lists of candidates: maximizing votes and internal political competition.
... a party would be extremely foolish to field a list made up of candidates from only one region (...). Furthermore it may well be useful to have local candidates to campaign in different regions. List places can be viewed as a political resource, which parties aim to distribute in the way that maximizes their total vote, much in the same way as they distribute other campaign resources such as money. (LATNER and McGANN, 2005, pp. 712-713).
Even without formal incentives for regionalization, the high magnitude, combined with proportionality, balances the list regionally. Furthermore, Cox (1990, 1997) and Cox and Shugart (1996) point out that, as opposed to majoritarian systems, PR systems encourage the pursuit of small groups of voters. As a result, it becomes possible to see different strategies, whether from parties or from candidates, and regionalization becomes viable for both.
This discussion touches on the Brazilian case because electoral districts are broad in terms of both geography and magnitude; as a result, this tendency to regionalize applies: a sub-districtization occurs inside every state (LATNER and McCGANN, 2005). This can be seen in parties' strategies for forming lists of candidates, as shown in declarations by party leaders themselves (CARNEIRO, 2009; RIBEIRO, 2013) and by the fact that different parties have distinct electoral strategies (BRAGA, 2008; BRAGA and AMARAL, 2013; BRAGA, VEIGA and MIRÍADE, 2009; CHEIBUB and SIN, 2015). Parties react differently to the same incentives due to their party organizations (GUARNIERI, 2011), which are reflected in patterns of regionalized voting. In other words, the regionalization of votes becomes a potential component of parties' and candidates' strategies because it is a natural consequence of the magnitude and size of the electoral districts, without implying a certain type of relationship between politicians and voters.
on a more structural plane of ontological explanation. In order to do this, it uses the concept of context, defined as "the geographical scope of specific influences" (AGNEW, 1996, p. 130). According to Agnew (1996), context mediates the political arena as a whole. In this sense, the process of forming constituencies does not come about solely due to serving the population (in order to strengthen the relationship between representatives and voters); it is a consequence of the structure produced by space. This structure is "the micro-geography of everyday life (work, residence, school, leisure, and so on)" (AGNEW, 1996, p. 133) and stimulates local differentiations that are reflected in voting patterns. Johnston (2001) adds that "[V]oting decisions are influenced by spatially-biased information flows (...) which generate not only support for local candidates but also more general 'neighborhood effects'" (JOHNSTON, 2001, p. 4375).
Territory as a political arena has already been explored in political science. Recent research about vote choice points out the importance of the location of politicians and how it is a factor in electoral success (GORECKI and MARSH, 2012; JANKOWSKI, 2016). The birthplace of candidates and their local experience are shortcuts (see MARSH, 1987) that endow voters with basic information for deciding their votes. In Brazil, Terron (2009) refers to the 'geographical dimension of politics'6, saying that "political, economic, and social conditioning factors interact on various geographical scales and can determine significant differences in electoral behavior" (TERRON, 2009, p. 12). There is a relationship between voters' political preferences and social contexts. This idea originates with Key (1949), who shows that American voters' decisions are based on the 'neighborhood effect', by which one's vote is affected by the place of origin or residence of a candidate. As a result, voters have preferences for regional candidates7, to the detriment of others, which is justified by the calculation of promoting local interests, even if they are not organized for the defense of the common interest (KEY, 1949, p. 37). Voters, therefore, do not choose whom to vote for independent of the environment in which they live; this is responsible, via localism, for
_____________________________________________________________________________________________________ 6 It is worth citing Lois (2015) as a recent effort to look at conceptions of place in political
dynamics.
7 Rodden (2010) argues that voters from one party tend to reside in nearby areas, which would
providing the core that gives votes to local candidates or candidates from neighboring cities (KEY, 1949, p. 132).
As a consequence, a candidate depends on the neighborhood effect to firm up her electoral base (TERRON, 2009, p. 30). For the voter, her vote choice is influenced by the context that is most proximate to her everyday life, involving information exchange and relationships with neighboring cities. This process of exchange is influenced by access to the local radio and television networks that cover her residence, by the sale of newspapers, and by the use of transportation between cities. This last factor, in turn, facilitates access to nearby cities' trade and commutes to work, school, etc., because "the biased information flows are likely to be spatially concentrated" (PATTIE and JOHNSTON, 2000, p. 42).
As a result, the incorporation of geographical and socioeconomic dimensions reveals processes that would have remained invisible, yet still contribute to estimating effects on the determinants of one's vote. It is worth reinforcing the idea that "voting is about information" (LAU and REDLAWSK, 2006, p. 17), and that this is not isolated from the social world. It is layered on top of the social world and flows through it toward certain places instead of others. What is relevant is how information about politicians reaches voters for them to decide whom to vote for, thereby explaining patterns of vote dispersion.
By incorporating context and location, we argue that politicians and voters are influenced, for instance, by the space of daily transit, information sources, and the cities that they visit during the campaign and at the moment in which votes are decided. This geographical dimension behaves differently depending on the electoral rules. The magnitude of electoral districts is key because, when added to the population distributions of electoral districts, it influences the possible strategies of parties and candidates. This is because more votes will be determined spatially when there are more seats up for grabs and when the electoral district is larger. This effect can be understood as a consequence of the increase of the cost of campaigns which tend to increase in conjunction with the size of the electorate and the territory. As a result, it becomes more likely that votes will become more concentrated.
analyses about electoral competition, as well as those about the relationship that has been established between congressmen and the electorate. They show how electoral territories are formed and examine the electoral connections that are formed between politicians and their electoral bases. They also supply information that is relevant to campaign strategies and for citizens to monitor representatives from their territory (TERRON, 2012, p. 17). As a result, understanding the underlying socioeconomic dimension becomes important for forming areas in which votes are concentrated.
To sum up, from a strategic point of view, parties will tend to consider the regional characteristics of the district when forming lists of candidates, as well as choose candidates with distinct profiles who activate networks of voters that are segmented in various ways. Candidates are associated with the internal space of the district. The most basic networks, in turn, are those that are formed by different levels of socioeconomic relationships established between voters, which alters the flow of information in the territory. These will be the empirical elements to be investigated in this article.
Methodological discussion
Considering the argument that we have developed, we divided our methodological strategy into two parts. The first identifies the sub-regions into which the electoral district in question is divided. We understand that broad electoral districts are composed of areas that are formed by internal socioeconomic dynamics. Since these areas do not depend on electoral campaigns, identifying them requires information that is exogenous to the political arena. As a result, we use the Regic (Regional Influence of Cities) database from IBGE (2007) (the Brazilian Institute of Geography and Statistics).
The case that we evaluate is the state of São Paulo, which has a very high district magnitude, with 70 seats in play. This is the highest magnitude in Brazil, so we expect that information will flow in certain ways, causing regionalization. Since it is an extreme case, these incentives, if they exist, should be found here. Next, we test our explanation for the regional dispersion of votes in these areas for candidates for Federal Deputy in order to evaluate the relationship between district sub-areas and vote dispersion.
of bigger cities for smaller ones whose inhabitants depend socioeconomically on those larger cities8. Each region was created by starting with a central city at a higher hierarchical level. Next, the evaluation goes to put together indicators that capture the spatial dimension of candidates' votes and comparisons with areas of influence.
To do this, we use the work of Avelino et al. (2011), in which the authors introduce the G index as a form of evaluating the concentration of votes. Silva and Davidian (2013) complement Avelino et al. (2011) by discussing the QL (the locational quotient), which was proposed originally by Bendavid-Val (1991, p. 75)9. The use of this index allows us to understand the relative importance of each city for each candidate's votes. Silva and Davidian (2013) also use the HC (Horizontal Cluster), which is derived from QL and adapted from Fingleton et al. (2005), to measure the difference between the quantity of votes received by a candidate in a municipality and the number of votes necessary for QL to be equal to 0110. The HC redistributes votes throughout the cities, showing how many votes each candidate obtained in relation to what would have been observed if the distribution of votes were homogeneous in accordance with the population throughout the district. The HC, therefore, does not have either upper or lower limits, with the sign indicating either an excess or a lack of votes, and its mean value among municipalities, by definition, being equal to 0.
Given the theory and these indices, one can analyze the data with the following approach: in a large district, candidates will have different local references, in general, with some coming from the same cities. As a result, imagine, for example, that three politicians, who already held some elected office in the municipal administration of the same city, ran for Federal Deputy. What possible strategies would one be able to see? Figure 01 represents some possibilities.
The first case shows perfect coordination: it divides the territory into contiguous areas, without overlap, so that each candidate would restrict the potential
_____________________________________________________________________________________________________ 8 IBGE orders cities on 05 levels that are then subdivided. These orderings are established on the
basis of self-sufficiency in the supply of goods, services, and public equipment for their inhabitants. Brazilian municipalities are divided into 11 categories, with lower numbers signifying more importance for the cities that are below them hierarchically.
9 QL is adapted for use in this paper as follows: 𝑄𝐿
𝑖𝑐 =𝑉𝑉𝑖𝑐𝑐⁄⁄𝑉𝑉𝑖, with 𝑉𝑖𝑐 being the total of votes for candidate i in city c, 𝑉𝑐 = ∑ 𝑉𝑖 𝑖𝑐, 𝑉𝑖= ∑ 𝑉𝑐 𝑖𝑐e 𝑉 = ∑ ∑ 𝑉𝑖 𝑐 𝑖𝑐.
10 HC would be equal to 𝑉
𝑖𝑐− 𝑉𝑖𝑐∗. When QL equals 01, one would obtain 𝑉𝑖𝑐∗ =𝑉𝑖𝑉𝑉𝑐, which could be rewritten as 𝐻𝐶𝑖𝑐 =𝑉𝑖𝑉𝑐
effect of the others. This extreme case is not expected, as much because of the difficulty of establishing sufficient coordination as for the fact that politicians' localities of reference are personal attributes that are important for the vote (SHUGART et al., 2005). Given that the locality is the same for all three candidates, the candidates should therefore have high numbers of votes in the same city. In the second case, the intersection of the three circles would be in this city of reference, but each candidate would seek to reach the electorate in different areas. Each one of them would make an effort to gather votes in different nearby regions. This would result in some overlap, but also some exclusive areas. In the third case, the city of reference would have little importance and there would be no type of coordination between the candidates. How, then, would the votes in fact be distributed?
Figure 01. Possible patterns of vote dispersion
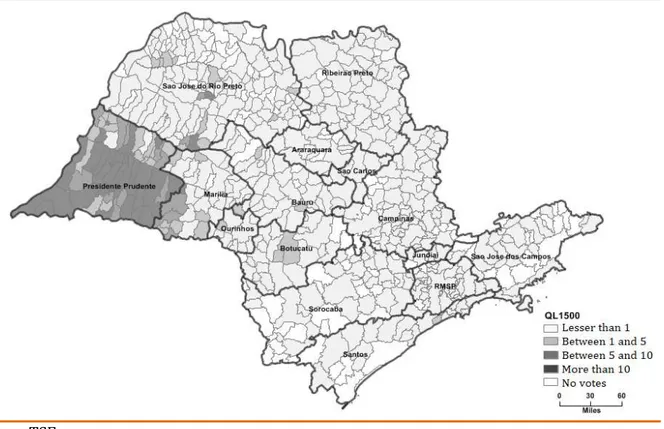
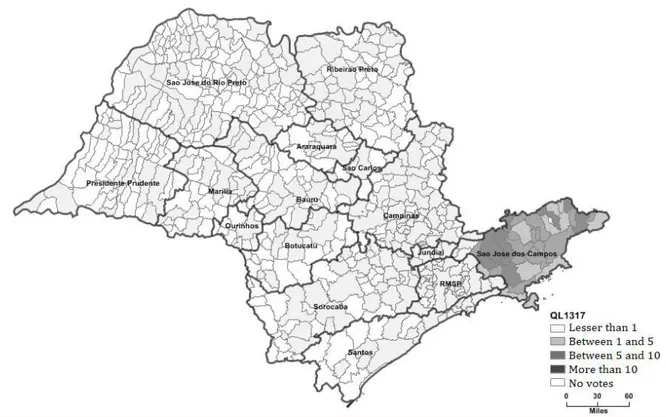
The maps of Figure 02 show the distribution of vote by QL and are divided into three groups. Figures 02.a and 02.b show the disperse pattern. Figures 02.c and 02.d indicate a random pattern: there are cities with relatively high QL, but they are not in the same region. Finally, the concentrated votes consist of the last six maps11: Figures 02.e and 02.f refer to candidates that were mayors in the Baixada Santista12; Figures 02.g and 02.h are for candidates with votes concentrated in the region of Presidente Prudente; and Figures 02.i and 02.j refer to candidates with areas of influence in the Paraíba Valley. For each pair within the concentrated votes, the politicians with the same city of reference showed similar vote dispersions13. Even though the candidates have trajectories that are dependent on given cities, their areas of electoral concentration
_____________________________________________________________________________________________________ 11 To obtain candidates' maps, please contact the authors.
12 A metropolitan area in the state of São Paulo centered on the city of Santos.
expand in the same geographical direction throughout the state. In other words, none of the three possibilities of Figure 01 occurred: the politicians were not able to coordinate amongst themselves and their votes were dispersed in exactly the same way. These maps suggest that there is a common dynamic that acts independently of the decisions made by politicians.
Figure 02. Vote dispersion patterns. Maps of electoral concentration measured by the
Locational Quotient for selected candidates for Federal Deputy - São Paulo State - 2002 and 2010
Figure 02.a. Disperse pattern I
Source: TSE.
Figure 02.b. Disperse pattern II
Figure 02.c. Random pattern I
Source: TSE.
Figure 02.d. Random pattern II
Figure 02.e. Concentrated pattern I
Source: TSE.
Figure 02.f. Concentrated pattern II
Figure 02.g. Concentrated pattern III
Source: TSE.
Figure 02.h. Concentrated pattern IV
Figure 02.i. Concentrated pattern V
Source: TSE.
Figure 02.j. Concentrated pattern VI
As a result, determining a politician's city of reference and region is a fundamental step for determining whether this argument makes sense. The literature usually uses surveys in which politicians certify the geographical location to which they 'belong' or represent (which neighborhood, city, or region they come from or represent) (cf. GÓRECKI and MARSH, 2012) or the candidate declares her 'city of reference' (JANKOWSKI, 2016). Here, we used candidates' local political history to determine their locality (candidates who ran for mayor or city council) and their place of affiliation. We looked at 4,267 candidates — those for whom it was possible to attribute a city of reference — out of a total of 5,320. The following section interweaves this information to test the relevance of these localities for determining the dispersion of votes.
Empirical analysis
The first result of interest is the distribution of candidates among regions in the state. Table 01 presents this information.
Table 01 shows that the candidates are concentrated in some regions of the state. The São Paulo metropolitan region has the majority of them: close to 59% of the candidates. Campinas has the second-largest mean proportion of candidates (11.7%), followed by São José dos Campos (5.4%), Sorocaba (4.5%), Santos (4.2%), São José do Rio Preto (3.8%), and Ribeirão Preto (3.5%). As for the origin of the candidates who were elected, the order of the regions and their proportions remains more or less the same: the São Paulo metropolitan region has an average of 60%, Campinas 11.3%, São José do Rio Preto 4.9%, Sorocaba 4.3%, São José dos Campos 4.2%, Santos 3.6%, and Ribeirão Preto 3.3%. These proportions do not reflect the distribution of the population. The São Paulo metropolitan region has 48% of the state's population, while the other cities listed here have, on average, more inhabitants than candidates or representatives (on average, the regions have the following proportions: Campinas — 12.8%, Sorocaba
— 5.7%, São José dos Campos — 5.6%, São José do Rio Preto — 5.6%, Ribeirão Preto — 5.6%, and Santos — 4.7%).
Table 01. Regional distribution among candidates, elected deputies and the population
1998 2002 2006 2010 2014
Region Cand. Elected Pop. Cand. Elected Pop. Cand. Elected Pop. Cand. Elected Pop. Cand. Elected Pop.
Araraquara 9 1 475,205 6 1 507,930 8 1 537,015 6 1 564,373 7 0 601,829
Bauru 16 2 905,417 15 1 968,988 19 1 1,049,894 16 0 1,067,978 17 0 1,136,219
Botucatu 6 1 411,893 6 1 449,595 5 1 479,668 12 1 501,080 9 1 534,794
Campinas 63 6 4,220,066 91 7 4,634,534 103 7 5,085,759 106 8 5,356,156 126 9 5,774,324
Jundiaí 7 1 575,724 7 1 667,528 11 0 728,640 8 1 788,202 15 1 854,623
Marília 12 0 632,573 10 0 675,602 13 3 706,708 16 1 714,680 14 1 729,784
Ourinhos 2 0 190,474 0 0 202,942 1 0 211,368 3 0 219,277 2 0 231,944
Presidente Prudente 11 1 776,783 8 1 807,163 9 1 831,240 6 0 851,258 10 0 915,305
Ribeirão Preto 19 2 1,904,970 20 1 2,050,741 32 3 2,191,432 39 2 2,320,385 38 3 2,487,053
São Paulo metropolitan area 302 41 16,496,140 359 40 17,769,576 552 39 19,084,436 608 41 19,533,584 721 36 20,765,991
Santos 30 1 1,553,840 23 2 1,747,135 40 2 1,878,790 34 3 1,937,702 49 4 2,065,208
São Carlos 2 0 300,050 3 1 328,506 2 1 353,312 3 0 371,408 8 0 397,998
São José do Rio Preto 24 4 1,961,453 29 2 2,071,875 27 2 2,190,422 30 4 2,281,178 46 4 2,426,203
São José dos Campos 36 2 1,853,761 34 2 2,065,084 41 4 2,233,498 48 3 2,351,676 67 3 2,525,073
Sorocaba 30 2 1,860,761 22 3 2,085,204 42 3 2,265,387 42 2 2,403,261 54 4 2,588,956
Total 569 64 633 63 905 68 977 67 1.183 66
Source: IBGE and TSE (Supreme Electoral Court in Brazil).
The correlation of the relationship between population and candidates elected within the region is around 99%, falling to 92% if the São Paulo metropolitan region is excluded from the comparison. In other words, the observation of these regions seems to attribute an effective regional logic. The mean of the relationship between population and candidates in each region reaches its maximum value for São Carlos, with almost 140,000 inhabitants/candidate, while the São Paulo metropolitan region has the smallest value, with 42,705 inhabitants/candidate. The overall mean among all the regions is 72,629 inhabitants/candidate, with a standard deviation of 31,788 inhabitants/candidate. The median is 65,844 inhabitants/candidate. There are, however, cases in which this relationship is considerably different, such as São Carlos in 1998 and 2006, Ourinhos in 2014, and Ribeirão Preto in 1998 and 2002, which had means above 100,000 voters/candidate. They are, however, exceptions. The standard deviation is relatively low, suggesting homogeneity in the relationship among the regions between elections.
With this in mind, we can now evaluate our results for the spatial concentration of votes. The first results, using the mean HC per candidate in each region, are below in Table 02.
Table 02. Mean HC by region in São Paulo for all candidates for Federal Deputy
(1998-2014)
Region Mean Standard distribution N
Araraquara 0.38 386.44 76,806
Bauru 0.45 316.17 166,413
Botucatu 0.4 176.22 110,942
Campinas 0.94 657.05 328,559
Jundiaí 1.11 942.21 29,869
Marília 0.35 217.26 153,612
Ourinhos -1.27 121.85 46,937
Presidente Prudente 0.54 198.62 243,219 São Paulo metropolitan area -9.73 2.396.40 153,612
Ribeirão Preto 0.85 451.47 264,554
Santos 1.01 784.85 102,408
São Carlos -4.8 597.22 29,869
São José do Rio Preto 0.19 226.36 627,249 São José dos Campos 1.97 806.82 183,481
Sorocaba 0.91 498.51 234,685
Total 0.002 696.81 2,752,215
The data show, as expected, that the means for the region are in general very close to zero. Even the São Paulo metropolitan region and São Carlos have mean values
that are statistically equal to zero for α = 05%. One should note that the overall mean is
zero and that, given the large variation in the observed data, the regions do not show important differences among them. Another important observation is related to the high values of standard deviations in each area. This high dispersion indicates that candidates have different results in terms of the spatial distribution of their votes
throughout the different regions. The Nrefers to the number of cities per candidate in
each one of the regions. Having analyzed 4,267 candidates, one can see that, in the region of Araraquara, for example, there are 18 cities; in Bauru, 39, and so on.
It is interesting to observe the behavior of the means among the regions for groups of deputies that have made their political careers in different regions. In this sense, deputies were separated by their city of reference and the HC means were calculated for each region. Two types were identified: politicians whose career takes place in the regional center city and those whose political trajectories are built in other cities in the same region. We expect that deputies will not have the exact same patterns of votes at the municipal level amongst themselves, but instead will have high correlations at the regional level. If the proposition that we make here is correct and the network between the regions is not established, the votes of a given candidate should not flow obligatorily to another, even if they are geographically contiguous. This should be valid for all candidates from every region, whether they have careers in the central city or not. A greater effort would be necessary to overcome this type of barrier and compete for votes throughout the entire state, which few candidates would be able to do.
Graph 01. Mean HCs for all candidates and elected deputies by region
Source: TSE.
Graph 01 shows that the means are higher in regions in which politicians made their careers15, both for all candidates and only those who were elected. A politician
from a given region will have a high HC value in that same region, whereas she will have a lower HC value in all other regions. Despite having the same pattern among all candidates, the values are more extreme for those who were elected. The most decisive case is in the São Paulo metropolitan region. The deputies based on this region had the smallest mean values among the other regions of the state. This suggests that the São Paulo metropolitan region alone guarantees enough votes for electoral success. Even so, this pattern is repeated in other regions. The candidates who were able to get elected won more meaningful numbers of votes in their region of origin than in other regions and won fewer votes in the other regions. In the regions of Campinas, Jundiaí, São Carlos, Santos, São José dos Campos, and Sorocaba, this situation was particularly evident.
Looking at the results for each region also shows us another important piece of information. The fact that the political careers of two normal individuals were built in different cities, but within the same region, suggests similar regional voting patterns. Put another way, taking two normal politicians from the same region, one could expect that their distribution of votes to be similar, even if their careers had been built in different cities. The votes for each individual should be located in regions under the influence of the same center city. As a result, we can focus on one particular region to evaluate the
_____________________________________________________________________________________________________
15 Associating regions with candidates was done in two ways: by the city in which the politician
ran for the offices of mayor or city council and by the place on the candidate's voting registration. These two variables were combined to make a third, more general, one, which is used from here on out: it defines the area of a candidate when both areas are the same or when only one of them is available. In cases of disagreement, we left it blank.
Region of Origin 1 2 3 4 5 6 7 8 9 10 11 12 13 14 15 1 2 3 4 5 6 7 8 9 10 11 12 13 14 15 1 Araraquara 2 Bauru 3 Botucatu 4 Campinas 5 Jundiaí 6 Marília 7 Ourinhos
8 Presidente Prudente Less than -1.000 9 Ribeirão Preto Between -1.000 and -100 10 Santos Between -100 and -10 11 São Carlos Between -10 and 0 12 São José do Rio Preto Between 0 and 10 13 São José dos Campos Between 10 and 100 14 São Paulo metropolitan area Between 100 and 1.000 15 Sorocaba More than 1.000
All candidates Elected deputies
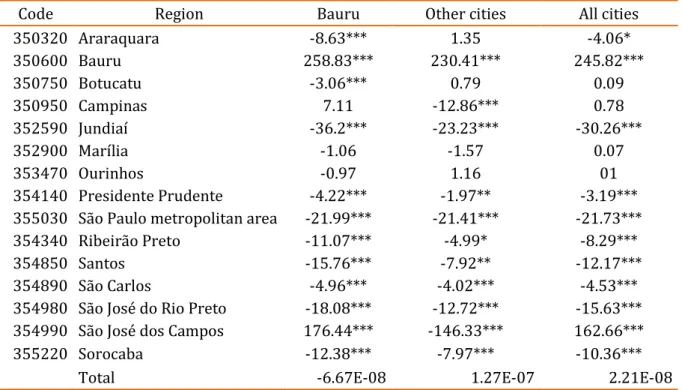
results shown in the previous graph. Table 03 below shows the data for one example: the region of Bauru.
Table 03. Mean HC for elected deputies in the region of Bauru
Code Region Bauru Other cities All cities 350320 Araraquara -8.63*** 1.35 -4.06* 350600 Bauru 258.83*** 230.41*** 245.82***
350750 Botucatu -3.06*** 0.79 0.09
350950 Campinas 7.11 -12.86*** 0.78
352590 Jundiaí -36.2*** -23.23*** -30.26***
352900 Marília -1.06 -1.57 0.07
353470 Ourinhos -0.97 1.16 01
354140 Presidente Prudente -4.22*** -1.97** -3.19*** 355030 São Paulo metropolitan area -21.99*** -21.41*** -21.73*** 354340 Ribeirão Preto -11.07*** -4.99* -8.29*** 354850 Santos -15.76*** -7.92** -12.17*** 354890 São Carlos -4.96*** -4.02*** -4.53*** 354980 São José do Rio Preto -18.08*** -12.72*** -15.63*** 354990 São José dos Campos 176.44*** -146.33*** 162.66*** 355220 Sorocaba -12.38*** -7.97*** -10.36***
Total -6.67E-08 1.27E-07 2.21E-08
Source: TSE.
Note: *** p-value˂0,1%; ** p-value˂1%; * p-value˂5%
The table presents three columns. In the first, we look at the means for candidates whose careers are associated with the city of Bauru. In the second, we show the candidates whose career is associated with a city in the same region, but not the center city. In the last column, we show the result for all candidates from the region. The main result is that the values observed in all the columns show exactly the same pattern: they are higher in their own region, which is the only one in which the means observed are positive and statistically different from 0. In addition, the correlation between the mean HCs in the two first columns is 0.996. This reinforces the argument that, regardless of the cities of origin of the candidates, the patterns of vote dispersion are similar.
city have positive means in Campinas, even though they are statistically equal to 0, whereas candidates from other cities have negative means in the region. The exact opposite happens in Araraquara. Even so, our interpretation remains that the inter-regional dispersion pattern is similar. To evaluate if this result can be observed for the group of regions simultaneously, we then estimated a model with control variables.
The model used the standardized difference in HC means between candidate 'i'
in region 'r'in year 'a'and the overall mean HC for all candidates in the same year in the
same region as the dependent variable. We call this variable 'Z', and it equals the
following expression:
𝑍𝑖𝑟𝑎 = 𝑋̅𝑆𝑖𝑟𝑎𝑖𝑟𝑎
√𝑛𝑖𝑟𝑎
− 𝑋̅𝑟𝑎
𝑆𝑟𝑎 √𝑛𝑟𝑎
(1)
in which 'Z'is the index observed for individual 'i' in region 'r' in year 'a', 𝑋̅ is
the mean HC for that same individual 'i' in region 'r'; 'S'is the standard deviation, and 'n'
is the number of observations. This procedure corrects the variance for each group by standardizing the data between the different regions, allowing for the comparison of different regions and years and facilitating the interpretation of the estimated parameters. The variable, as a result, looks like a normal standardized variable. Graph
02 presents the estimations for the probability density functions of 'Z' for elections
between 1998 and 2014.
Looking at the results for candidates who were not elected, one can see that the means for all years begin to decrease, starting with -2.30 in 1998 and reaching -2.61 in 2014. The standard deviation increases, from 1.88 in 1998 to 1.96 in 2014, which is reflected in the different behaviors of the curves for different elections. Among elected
candidates, the pattern is different. The means oscillate between elections — from -1.92
in 2002 and 2014 to -2.0 in 1998 and 2006. The standard deviation is higher and varies without a clear pattern: the smallest value is in 2002 (2.03) and the largest in 2010 (2.22). This pattern of distributions is different from that for the candidates as a whole, as it is smoother and does not change as much between elections. There is a peak for the Z-value just above -5, and another for positive values just above 0. The right-hand tail is thicker than for the candidates as a whole, suggesting that candidates who are elected win significantly more votes in some regions. However, one should note the existence of a mass of observations with negative Z-values, which suggests that in São Paulo as a
throughout the entire state. This finding is in agreement with those of Avelino et al. (2011). Even if the degree of vote concentration at the regional level is larger than that at the municipal level, it does not reach the state as a whole.
Graph 02. Estimation of probability density function for z-variable by year
Source: TSE.
The question then is if knowledge of the area of reference of a candidate alters
the value of 'Z'. The theoretical expectation is that it would because a candidate would
obtain more votes than other candidates in her regions of origin. To evaluate this
relationship, we calculated the relationship of 'Z' with the following explanatory
variables:
01. A dummy that indicates the region of reference for each candidate. This is the most relevant explanatory variable because we expect that, for the area of origin of a candidate, the difference between the votes obtained by her and the mean of the other candidates will be positive.
02. The 'G'index for the evaluation of the general level of dispersion of votes throughout the state. The more disperse votes are (which would imply lower values of 'G'), the lower the 'Z'value will be.
that the higher the number of votes is on average, while controlling for their dispersion, the greater the value of 'Z'will be.
04. Finally, the population of each region16. We expect that, in regions with
larger populations, the value of 'Z'will be greater because the candidate will be able to
reach a larger number of voters in a smaller geographical space without canvassing in other areas of the state.
The data refer to all the candidates whose candidacies were accepted by the TSE. Table 04 presents the estimated results.
The first regression shows our results for the model, considering only the main explanatory variable, which is the dummy for the candidate's region of origin. Its value is high, indicating that information about geographical area is an influential factor on the
number of votes received. For the second regression, we also included the 'G' index,
calculating it at the regional level17. The value of the estimated parameter for the 'G'
variable has a negative sign, as expected, and is significant for all the models we estimated. The estimate beta value was around -1.6, suggesting that the votes are concentrated in the regions we indicated. In the third regression, we included a dummy variable indicating if the candidate was elected. The value of the estimated parameter for this variable is positive, suggesting that candidates who are elected have, on average, larger differences in votes throughout the state. With the inclusion of the other control variables in the other models, the value of the estimated parameters does not change significantly.
It is important to note the interaction parameter between the regional and elected dummy variables that is introduced in the model. This interaction aims to evaluate the pattern of voting behavior for elected candidates within their home regions. The sign of the parameter that is estimated for this variable is always negative. This means that the deputies elected by São Paulo have a mean value of 'Z' in their home regions that is smaller than that of other candidates.
_____________________________________________________________________________________________________
16 To put together the population variable for electoral years, we made the following matches:
for the 1998 election, we used the population count of 1996; for the 2002 election, we used the 2000 census; for the 2006 election, we used the 2007 count; for the 2010 election, we used the 2010 census; and for the 2014 election, we used the population projections for that year.
17 We tested the G variables, calculated at both the municipal and regional levels, on the models.
Table 04. Parameters estimated for regression for the Z-variable Dependent
variable: Z Model 1 Model 2 Model 3 Model 4 Model 5 Model 6 Model 7 Model 8
Dummy_region 3.944 3.957 3.955 4.113 4.17 3.92 4.586 4.153
(0.015)*** (0.015)*** (0.015)*** (0.029)*** (0.029)*** (0.035)*** (0.037)*** (0.029)***
G -1.637 -1.593 -1.591 -1.591 -1.459 -2.06 -1.867
(0.023)*** (0.023)*** (0.023)*** (0.023)*** (0.030)*** (0.047)*** (0.027)***
Dummy_elected 0.334 0.249 0.295 0.363 0.295 0.256
(0.027)*** (0.031)*** (0.031)*** (0.053)*** (0.036)*** (0.031)***
Population(log) -0.135 -0.138 -0.088 -0.263 -0.136
(0.007)*** (0.007)*** (0.010)*** (0.010)*** (0.007)***
Votes_region 8.36E-03 1.42E-05 3.12E-05 9.53E-06 1.42E-05
(1.78e-06)*** (3.57e-6)*** (3.038e-06)*** (2.779e-06)*** (3.530e-06)***
Interaction
Region_Elected -1.647 -2.276 -1.445 -1.638
(0.271)*** (0.226)*** (0.245)*** (0.268)***
Dummy_Araraq
uara 0.466
(0.074)***
Dummy_Bauru 0.508
(0.047)*** Dummy_Botucat
u 0.415
(0.075)*** Dummy_Campin
as 0.408
(0.021)***
Dummy_Jundiaí 0.112
(0.057)*
Dummy_Marília 0.514
(0.059)*** Dummy_Ourinh
os 0.391
(0.158)* Dummy_Preside
nte Prudente 0.353
(0.061)*** Dummy_Ribeirã
o Preto 0.394
(0.035)***
Dummy_Santos 0.052
-0.032 Dummy_São
Carlos 0.404
(0.107)*** Dummy_São
José do Rio Preto 0.356 (0.032)*** Dummy_São José dos Campos 0.119 (0.028)*** Dummy_Soroca
ba 0.283
(0.032)***
Constant -2.698 -2.254 -2.29 -0.398 -0.369 -1.065 1.37 -0.433
(0.007)*** (0.010)*** (0.010)*** (0.101)*** (0.102)*** (0.144)*** (0.144)*** (0.101)***
R2 0.237 0.279 0.281 0.288 0.29 0.307 0.32 0.297
N 71,850 71,850 71,850 71,850 71,850 33,420 33,945 71,850
Source: TSE.
These observations suggest that elected candidates are capable of making their votes spill over to other regions outside their region of origin, somehow overcoming the regional constraints that affect everyone.
The three next models are similar, with one basic difference: in Models 06 and 07, we separate the candidates whose cities of reference are, respectively, non-center cities and center cities. In Model 05, we do not make this separation. The signs for the parameters do not change, but the parameters have different magnitudes for each group. Generally speaking, the values observed for the candidates that come from center cities have larger magnitudes than those who come from other cities, with the exception of the dummy elected variable and the interactive term. In the last model that we estimated, we included dummy variables for 14 regions of the state, excluding the São Paulo metropolitan region. Except for Santos, Jundiaí and Ourinhos, (for the latter two cities, the statistical significance is lower), the statistical significance for all municipalities is high and the sign of the parameter is positive. This result suggests that, in the São Paulo metropolitan region, the difference in votes for the candidates from that region is less than the mean obtained there in comparison with the other areas of the state.
Graph 03. Confidence intervals estimated for Z in regions of reference for center cities
and non-center cities
The results above could be subdivided into a comparison between the candidates who are based out of center cities and those based out of non-center cities in the same region. This comparison contributes to our understanding of these dynamics, not only between the regions, but also between the cities within the same region, and they help us understand the differences observed in the model above. Graph 03 shows the beta parameter estimated for a dummy region in the fourth regression model shown above.
The mean values are similar between the candidates with origins in the center cities (3.54) and those with origins in non-center cities (3.48). With the exception of Marília, Presidente Prudente, and São Carlos, the parameters estimated in all the other regions were above 03 for the center cities, which are values close to what was observed for the group of regions in the models presented above. Furthermore, the differences between the parameters for the center cities and the other cities from the same region are practically the same, with the exception of Jundiaí, Santos, and the São Paulo metropolitan region. This shows that the internal dynamics of the regions are equivalent, regardless of the city in which one's career is built, even though center cities give candidates higher means on the Z-variable. It is worth observing that the mean result in the São Paulo metropolitan region is considerably higher than those of other regions. In conjunction with the results presented in the last model of Table 04, one can conclude that individuals from that region win substantial numbers of votes there, while other candidates coming from other regions have difficulty winning votes in that region.
Another way to study the same phenomenon is to evaluate the mean results of candidates in regions that neighbor their city of reference. If the dynamic exists within the region, it would be expected that the votes would be concentrated in the regions of reference, with few votes leaving for neighboring areas, or with votes only leaving for immediate neighbors. As a result, we used the same model as before, but introduced a
dummy variable to indicate regions that neighbored the region of reference18. The
results for this variable are presented in Graph 04, maintaining the comparison between individuals based out of center cities and non-center cities.
_____________________________________________________________________________________________________
Graph 04. Confidence intervals estimated for Z for regions that neighbor regions of
reference for center cities and non-center cities
Source: TSE.
As the graph shows, the values of the parameters are, on average, below those observed previously. While the previous parameter had a mean close to 04, the case in question has a mean below 01. This implies that the difference in votes between a given candidate and the mean for other candidates in the region of reference is greater than the difference in neighboring regions. Furthermore, in this case, the differences between center cities and other cities are not particularly accentuated. With the exception of the São Paulo metropolitan region, the difference between the groups in other cases are within the confidence intervals. These results reinforce the argument that regional dynamics seem more important for the spatialization of the vote.
Discussion
CARVALHO, 2003; PEREIRA and MUELLER, 2003; SAMUELS, 2002; etc). According to the conventional wisdom, districtization was intentional.
The regionalization of the vote, however, does not seem to be sufficient empirical evidence to confirm this traditional approach. On the contrary, regionalization tends to take place as a strategy on the part of political parties to put together electoral lists. It can also be an effect of the informational dynamic across the territory —
information flows — that would facilitate credit claiming, for example, or even through
the different socializations to which voters are subject. In other words, the intentionality of politicians lies more in how they deal with the geographical influence on information flows than in creating informal districts. Personal relations seem to impose a layer with new dynamics that explain the observed dispersion of votes, starting with the transmission of biased information that makes its way to the electorate. Even though the relation that is established between politician and voters is clientelist, this is not sufficient to account for the spatialization of the vote.
In the approach that we propose, we understand that politicians need to deal with this division of the territory to have success, in accordance with the resources they have at hand. Some can project their influence throughout the entire district, like journalists; others are known only in their cities, and these make the regional dynamic more relevant. The regions examined here suggest that there is an external dimension to politics that interacts with formal electoral institutions and affects the behavior of politicians. Looking only at parliamentary behavior does not seem to be sufficient to explain electoral results. This argument makes it more difficult to use the electoral connection as a central (or the only) factor for analyzing the Brazilian case because it assumes that only a few institutional dimensions are enough to explain the case. Elections would be evaluated by their ability to explain congressmen's actions, and not through the set of incentives that explain the result per se.
districts. The number of news reports in which the relationship between candidates and
specific regions is vast19, which entails an argument employed to convince the voter that
a given region needs to elect its own representative.
Final considerations
The data indicate the existence of a regional pattern of votes in São Paulo that respects the existence of previous relationships between voters. The scattering of votes through the territory seems subject to a previously established dynamic that affects the result of the election. Context matters for explaining this dispersion.
These statements open up space for an investigation about the Brazilian electoral system that has been ignored up to now. The theoretical construction that underlies it has reached an extreme level of focus on the incentives emanating from some elements, while overlooking others. Understanding the incentives does not imply arguing that all individuals subject to them behave in the same way. One should observe that the application of the socioeconomic layer that we propose here might not be the only possible layer; it is simply the most basic layer (supposedly) that affects us all. Some have mechanisms to overcome it, such as the 'puxadores de voto', while others make use of other connections to reach the electorate. The tendency of information flows is the common component in these network mobilization strategies, and it deserves deeper investigation.
As a result, the introduction of this approach from political geography seems promising. In this first foray, one can note that the knowledge of the region of an individual's political history, in conjunction with the hierarchy of municipalities, supplies sufficient information for one to understand the dispersion of votes within a territory. A politician's performance within this region, for example, combined with mayors and state deputies, should provide clues about the electoral dynamics for
_____________________________________________________________________________________________________
19 Examples of politicians' preoccupation with the regional aspect of the state in the dispute for
Federal Deputy in São Paulo for the 2014 elections: http://www.jj.com.br/noticias-6715-bigardi-comenta-a-importancia-eleger-representantes-da-regiao-;
http://portalprudentino.com.br/noticia/noticias.php?id=38514&titulo=bragato-e-ed-sao-os-unicos-deputados-eleitos-de-pp; http://www.atribuna.com.br/elei%C3%A7%C3%B5es-
legislative offices in Brazil. Furthermore, the internal dynamics of the other electoral districts should lead to different results, because not only the contexts vary, but also the magnitudes of the electoral districts that affect the importance of regionalization. Apart from this aspect, one could consider putting together experiments in which one could evaluate the effect of a politician moving to a different region between elections on the dispersion of her vote, as well as the perception that voters would have of this politician. Other studies must go on, looking at the theoretical ramifications of this approach and considering that the voter wants to correctly choose her candidate given the alternatives presented to her (LAU and REDLAWSK, 2006), but faces high costs for obtaining precise information and processing it. By doing so, we will be able to make progress in understanding PR elections in Brazil.
Translated by Ryan Lloyd Submitted on July 21, 2017 Approved on January 15, 2018
References
AGNEW, John A. (1987), Place and politics: the geographical mediation of state and
society.London: Allen and Unwin. 266pp.
AGNEW, John A. (1996), Mapping politics: how context counts in electoral geography.
Political Geography. Vol. 15, Nº 02, pp. 129-146.
AMES, Barry (1995a), Electoral strategy under open-list proportional representation.
American Journal of Political Science. Vol. 39, Nº 02, pp. 406-433.
AMES, Barry (1995b), Electoral rules, constituency pressures, and pork barrel: bases of
voting in Brazilian Congress. The Journal of Politics. Vol. 57, Nº 02, pp. 324-343.
AMES, Barry (2003), Os entraves da democracia no Brasil. Rio de Janeiro: FGV. 409 pp..
ANDRÉ, Audrey; DEPAUW, Sam, and MARTIN, Shane (2016), The classification of
electoral systems: bringing legislators back in. Electoral Studies. Vol. 42, pp. 42-53.
AVELINO, George; BIDERMAN, Ciro, and SILVA, Glauco Peres da (2011), A concentração
eleitoral nas eleições paulistas: medidas e aplicações. Dados. Vol. 54, Nº 02, pp.
319-347.
BENDAVID-VAL, Avrom (1991), Economy composition analysis. In: Regional and local
economic analysis for practitioners. New York: Praeger. pp. 67-76.
BLAIS, André and LAGO, Ignacio (2009), A general measure of district competitiveness.
BRAGA, Maria do Socorro Souza (2008), Organizações partidárias e seleção de
candidatos no estado de São Paulo. Opinião Pública. Vol. 14, Nº 02, pp. 454–485.
BRAGA, Maria do Socorro Souza and AMARAL, Oswaldo E. do (2013), Candidate selection and party competition the case of Brazil. Revista de Sociologia e Política.
Vol. 21, Nº 46, pp. 33–43.
BRAGA, Maria do Socorro Souza; VEIGA, Luciana Fernandes, and MIRÍADE, Angel (2009), Recruitment and profile of candidates and the elected to the Chamber of Deputies in the elections of 2006. Revista Brasileira de Ciências Sociais. Vol. 24, Nº
70, pp. 123–142.
CAREY, John M. and SHUGART, Matthew Soberg (1995), Incentives to cultivate a
personal vote: a rank ordering of electoral formulas. Electoral Studies. Vol. 14, Nº 04,
pp. 417-439.
CARNEIRO, Andrea Rodrigues (2009), Processo de seleção de candidatos ao cargo de
Deputado Federal no Estado do Rio de Janeiro: organizando as “peças” do “
quebra-cabeça". Doctoral thesis. Instituto Universitário de Pesquisas do Rio de Janeiro.
IUPERJ.
CARVALHO, Nelson Rojas (2003), E no início eram as bases: geografia política do voto e
comportamento legislativo no Brasil. Rio de Janeiro: Ed. Revan. 224 pp..
CHEIBUB, José Antônio and SIN, Gisela (2015), Order in chaos: Intra-party coordination
in open list PR systems. Paper presented at 72nd Midwest Political Science
Association Annual Meeting. Chicago.
COX, Gary W. (1990), Centripetal and centrifugal incentives in electoral systems.
American Journal of Political Science. Vol. 34, Nº 04, pp. 903-935.
COX, Gary W. (1997), Making votes count: strategic coordination in the worlds electoral
systems. Cambridge: Cambridge University Press. 360 pp..
COX, Gary W. and SHUGART, Matthew Soberg (1996), Strategic voting under
proportional representation. Journal of Law, Economics, and Organization. Vol. 12,
Nº 02, pp. 299-324.
FINGLETON, Bernard; IGLIORI, Danilo Camargo, and MOORE, Barry C. (2005), Cluster dynamics: new evidence and projections for computing services in Great Britain.
Journal of Regional Science. Vol. 45, Nº 02, pp. 283–311.
GÓRECKI, Maciej A. and MARSH, Michael (2012). Not just 'friends and neighbours':
Canvassing, geographic proximity and voter choice. European Journal of Political
Research. Vol. 51, Nº 05, pp. 563–582.
GUARNIERI, Fernando (2011), A força dos partidos fracos. Dados. Vol. 54, Nº 01, pp.
IBGE (2007), Região de influência das cidades de 2007. Rio de Janeiro: Instituto Brasileiro
de Geografia e Estatística. 201 pp..
JANKOWSKI, Michael (2016), Voting for locals: voters' information processing strategies
in open-lists PR systems. Electoral Studies. Vol. 43, pp. 72-84.
JOHNSTON, Ron (2001), Electoral geography. In: International encyclopedia of the social
& behavioral sciences. Edited by SMELSER, N. J. and BALTES, P. B.. Oxford: Pergamon.
pp. 4374-4378.
KEY, Valdimer O. (1949), Southern politics in state and nation. New York: Alfred A. Knopf.
752 pp..
LAMOUNIER, Bolívar (1992), Estrutura institucional e governabilidade na década de
1990. In: O Brasil e as reformas políticas. Edited by VELLOSO, João Paulo dos Reis.
Rio de Janeiro: José Olympio, pp. 23-47.
LATNER, Michael and McGANN, Anthony (2005), Geographical representation under
proportional representation: the cases of Israel and the Netherlands. Electoral
Studies. Vol. 24, Nº 04, pp. 709-734.
LAU, Richard R. and REDLAWSK, David P. (2006), How voters decide. Information
processing in election campaigns. New York: Cambridge University Press. 366 pp..
LOIS, María (2015), Construir Galicia(s): lugar, elecciones y política nacionalista. Madrid:
Trama Editorial. 291 pp..
MAINWARING, Scott (1991), Politicians, parties, and electoral systems: Brazil in
comparative perspective. Comparative Politics. Vol. 24, Nº 01, pp. 21-43.
MARSH, Michael (1987), Electoral evaluations of candidates in Irish general elections 1948-82. Irish Political Studies. Vol. 02, Nº 01, pp. 65-76.
MAYHEW, David R. (1974), Congress: the electoral connection. New Haven: Yale
University Press. 216 pp..
MELO, Carlos Ranulfo (2005), As instituições políticas brasileiras funcionam? Revista de
Sociologia e Política. Vol. 25, pp. 199-203.
NICOLAU, Jairo (2006), O sistema de lista aberta no Brasil. Dados. Vol. 49, Nº 04, pp.
689-720.
PAIVA, Denise and TAROUCO, Gabriela (2011), Voto e identificação partidária: os
partidos brasileiros e a preferência dos eleitores. Opinião Pública. Vol. 17, Nº 02, pp.
426-451.
American Geographers. Vol. 90, Nº 01, pp. 41-66.
PEREIRA, Carlos and MUELLER, Bernardo (2003), Weak parties in the electoral arena,
strong parties in the legislative arena: the electoral connection in Brazil. Dados. Vol.
46, Nº 04, pp. 735–771.
RIBEIRO, Andrezza de Oliveira (2013), Papel dos partidos na composição das listas para o legislativo nacional: o caso do Estado do Rio de Janeiro. Masters dissertations.
Universidade Estadual do Estado do Rio de Janeiro. UERJ.
RODDEN, Jonathan (2010), The geographic distribution of political preferences. The
Annual Review of Political Science.Vol. 13, pp. 321-340.
SAMUELS, David J. (2002), Pork barreling is not credit claiming or advertising: campaign
finance and the sources of personal vote in Brazil. The Journal of Politics. Vol. 64, Nº
03, pp. 845-863.
SAMUELS, David J. (1997), Determinantes do voto partidário em sistemas eleitorais
centrados no candidato: Evidências sobre o Brasil. Dados. Vol. 40, Nº 03, pp. 04-12.
SHUGART, Matthew, VALDINI, Melody and SUOMINEN, Kati (2005), Looking for Locals: Voter Information Demands and Personal Vote-Earning Attributes of Legislators
under Proportional Representation. American Journal of Political Science. Vol. 49, Nº
02, pp. 437–449.
SILVA, Glauco Peres and DAVIDIAN, Andreza (2013), Identification of areas of vote
concentration: evidences from Brazil. Brazilian Political Science Review. Vol. 07, Nº
02, pp. 141-156.
TERRON, Sonia L. (2009), A composição de territórios eleitorais no Brasil: uma análise
das votações de Lula (1989-2006). Doctoral thesis. Instituto Universitário de
Pesquisas do Rio de Janeiro. IUPERJ.
TERRON, Sonia L. (2012), Geografia eleitoral em foco. Em Debate. Vol. 04, Nº 02, pp.