Unisexual Reproduction Drives Meiotic Recombination
and Phenotypic and Karyotypic Plasticity in
Cryptococcus neoformans
Sheng Sun1, R. Blake Billmyre1, Piotr A. Mieczkowski2, Joseph Heitman1*
1Department of Molecular Genetics and Microbiology, Duke University Medical Center, Durham, North Carolina, United States of America,2Department of Biology, High-Throughput Sequencing Facility, University of North Carolina at Chapel Hill, Chapel Hill, North Carolina, United States of America
Abstract
In fungi, unisexual reproduction, where sexual development is initiated without the presence of two compatible mating type alleles, has been observed in several species that can also undergo traditional bisexual reproduction, including the important human fungal pathogensCryptococcus neoformansandCandida albicans. While unisexual reproduction has been well characterized qualitatively, detailed quantifications are still lacking for aspects of this process, such as the frequency of recombination during unisexual reproduction, and how this compares with bisexual reproduction. Here, we analyzed meiotic recombination during a-a unisexual and a-a bisexual reproduction of C. neoformans. We found that meiotic
recombination operates in a similar fashion during both modes of sexual reproduction. Specifically, we observed that ina-a
unisexual reproduction, the numbers of crossovers along the chromosomes during meiosis, recombination frequencies at specific chromosomal regions, as well as meiotic recombination hot and cold spots, are all similar to those observed during a-abisexual reproduction. The similarity in meiosis is also reflected by the fact that phenotypic segregation among progeny
collected from the two modes of sexual reproduction is also similar, with transgressive segregation being observed in both. Additionally, we found diploid meiotic progeny were also produced at similar frequencies in the two modes of sexual reproduction, and transient chromosomal loss and duplication likely occurs frequently and results in aneuploidy and loss of heterozygosity that can span entire chromosomes. Furthermore, in botha-aunisexual anda-abisexual reproduction, we
observed biased allele inheritance in regions on chromosome 4, suggesting the presence of fragile chromosomal regions that might be vulnerable to mitotic recombination. Interestingly, we also observed a crossover event that occurred within theMATlocus duringa-aunisexual reproduction. Our results provide definitive evidence thata-aunisexual reproduction is
a meiotic process similar toa-abisexual reproduction.
Citation:Sun S, Billmyre RB, Mieczkowski PA, Heitman J (2014) Unisexual Reproduction Drives Meiotic Recombination and Phenotypic and Karyotypic Plasticity in
Cryptococcus neoformans. PLoS Genet 10(12): e1004849. doi:10.1371/journal.pgen.1004849
Editor:Geraldine Butler, University College Dublin, Ireland
ReceivedAugust 8, 2014;AcceptedOctober 24, 2014;PublishedDecember 11, 2014
Copyright:ß2014 Sun et al. This is an open-access article distributed under the terms of the Creative Commons Attribution License, which permits unrestricted use, distribution, and reproduction in any medium, provided the original author and source are credited.
Data Availability:The authors confirm that all data underlying the findings are fully available without restriction. All relevant data are within the paper and its Supporting Information files except for the genome sequencing reads, which are available from the Sequence Read Archive (SRA) under project accession number: SRP042617.
Funding:This work was supported by R37 MERIT award AI39115-17 and R01 grant AI50113-10 from the National Institute of Allergy and Infectious Diseases (NIAID) and the National Institutes of Health (NIH) to JH. The funders had no role in study design, data collection and analysis, decision to publish, or preparation of the manuscript.
Competing Interests:The authors have declared that no competing interests exist. * Email: heitm001@duke.edu
Introduction
Cryptococcus neoformansis a globally distributed basidiomyce-tous human fungal pathogen that causes life threatening menin-goencephalitis [1]. C. neoformanspredominantly infects individ-uals with compromised immunity, such as HIV/AIDS patients, and now causes more than one million cases of cryptococcosis and .620,000 attributable mortalities globally, and accounts for approximately one-third of all AIDS-associated deaths each year [2].
C. neoformans typically reproduces asexually in the environ-ment as a haploid, budding yeast. When suitable conditions arise, it can also undergo sexual reproduction [3,4,5,6,7]. There are two mating types inC. neoformans,aanda, which are defined by the
presence of two alternate alleles of the mating type locus (MATa andMATa) [8]. In response to a variety of environmental cues,a
and a cells undergo a well characterized bisexual reproduction
cycle in which cells of opposite mating type first undergo cell-cell fusion that is evoked by pheromone secretion and sensing. The resulting dikaryon transitions into hyphal growth and eventually the hyphal tips form basidia fruiting bodies in which nuclear fusion and one round of meiosis occur [9]. After meiosis, multiple rounds of mitosis and budding produce on the surface of each basidium four long chains of infectious spores, which can be readily aerosolized and cause infections in mice and possibly also humans [10].
Although the natural population of C. neoformans is clonal overall, signatures of recombination have been detected, suggest-ing matsuggest-ing indeed occurs in nature, albeit at a low frequency or involving inbreeding [1]. In laboratory crosses, it has been found that duringC. neoformanssexual reproduction, meiotic recombi-nation is not completely random, and recombirecombi-nation hot spots and
cold spots have been identified [11,12,13]. TheMATlocus ofC. neoformansis unusually large (.100 kb) and the two mating type alleles,MATaandMATa, have similar gene contents. However,
extensive chromosomal rearrangements have accumulated be-tween the MATaand MATa alleles, and consequently, meiotic
recombination is generally highly repressed within theMATlocus during sexual reproduction, presumably due to sequence diver-gence and chromosomal rearrangements that would lead to dicentric/acentric chromosomes if crossing over were to occur. Interestingly, while recombination is suppressed within theMAT locus, two GC-rich recombination hot spots have been identified that flank the MAT locus [11]. Additionally, a minor GC-rich intergenic region located within the MAT locus stimulates recombination via gene conversion rather than crossing over [12]. TheC. neoformansnatural population has an extremely biased mating type distribution, andamating type accounts for.99% of
the natural isolates analyzed [14]. This is very striking, and also posed a conundrum: How frequently does sexual reproduction betweenaand a cells occur in nature, given a population with
such an unbalanced mating type ratio? Additionally, how important is sexual reproduction in the evolution of C. neofor-mans, if it is not occurring at a high enough frequency, especially considering that sex also comes with intrinsic costs compared to asexual reproduction [15]?
Answers to these questions were provided by a previous study which found that C. neoformans can undergo not only a-a
bisexual reproduction, but also a-a unisexual reproduction
involving cells of only one mating type [16]. The developmental aspects ofa-aunisexual reproduction mirror those ofa-abisexual
reproduction. Although a detailed description of recombination frequencies duringa-aunisexual reproduction is as yet lacking, it
has been shown that genes essential for meiosis and sporulation are also required for successfula-aunisexual reproduction, providing
evidence that unisexual reproduction in C. neoformans involves meiosis [16,17]. Additionally, natural aAAa and aADa C.
neoformansisolates that are diploid and have twoMATa alleles
have been isolated from the environment and clinic, providing further evidence thata-aunisexual reproduction occurs in natural
populations [18,19]. Furthermore,a-aunisexual reproduction has
also been suggested to occur in nature based on several population genetics studies ofC. neoformans[20,21,22,23]. Moreover, natural
aADa isolates show hybrid vigor and exhibit greater fitness
compared to haploid serotype A and serotype D strains [18]. Together, these studies support the model that a-a unisexual
reproduction is ongoing in naturalC. neoformanspopulations, and could be beneficial and evolutionarily advantageous.
Interestingly, unisexual reproduction has been recently discov-ered to occur in C. albicans, another common human fungal pathogen [24].C. albicansis known to undergo a parasexual cycle involving fusion between cells of opposite mating types,aand a,
followed by stochastic, concerted loss of chromosomes that eventually restores the diploid state [25]. The study by Alby et al. [24] found that when Bar1, a pheromone-degrading protease, is inactivated, a homothallic parasexual cycle can also be initiated inC. albicansviaa-acell fusion.
The discovery of an expanded ability to undergo both unisexual and bisexual reproduction in two leading fungal pathogens indicates that the benefits of sex may outweigh the costs in these species. This is also supported by recent studies in which it has been shown that inC. neoformans, sexual reproduction, including both unisexual and bisexual, frequently generates aneuploid progeny that have altered fitness under a variety of conditions [26].
Althougha-aunisexual reproduction inC. neoformanshas been
well characterized qualitatively, several fundamental aspects of this unique process are yet to be described quantitatively. The objective of our study was to conduct a detailed comparison between a-a unisexual and a-a bisexual reproduction. Specific
questions we addressed are: Does meiotic recombination indeed occur during a-a unisexual reproduction? If so, what are the
recombination frequencies duringa-aunisexual reproduction, and
how does this compare toa-a bisexual reproduction? Also, how
does the recombination frequency profile in a-a unisexual
reproduction compare to that observed ina-abisexual
reproduc-tion? Do recombination hot spots also operate during a-a
unisexual reproduction? Additionally, does recombination, espe-cially crossing over, occur within the MAT locus during a-a
unisexual reproduction, given that now the physical restraints imposed by chromosomal divergence/rearrangements duringa-a
bisexual reproduction are relaxed? Furthermore, are the products of a-a unisexual reproduction strictly haploid F1 meiotic
recombinants, or are aneuploids and diploids also produced as products and not only intermediates in the pathway? Answers to these questions will provide a better understanding of the evolution of the MAT locus and sexual reproduction, as well as the importance of sexual reproduction in shaping population dynam-ics and evolutionary trajectories of not onlyC. neoformans, but also other fungal species and beyond.
Results
Mating products were recovered from botha-aunisexual and a-abisexual reproduction
One of the main objectives of our study was to investigate the frequency of recombination duringa-aunisexual reproduction in C. neoformans, and how this compares toa-abisexual
reproduc-tion. To achieve this, we first set up and recovered mating products from both unisexual and bisexual reproduction. Author Summary
Unisexual reproduction has been reported in several fungal species that have been traditionally thought to undergo bisexual reproduction, including major human fungal pathogens such as Cryptococcus neoformans and Candida albicans. While it has been well characterized qualitatively, quantitative description of unisexual repro-duction, and detailed comparisons between unisexual and bisexual reproduction, are lacking. Here, by analyzing meiotic progeny generated from botha-aunisexual anda -abisexual reproduction inC. neoformans, we find that the
progeny collected from the two modes of sexual repro-duction show similar phenotypic segregation, with trans-gressive segregation of several phenotypes being ob-served in both. Additionally, the two modes of sexual reproduction are similar in all the aspects of meiotic recombination that we have examined, providing defini-tive evidence thata-aunisexual reproduction is a meiotic
process that operates similarly as in a-a bisexual
repro-duction. The ability to undergo both unisexual and bisexual reproduction may provide evolutionary advan-tages in environments where suitable mating partners are scarce, or where sexual reproduction is favored over asexual reproduction by mixing genetic materials and producing spores that are more tolerant of harsh environments. We discuss the implications of these findings in the context of the evolution of pathogenesis, mating types, and mating systems.
Unisexual Reproduction inCryptococcus neoformans
To study meiotic recombination during a-a unisexual
repro-duction, we crossed twoMATastrains, 431a(URA5 NATS) and
XL280aSS (ura5 NATR), and then screened for recombinant
mating products that areURA5andNATR. We isolated mating products from a-a unisexual reproduction by screening for
recombinant progeny using phenotypic markers instead of by spore dissection for the following reasons. First, as opposed toa-a
bisexual reproduction, a-a meiotic recombination has not been
quantified previously. Thus, we wanted to obtain a large progeny population that had undergone as much recombination as possible, which would make our estimation of recombination frequency as robust as possible. This was achieved efficiently by screening for recombinants using phenotypic markers. Second, it has been shown that the strain XL280acan undergo selfing and
produce spores, albeit at lower frequency compared to typicala-a
bisexual reproduction. Thus, by screening for recombinants using phenotypic markers we could avoid including progeny originating from XL280a selfing, which would otherwise distort the
estima-tion of recombinaestima-tion frequency ofa-a unisexual reproduction.
Additionally, and importantly, the markers that we used,URA5 and NAT, are located on different chromosomes, and neither is located on chromosome 4. As such, this screening process would not affect our analysis of meiotic recombination frequency during
a-a unisexual reproduction. In total, from a-a unisexual
reproduction we recovered a total of 156 progeny that were URA5NATR, representing mating products of the two parental strains.
For comparison, using the same strain 431aas one of the two
parents, we also conducted an a-a bisexual reproduction by
crossing it with strain XL280a, which is congenic with the XL280a parental strain used for unisexual reproduction [27],
except for theMATlocus and the loci where theura5and NATR markers are located. This is also supported by CHEF gel electrophoresis in which no apparent karyotypic variation has been observed between strains XL280a and XL280aSS (S4
Figure). Thus, by crossing the same natural isolate with two isogenicaandastrains, we could eliminate possible complications
due to karyotypic and sequence differences between parental strains used in the two types of crosses, and conduct a more consistent evaluation and comparison of recombination frequen-cies between the two modes of sexual reproduction. Compared to
a-aunisexual reproduction, basidia and basidiospore chains were
produced more abundantly duringa-abisexual reproduction. In
this case, meiotic products froma-abisexual reproduction were
collected by dissecting basidiospores from an individual basidium. Spores from twenty-nine basidia were dissected froma-abisexual
reproduction, with varying spore germination rates among basidia that ranged between 0% (basidia 8 and 23) and 100% (basidium 2) (Table 1). In total, 261 basidiospores were recovered from 27 basidia fora-abisexual reproduction.
Phenotypic variation is observed in progeny from botha -aunisexual and a-abisexual reproduction
We first investigated phenotypic variation among the progeny generated through a-a unisexual anda-abisexual reproduction.
The phenotypes that we assessed were temperature tolerance on YPD solid medium at different temperatures, melanin production on L-DOPA solid medium, and hyphal production on MS solid medium.
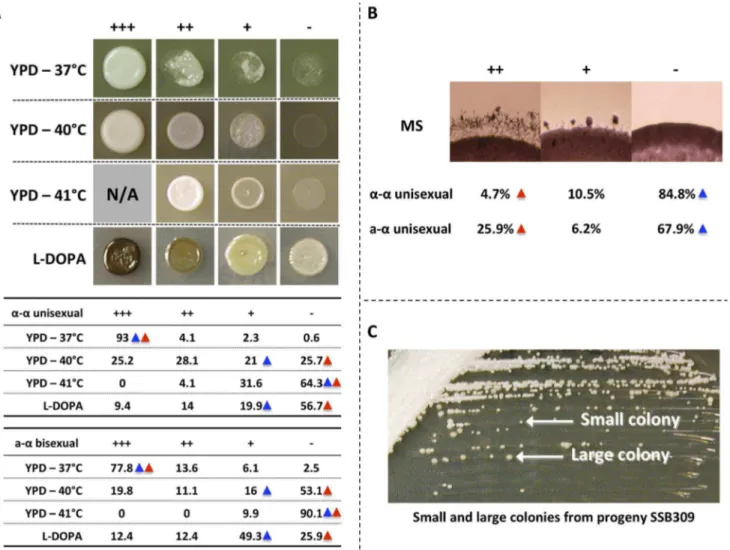
For temperature tolerance, we tested the growth of the progeny on YPD medium at three temperatures: 37uC, 40uC, and 41uC (S1 Table and S2 Table). At each temperature we found progeny from botha-a unisexual anda-abisexual reproduction that exhibited
transgressive phenotypes compared to the two parental strains.
Specifically, at 37uC none of the parental strains showed a growth defect. However, we found 7% and 22.2% of the progeny froma -aunisexual anda-abisexual reproduction, respectively, exhibited
growth defect, and thus are sensitive to high temperature (Fig. 1A). At 40uC and 41uC, the three parental strains showed little or no growth. However, there were 53.3% and 35.7% of the progeny froma-aunisexual reproduction that showed enhanced fitness at
40uC and 41uC, respectively. Similarly, from a-a unisexual
reproduction, there were also 30.9% and 9.9% of the progeny that showed enhanced fitness at 40uC and 41uC, respectively (Fig. 1A).
For melanin production on L-DOPA medium, we also found progeny that exhibit transgressive phenotype compared to the parental strains (S1 Table and S2 Table). Specifically, we found that 23.4% progeny froma-aunisexual reproduction, and 24.8%
progeny froma-abisexual reproduction, showed elevated melanin
production compared to their parental strains, respectively (Fig. 1A).
For hyphal production on MS medium, we did not observe transgressive segregation among progeny from eithera-a
unisex-ual ora-abisexual reproduction (S1 Table and S2 Table). Instead,
we found that 10.5% and 6.2% of the progeny showed intermediate hyphal production compared to their parental strains ina-aunisexual ora-abisexual reproduction, respectively.
Meiotic recombination occurs duringa-aunisexual reproduction
To study meiotic recombination duringa-aunisexual anda-a
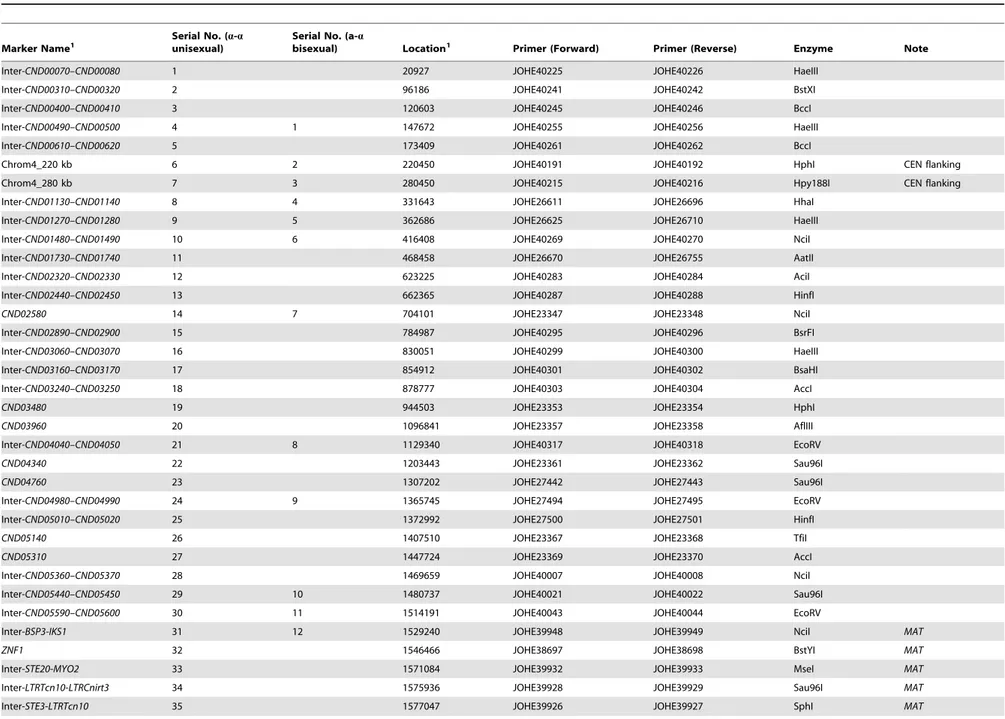
bisexual reproduction, we focused on chromosome 4 where the MAT locus is located. We developed 44 co-dominant genetic markers that are located along chromosome 4, including eight markers that are located within theMAT locus, as well as two markers that flank the centromere of chromosome 4 (Table 2; Fig. 2).
We applied 42 of the 44 genetic markers to genotype the 156 mating products collected froma-aunisexual reproduction. Based
on these 42 markers, we identified a total of 74 different genotypes among the 156 mating products recovered from a-a unisexual
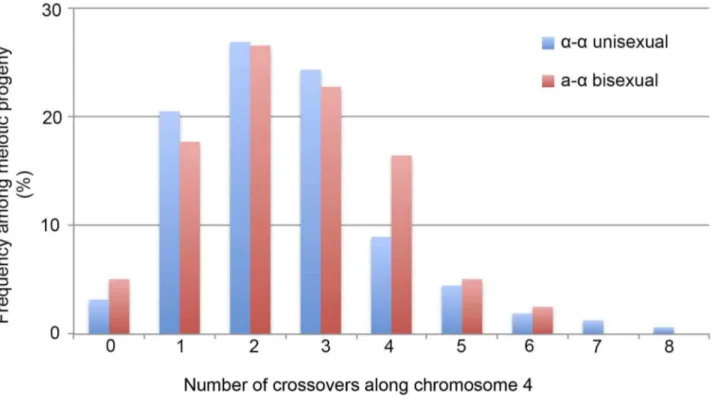
reproduction. Eleven of the 74 genotypes that were represented by 12 progeny had loci that were heterozygous, suggesting the chromosome 4 in these progeny might be disomic (see below). The number of progeny representing each genotype ranged from 1 to 17, with the majority of the genotypes (66, 89%) being represented by 1 to 3 progeny each. There were two genotypes, No. 52 and No. 60, which were represented by 13 and 17 progeny, respectively (S3 Table). The numbers of detected crossovers along chromosome 4 also varied among the progeny. Of the 144 progeny that were not heterozygous at any of the 42 markers, the majority (126, 87.5%) had 1 to 4 crossovers along chromosome 4 (S4 Table; Fig. 3). The maximum number of crossovers along chromosome 4 was 8, which occurred in one progeny, SSB385 (genotype 23; S3 Table).
To genotype the basidiospores dissected from an individual basidium generated bya-a bisexual reproduction, we applied 18
of these 44 genetic markers that corresponded to 17 loci (SXI1Da
andSXI2Datarget the same genomic position) (Table 2). In total, we identified 79 genotypes among the 261 basidiospores germi-nated from 27 basidia (S4 Table). Of the 27 basidia, 26 had spores corresponding to 1 to 4 genotypes, consistent with a single meiotic event in each. For the remaining anomalous basidium (No. 5), we identified 8 different genotypes among the 24 germinated spores (S4 Table). Two genotypes, corresponding to four progeny from 2 (or 3) different basidia, contain one or more loci that were heterozygous, indicating chromosome 4 was likely disomic in these
Unisexual Reproduction inCryptococcus neoformans
progeny. Among the 79 genotypes that did not contain heterozygous loci, 66 (83.5%) had 1 to 4 crossovers along chromosome 4 (S5 Table). The maximum number of crossovers detected along chromosome 4 was 6, which was observed in two genotypes from basidium 4 (progeny SSB886; S4 Table) and basidium 26 (progeny SSC271; S4 Table), respectively. Interest-ingly, among all 29 of the basidia dissected from a-a bisexual
reproduction, other than basidia 8 and 23, from which no spores germinated, basidia 4 and 26 had the lowest spore germination rates at 15% and 12%, respectively (Table 1).
We found that in 5 progeny froma-aunisexual reproduction
and 4 progeny from a-a bisexual reproduction there was no
evidence of recombination along chromosome 4. However, it is still possible that recombination did occur along chromosome 4 in these progeny, but in regions not covered by the genetic markers analyzed, such as subtelomeric regions.
Taken together, our results show clear evidence that recombi-nation occurs along chromosome 4 during a-a unisexual
reproduction. Compared toa-abisexual reproduction, crossovers
happen at a similar frequency along chromosome 4 (Kolmogorov-Smirnov Test, P.0.05), with the majority of the meiotic products having anywhere between 1 and 4 crossovers.
Recombination frequencies duringa-aunisexual and a-a bisexual reproductions are comparable
For a-a unisexual reproduction, we constructed a genetic
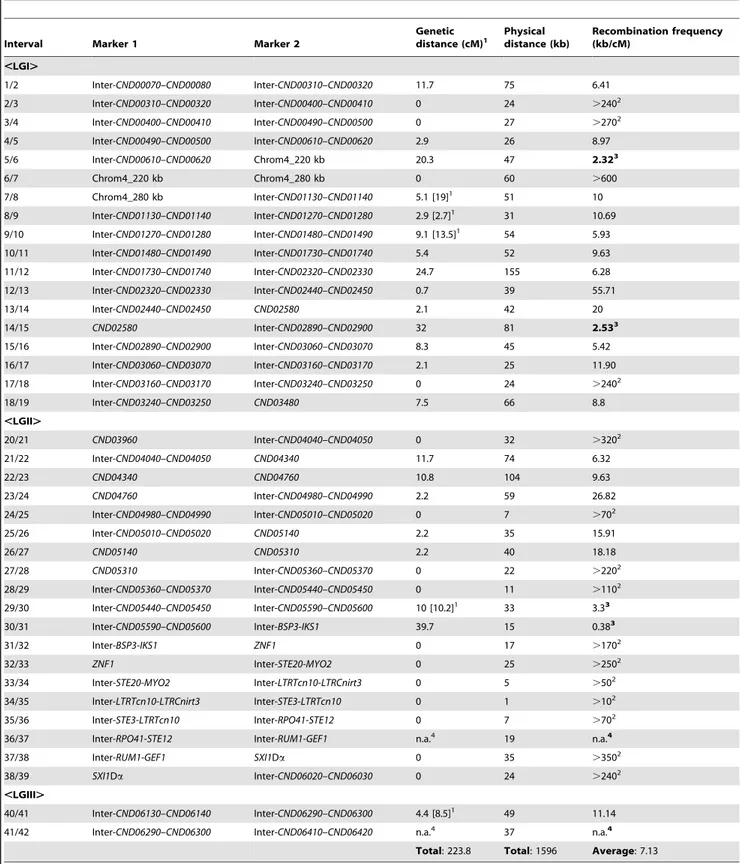
linkage map of the 42 markers based on the genotyping results for the 144 mating products that were monomorphic at all of the 42 genetic markers analyzed. The 42 markers formed three linkage groups (LGI–LGIII) that were 134.9 cM, 78.7 cM, and 10.2 cM in size, and spanned 19, 20, and 3 markers, respectively (Fig. 4). The orders of markers within the linkage groups are in overall agreement with their physical positions on chromosome 4, with the exceptions of three markers (No. 37–No. 39) in LGII and one marker (No. 40) in LGIII (Fig. 4). The three linkage groups had a total length of 223.8 cM, and encompassed 1596 kb of chromo-some 4, which produced an average recombination frequency of 7.13 kb/cM (Table 3).
Among the 37 marker intervals that were not interrupted by linkage group breakage or translocation of markers within the linkage groups, genetic distances could be calculated for 22 of them. Of the 15 marker intervals where no genetic distance was detected, one encompasses the centromere of chromosome 4 (LGI, interval 6/7) and 6 are located within the MAT locus (LGII, intervals 31/32–37/38) (Table 3), consistent with previous studies Table 1.Summary of basidia dissected from opposite sex mating between strains 431aand XL280a.
Basidium No. No. of spores dissected No. of spores germinated Germination rate (%) Progeny1
1 17 7 41 SSB859–SSB865
2 9 9 100 SSB866–SSB874
3 21 11 52 SSB875–SSB885
4 20 3 15 SSB886–SSB888
5 39 24 62 SSB889–SSB912
6 33 28 85 SSB913–SSB940
7 32 17 53 SSB941–SSB957
8 22 0 0 n.a.3
9 14 5 36 SSB958–SSB962
10 & 112 44 12 27 SSB963–SSB974
12 12 10 83 SSB975–SSB984
13 & 142 17 16 94 SSB985–SSB1000
15 4 1 25 SSC001
16 26 24 92 SSC002–SSC025
17 11 4 36 SSC026–SSC029
18 9 2 22 SSC030–SSC031
19 20 13 65 SSC032–SSC044
20 13 6 46 SSC045–SSC050
21 14 13 93 SSC228–SSC240
22 10 2 20 SSC241–SSC242
23 12 0 0 n.a.3
24 & 252 39 28 72 SSC243–SSC270
26 17 2 12 SSC271–SSC272
27 20 5 25 SSC273–SSC277
28 14 12 86 SSC278–SSC289
29 28 7 25 SSC290–SSC296
1: The strain names correspond to those in S4 Table. 2: Mixture of basidiospores from two basidia. 3: No spore germinated.
doi:10.1371/journal.pgen.1004849.t001
Unisexual Reproduction inCryptococcus neoformans
suggesting centromeres and theMATlocus are typically recom-bination cold spots [13,28].
On the contrary, there were also marker intervals that exhibited significantly higher recombination frequencies when compared to other marker intervals, as well as the chromosomal average. Specifically, in linkage group I, two marker intervals, 5/6 and 14/ 15, had recombination frequencies of 2.32 and 2.53 kb/cM, equal to about 3.1 and 2.9 times the chromosomal average, respectively (Table 3). Interestingly, the interval 5/6 encompasses a region that flanks the centromere of chromosome 4, suggesting that an elevated recombination frequency might be present at the periphery of the centromere. In linkage group II, there were also two marker intervals, 29/30 and 30/31 that showed elevated recombination frequencies at 3.3 and 0.38 kb/cM, equivalent to about 2.1 and 18.9 times the chromosomal average, respectively. Additionally, the recombination frequency in marker interval 30/ 31 was identified as an outlier when compared with the recombination frequencies from other marker intervals (general-ized ESD test), suggesting a significantly higher recombination frequency in this region. Not surprisingly, intervals 29/30 and 30/
31 encompass a previously identified recombination hot spot that flanks theMATlocus [11].
There were two gaps between the three linkage groups. The gap between LGI and LGII is relatively large and about 152 kb in size. Thus, the lack of genetic markers within this relatively large chromosomal region could be the reason why linkage was not established between LGI and LGII. The gap between LGII and LGIII is relatively small and is only about 31 kb in size. However, this gap encompasses another recombination hot spot that has been previously identified that is flanking the MAT locus [11]. This suggests that the same recombination hot spot is likely also operating during a-a unisexual reproduction and the resulting
high recombination frequency prevented the establishment of linkage between LGII and LGIII.
For a-a bisexual reproduction, we also constructed a linkage
map of the 17 loci that were genotyped using the 77 unique genotypes (the two heterozygous genotypes were excluded) that we identified among progeny from the 27 basidia that were dissected. Fourteen of the 17 loci formed four linkage groups (LGI–LGIV; Fig. 4), while no linkage with any other marker was established for Fig. 1. Phenotypic analyses of progeny froma-aunisexual and a-abisexual reproduction.A) Top: Different phenotypic categories that
were observed among the meiotic progeny froma-aunisexual anda-abisexual reproduction. Bottom: Summary of percentage (%) of progeny that belonged to different phenotypic categories ina-aunisexual anda-abisexual reproduction. Blue triangles highlight the phenotypes of parental strain 431a; red triangles highlight the phenotypes of the parental strains XL280aSS and XL280a. B) Phenotypic segregation of hyphal growth among the meiotic progeny froma-aunisexual anda-abisexual reproduction. The numbers represent the percentage of progeny that belong to different phenotypic categories. Blue triangles highlight the phenotypes of parental strain 431a; red triangles highlight the phenotypes of the parental strains XL280aSS and XL280a. C) The small and large colonies of the meiotic progeny SSB309 when grown on YPD solid medium at 30uC.
doi:10.1371/journal.pgen.1004849.g001
Unisexual Reproduction inCryptococcus neoformans
Table 2.Genetic markers employed for genotyping progeny froma-aunisexual and a-abisexual reproduction.
Marker Name1 Serial No. (
a-a
unisexual)
Serial No. (a-a
bisexual) Location1 Primer (Forward) Primer (Reverse) Enzyme Note
Inter-CND00070–CND00080 1 20927 JOHE40225 JOHE40226 HaeIII
Inter-CND00310–CND00320 2 96186 JOHE40241 JOHE40242 BstXI
Inter-CND00400–CND00410 3 120603 JOHE40245 JOHE40246 BccI
Inter-CND00490–CND00500 4 1 147672 JOHE40255 JOHE40256 HaeIII
Inter-CND00610–CND00620 5 173409 JOHE40261 JOHE40262 BccI
Chrom4_220 kb 6 2 220450 JOHE40191 JOHE40192 HphI CEN flanking
Chrom4_280 kb 7 3 280450 JOHE40215 JOHE40216 Hpy188I CEN flanking
Inter-CND01130–CND01140 8 4 331643 JOHE26611 JOHE26696 HhaI
Inter-CND01270–CND01280 9 5 362686 JOHE26625 JOHE26710 HaeIII
Inter-CND01480–CND01490 10 6 416408 JOHE40269 JOHE40270 NciI
Inter-CND01730–CND01740 11 468458 JOHE26670 JOHE26755 AatII
Inter-CND02320–CND02330 12 623225 JOHE40283 JOHE40284 AciI
Inter-CND02440–CND02450 13 662365 JOHE40287 JOHE40288 HinfI
CND02580 14 7 704101 JOHE23347 JOHE23348 NciI
Inter-CND02890–CND02900 15 784987 JOHE40295 JOHE40296 BsrFI
Inter-CND03060–CND03070 16 830051 JOHE40299 JOHE40300 HaeIII
Inter-CND03160–CND03170 17 854912 JOHE40301 JOHE40302 BsaHI
Inter-CND03240–CND03250 18 878777 JOHE40303 JOHE40304 AccI
CND03480 19 944503 JOHE23353 JOHE23354 HphI
CND03960 20 1096841 JOHE23357 JOHE23358 AflIII
Inter-CND04040–CND04050 21 8 1129340 JOHE40317 JOHE40318 EcoRV
CND04340 22 1203443 JOHE23361 JOHE23362 Sau96I
CND04760 23 1307202 JOHE27442 JOHE27443 Sau96I
Inter-CND04980–CND04990 24 9 1365745 JOHE27494 JOHE27495 EcoRV
Inter-CND05010–CND05020 25 1372992 JOHE27500 JOHE27501 HinfI
CND05140 26 1407510 JOHE23367 JOHE23368 TfiI
CND05310 27 1447724 JOHE23369 JOHE23370 AccI
Inter-CND05360–CND05370 28 1469659 JOHE40007 JOHE40008 NciI
Inter-CND05440–CND05450 29 10 1480737 JOHE40021 JOHE40022 Sau96I
Inter-CND05590–CND05600 30 11 1514191 JOHE40043 JOHE40044 EcoRV
Inter-BSP3-IKS1 31 12 1529240 JOHE39948 JOHE39949 NciI MAT
ZNF1 32 1546466 JOHE38697 JOHE38698 BstYI MAT
Inter-STE20-MYO2 33 1571084 JOHE39932 JOHE39933 MseI MAT
Inter-LTRTcn10-LTRCnirt3 34 1575936 JOHE39928 JOHE39929 Sau96I MAT
Inter-STE3-LTRTcn10 35 1577047 JOHE39926 JOHE39927 SphI MAT
Unisexual
Reprod
uction
in
Cryptococcus
neoforman
s
PLOS
Genetics
|
www.plosgen
etics.org
6
December
2014
|
Volume
10
|
Issue
12
|
Table 2.Cont.
Marker Name1 Serial No. (
a-a
unisexual)
Serial No. (a-a
bisexual) Location1 Primer (Forward) Primer (Reverse) Enzyme Note
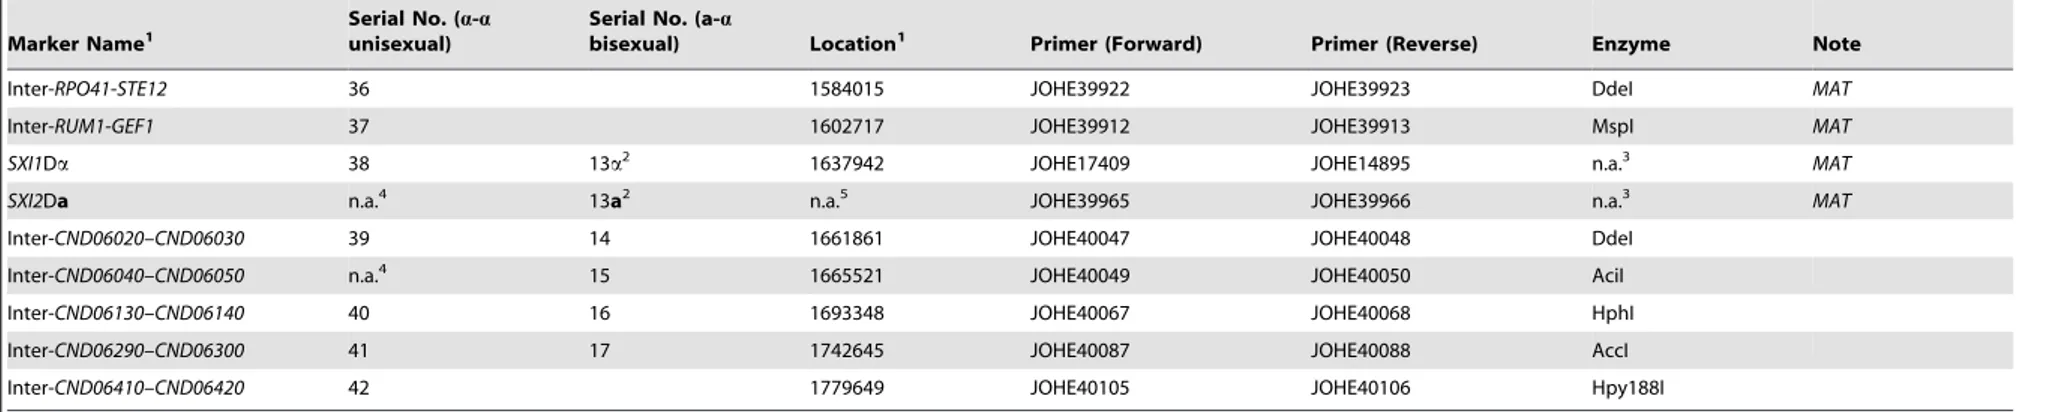
Inter-RPO41-STE12 36 1584015 JOHE39922 JOHE39923 DdeI MAT
Inter-RUM1-GEF1 37 1602717 JOHE39912 JOHE39913 MspI MAT
SXI1Da 38 13a2 1637942 JOHE17409 JOHE14895 n.a.3 MAT
SXI2Da n.a.4 13a2 n.a.5 JOHE39965 JOHE39966 n.a.3 MAT
Inter-CND06020–CND06030 39 14 1661861 JOHE40047 JOHE40048 DdeI
Inter-CND06040–CND06050 n.a.4 15 1665521 JOHE40049 JOHE40050 AciI
Inter-CND06130–CND06140 40 16 1693348 JOHE40067 JOHE40068 HphI
Inter-CND06290–CND06300 41 17 1742645 JOHE40087 JOHE40088 AccI
Inter-CND06410–CND06420 42 1779649 JOHE40105 JOHE40106 Hpy188I
1: The marker names and the locations are based on JEC21 chromosome 4 (GenBank: NC_006686.1). ‘‘Inter-’’ in the marker name indicates the marker is located in the intergenic region between the two genes in the marker name.
Locations of the markers were estimated using the midpoints of the genes, or the intergenic regions between two genes, located on JEC21 chromosome 4. 2: MarkersSXI1DaandSXI2Datarget different alleles of the same locus of the two parental strains that underwenta-abisexual reproduction.
3:SXI1DaandSXI2D
aare PCR markers. Fora-aunisexual production, markerSXI1Daproduces PCR products that show size dimorphism between parental strains 431aand XL280aSS due to the C-terminal truncation of theSXI1Da
gene in strain 431a[18], and thus, the marker is co-dominant. Fora-abisexual reproduction, markersSXI1DaandSXI2Daare both dominant as they amplify PCR products from parental strains 431aand XL280a, respectively.
4: MarkersSXI2Daand Inter-CND06040–CND06050were only used for genotyping progeny froma-abisexual reproduction. 5:SXI2D
ais specific for theMATaallele and is not present in JEC21. doi:10.1371/journal.pgen.1004849.t002
Unisexual
Reprod
uction
in
Cryptococcus
neoforman
s
PLOS
Genetics
|
www.plosgen
etics.org
7
December
2014
|
Volume
10
|
Issue
12
|
the remaining three markers (No. 1, No. 7, and No. 8; Fig. 4). No discrepancy was observed between order of loci within linkage groups and their physical locations on chromosome 4. Similar to
a-aunisexual reproduction, there was no genetic distance between
the two markers flanking the centromere, as well as among markers located within theMATlocus (Fig. 4). The four linkage groups had a total genetic distance of 69.6 cM and encompassed about 529 kb of chromosome 4, producing an average recombi-nation frequency at 7.6 kb/cM that is similar to that observed in
a-aunisexual reproduction (7.13 kb/cM; Table 3). Additionally,
among the five marker intervals for which genetic distances were calculated for botha-aunisexual anda-abisexual reproduction,
four intervals had a trend towards larger genetic distances during a-abisexual reproduction and one interval had a greater genetic
distance during a-a unisexual reproduction (Table 3). For two
intervals, 7/8 and 40/41 (Table 3), the genetic distances duringa
-a bisexual reproduction were almost 4 and 2 times more than
those duringa-aunisexual reproduction. However, no statistically
significant difference was detected between the genetic distances observed in a-a unisexual and a-a bisexual reproduction
(Table 3).
Thus, our results support that recombination is occurring at comparable frequencies duringa-a unisexual and a-a
unisex-ual reproduction inC. neoformans. Additionally, the recombi-nation hot spots (e.g. GC rich regions flanking theMATlocus) and cold regions (such as within the centromere and theMAT locus) that have been identified duringa-abisexual
reproduc-tion are also operating during a-a unisexual reproduction.
Taken together, our results suggest that meiotic recombination is occurring in a similar fashion during the two modes of sexual reproduction.
Crossover within theMAT locus occurs duringa-a unisexual reproduction
During a-a bisexual reproduction, crossovers are repressed
within the MAT locus, likely due to the elevated sequence divergence and extensive chromosomal rearrangements that are present between theMATaand MATa alleles. However, these
physical constraints on meiotic crossover do not exist in a-a
unisexual reproduction, and it is not yet clear whether this will result in theMATlocus undergoing similar meiotic recombination as other chromosome regions duringa-aunisexual reproduction.
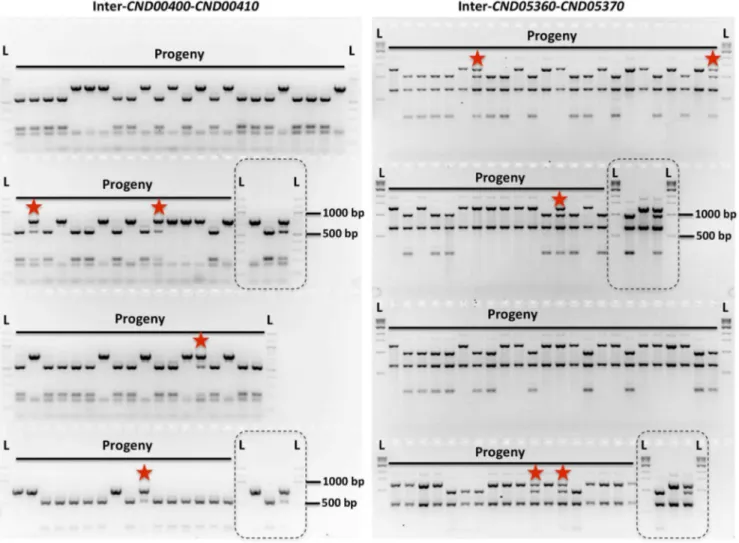
Fig. 2. Genetic markers and genotyping of the meiotic progeny.Shown here are results of genotyping of meiotic progeny froma-aunisexual reproduction strains 431aand XL280aSS. The marker on the left is ‘‘Inter-CND00400–CND00410’’ and the marker on the right is ‘‘Inter-CND05360– CND05370’’ (Please see Table 2 for detailed marker information). Dashed-lined rectangles highlight the controls included during genotyping, which are (from left to right): 431a, XL280aSS, and artificial heterozygote (i.e. mixed DNA sample; please see Materials and Methods for detailed information). ‘‘L’’ indicates DNA ladder. The progeny that are heterozygous at these two markers are highlighted with red stars.
doi:10.1371/journal.pgen.1004849.g002
Unisexual Reproduction inCryptococcus neoformans
Among the 156 meiotic progeny recovered froma-aunisexual
reproduction, we found evidence of crossover within the MAT locus in one progeny, SSB369. Specifically, progeny SSB369 inherited alleles from parental strain 431a(‘‘a’’) at all but 6 of the
42 genetic markers that were applied for genotyping progeny from
a-aunisexual reproduction (S3 Table; Fig. 5). Interestingly, the 6
genetic markers for which progeny SSB369 inherited ‘‘b’’ alleles from parental strain XL280aSS are continuous and are all located
within (5 markers) or at the edge (1 marker) of the MATlocus. Thus, the MAT locus of progeny SSB369 is composed of two tracks of alleles inherited from different parental strains, with alleles from parental strain 431a (‘‘a’’) at 2 loci and alleles from
parental strain XL280aSS (‘‘b’’) at the other 5 loci, with the
breakpoint located between markers ‘‘Inter-RPO41-STE12’’ (No. 36 in Table 2) and ‘‘Inter-RUM1-GEF1’’ (No. 37 in Table 2) (S3 Table; Fig. 5). There are two possible explanations for this observed pattern. It could be the result of a single gene conversion event encompassing the 6 loci for which progeny inherited the ‘‘b’’ alleles. Alternatively, it could have resulted from two crossover events that are located between markers ‘‘Inter-RPO41-STE12’’ and ‘‘Inter-RUM1-GEF1’’, and between mark-ers Inter-CND05590–CND05600 (No. 30 in Table 2) and Inter-BSP3-IKS1(No. 31 in Table 2), respectively. By sequencing the region between these two markers from progeny SSB369, as well as the two parental strains, we mapped the breakpoint to an interval of 150 bp in size (between bp 1,600,099 and 1,600,248; Fig. 5) that is located within theGEF1gene (Fig. 5). Thus, the run of alleles from parental strain XL280aSS (‘‘b’’) within the MAT
locus of progeny SSB369 is more than 50 kb in size, which is likely too large to be the result of a single gene conversion event. Instead, the mosaic allele composition of the MAT locus in progeny SSB369 can be best explained as the result of a crossover event
that occurred within the GEF1 gene, accompanied by another crossover event between markers No. 30 (Inter-CND05590– CND05600) and No. 31 (Inter-BSP3-IKS1) that flank theMAT locus (Fig. 5).
Diploid and aneuploid progeny are produced during sexual reproduction
Among the 156 progeny that we recovered froma-aunisexual
reproduction, 12 (7.7%; or 14.9% if only unique genotypes are considered) were heterozygous for multiple genetic markers that we employed for genotyping, and the number of heterozygous loci ranging from 8 to 39 (Fig. 6). Similarly, among the 27 basidia that were dissected from a-a bisexual reproduction, we found 4
progeny from two separate basidia (7.4%; or 3.7% is all unique genotypes are considered), basidium No. 5 (progeny SSB889 and SSB904) and basidium No. 24 & 25 (progeny SSC243 and SSC258), that were heterozygous for 8 and 9 of the 17 loci that were analyzed, respectively (Fig. 6). All of these progeny were uninucleate based on DAPI staining, and FACS analyses showed that the nuclei of these progeny had about twice the DNA content as the haploid parental strains (S1 Figure), suggesting these progeny are diploid.
To confirm the ploidy of these meiotic progeny containing two copies of chromosome 4, genomes were sequenced for each of the 12 progeny from a-a unisexual reproduction and two progeny
representing the two different genotypes from a-a bisexual
reproduction. Read depths were calculated for each chromosome of each progeny. In addition, among the 12 meiotic progeny from
a-a unisexual reproduction, we found 5 progeny that each
produced distinctly large and small colonies when grown on YPD solid medium (Fig. 6 and Fig. 1C). For each of these 5 progeny, Fig. 3. Crossovers are distributed along chromosome 4 duringa-aunisexual and a-abisexual reproduction.Blue bars represent the
number of progeny froma-aunisexual reproduction between strains 431aand XL280aSS, while the red bars represent the number of genotypes froma-abisexual reproduction between strains 431aand XL280a. The 12 progeny froma-aunisexual reproduction, as well as the 2 genotypes from
a-abisexual reproduction that were disomic for chromosome 4 were excluded. doi:10.1371/journal.pgen.1004849.g003
Unisexual Reproduction inCryptococcus neoformans
both large and small colony isolates were subjected to whole genome analysis.
Because all of the progeny with two copies of chromosome 4 were shown to be diploid (or aneuploid) based on FACS analysis, we assigned the copy number of chromosome 4 as two for each of the progeny. Accordingly, we found that for the two meiotic progeny from a-a bisexual reproduction, the copy numbers of
each of their chromosomes were the same as that of chromosome 4. Thus they were diploid and euploid (Fig. 7 and S2 Figure). For the 12 meiotic progeny from a-a unisexual reproduction, we
found 5 of the 7 progeny that did not produce large and small colonies were diploid and euploid, while the other two, SSB571 and SSB620, were aneuploid. Specifically, progeny SSB571 had two copies of all chromosomes except chromosome 14, which was trisomic with three copies (2N+1; S2i Figure). Progeny SSB620 had two copies of all chromosomes except chromosome 3, which was trisomic (three copies) for the majority of chromosome 3, and disomic (two copies) and tetrasomic (four copies) for the two ends of chromosome 3, respectively (S2j Figure).
For the 5 meiotic progeny froma-aunisexual reproduction that
produced large and small size colonies (Fig. 6), we found that at
least one type of colony for each was aneuploid based on genome sequencing (Fig. 7 and S2 Figure). Specifically, for three progeny (SSB309, SSB394, and SSB552), the large colonies were diploid and euploid while the small colonies were aneuploid, and for two progeny (SSB359 and SSB398) both large and small colonies were aneuploid (Fig. 7 and S2 Figure). Our results also indicated that chromosomal gain/loss had occurred between the large and small colonies from the same meiotic progeny. For example, genome sequencing and FACS analysis showed that the large colony (SSB309-large) of progeny SSB309 was diploid and euploid, while the small colony (SSB309-small) had a ploidy of 2N-1 with only one copy of chromosome 14 (Fig. 7B). By analyzing the SNPs between the two parental strains, we found that the only copy of chromosome 14 in SSB309-small was recombinant, and the two copies of the chromosome 14 in SSB309-large were nearly identical and the same as chromosome 14 in SSB309-small (Fig. 7C). Thus, SSB309-large (2N) likely has evolved from SSB309-small (2N-1) by acquiring an extra copy of chromosome 14 to return to euploidy with loss of heterozygosity due to chromosome loss and duplication of the remaining chromosome. Similarly, for progeny SSB398, the small colony (SSB398-small) Fig. 4. Genetic maps based on analysis ofa-aunisexual and a-abisexual reproduction meiotic progeny.Top and bottom panels:
Genetic maps were constructed fora-abisexual anda-aunisexual reproduction, respectively. The genetic map froma-abisexual reproduction contains four linkage groups (LG) and three genetic markers that are not linked to any other markers (Top), while the genetic map froma-aunisexual reproduction contains three linkage groups (Bottom). Numbers at the bottom of linkage groups indicate the serial numbers of the genetic markers analyzed in this study (see Table 2). Numbers at the top of the linkage groups indicate the genetic distance of the markers from the beginning of their respective linkage groups. Middle panel: A schematic illustration of the genetic markers employed to genotype mating products froma-a unisexual reproduction anda-abisexual reproduction. The black bar represents chromosome 4, the vertical lines indicate physical positions of the genetic markers along chromosome 4, and the red and green bars indicate locations of the centromere andMATlocus, respectively.
doi:10.1371/journal.pgen.1004849.g004
Unisexual Reproduction inCryptococcus neoformans
Table 3.Recombination frequencies duringa-aunisexual and a-abisexual reproduction.
Interval Marker 1 Marker 2
Genetic distance (cM)1
Physical distance (kb)
Recombination frequency (kb/cM)
,LGI.
1/2 Inter-CND00070–CND00080 Inter-CND00310–CND00320 11.7 75 6.41 2/3 Inter-CND00310–CND00320 Inter-CND00400–CND00410 0 24 .2402
3/4 Inter-CND00400–CND00410 Inter-CND00490–CND00500 0 27 .2702
4/5 Inter-CND00490–CND00500 Inter-CND00610–CND00620 2.9 26 8.97 5/6 Inter-CND00610–CND00620 Chrom4_220 kb 20.3 47 2.323
6/7 Chrom4_220 kb Chrom4_280 kb 0 60 .600
7/8 Chrom4_280 kb Inter-CND01130–CND01140 5.1 [19]1 51 10
8/9 Inter-CND01130–CND01140 Inter-CND01270–CND01280 2.9 [2.7]1 31 10.69
9/10 Inter-CND01270–CND01280 Inter-CND01480–CND01490 9.1 [13.5]1 54 5.93
10/11 Inter-CND01480–CND01490 Inter-CND01730–CND01740 5.4 52 9.63 11/12 Inter-CND01730–CND01740 Inter-CND02320–CND02330 24.7 155 6.28 12/13 Inter-CND02320–CND02330 Inter-CND02440–CND02450 0.7 39 55.71
13/14 Inter-CND02440–CND02450 CND02580 2.1 42 20
14/15 CND02580 Inter-CND02890–CND02900 32 81 2.533
15/16 Inter-CND02890–CND02900 Inter-CND03060–CND03070 8.3 45 5.42 16/17 Inter-CND03060–CND03070 Inter-CND03160–CND03170 2.1 25 11.90 17/18 Inter-CND03160–CND03170 Inter-CND03240–CND03250 0 24 .2402
18/19 Inter-CND03240–CND03250 CND03480 7.5 66 8.8 ,LGII.
20/21 CND03960 Inter-CND04040–CND04050 0 32 .3202
21/22 Inter-CND04040–CND04050 CND04340 11.7 74 6.32
22/23 CND04340 CND04760 10.8 104 9.63
23/24 CND04760 Inter-CND04980–CND04990 2.2 59 26.82 24/25 Inter-CND04980–CND04990 Inter-CND05010–CND05020 0 7 .702
25/26 Inter-CND05010–CND05020 CND05140 2.2 35 15.91
26/27 CND05140 CND05310 2.2 40 18.18
27/28 CND05310 Inter-CND05360–CND05370 0 22 .2202
28/29 Inter-CND05360–CND05370 Inter-CND05440–CND05450 0 11 .1102
29/30 Inter-CND05440–CND05450 Inter-CND05590–CND05600 10 [10.2]1 33 3.33
30/31 Inter-CND05590–CND05600 Inter-BSP3-IKS1 39.7 15 0.383
31/32 Inter-BSP3-IKS1 ZNF1 0 17 .1702
32/33 ZNF1 Inter-STE20-MYO2 0 25 .2502
33/34 Inter-STE20-MYO2 Inter-LTRTcn10-LTRCnirt3 0 5 .502
34/35 Inter-LTRTcn10-LTRCnirt3 Inter-STE3-LTRTcn10 0 1 .102
35/36 Inter-STE3-LTRTcn10 Inter-RPO41-STE12 0 7 .702
36/37 Inter-RPO41-STE12 Inter-RUM1-GEF1 n.a.4 19 n.a.4
37/38 Inter-RUM1-GEF1 SXI1Da 0 35 .3502
38/39 SXI1Da Inter-CND06020–CND06030 0 24 .2402 ,LGIII.
40/41 Inter-CND06130–CND06140 Inter-CND06290–CND06300 4.4 [8.5]1 49 11.14
41/42 Inter-CND06290–CND06300 Inter-CND06410–CND06420 n.a.4 37 n.a.4
Total: 223.8 Total: 1596 Average: 7.13
1: Numbers within square brackets are genetic distances in the same intervals during
a-abisexual reproduction.
2: The minimum recombination frequency (kb/cM) within the interval was calculated using 0.1 cM as the estimated maximum genetic distance.
3: Marker intervals that showed significantly higher recombination frequencies compared to chromosomal intervals within the same LG as well as the chromosomal
average.
4: Could not be inferred due to discrepancies between marker orders within linkage groups and their relative physical location on chromosome 4.
doi:10.1371/journal.pgen.1004849.t003
Unisexual Reproduction inCryptococcus neoformans
has one copy, and the large colony (SSB398-large) has two copies, for both chromosomes 10 and 13, respectively (Fig. 7). Again, analyses based on SNPs between the two parental strains showed that the two copies of both chromosome 10 and 13 in SSB398-large were nearly identical and the same as the single copy in SSB398-small (except at the regions where SSB398-large has ploidy higher than 2N, which could be due to segmental duplication and/or chromosomal translocation; S2, S3 Figure), suggesting that the small colony is ancestral and the large colony evolved through acquisition of extra copies of chromosomes. Additionally, chromosome 3 of the large and small colonies of progeny SSB394, and chromosome 11 of the large and small colonies of progeny SSB359 also appear to be homozygous along the whole chromosome, suggesting that these chromosomes have also undergone chromosomal loss and duplication that result in loss of heterozygosity of the whole chromosome, similar to what have been observed in chromosome 14 of the progeny SSB398 (S2, S3 Figure).
Because we dissected individual basidiospores froma-abisexual
reproduction to collect meiotic progeny, the two diploid genotypes froma-abisexual reproduction were due to either 1) packaging of
two euploid haploid meiotic products into one spore during sexual reproduction with subsequent karyogamy or 2) fusion of two post-meiotic nuclei and packaging of a diploid nucleus into the spore. However, for the 12 diploid and aneuploid genotypes froma-a
unisexual reproduction, they could be either due to packaging two haploid nuclei or one diploid nucleus into one spore during sexual reproduction, or they could be the result of secondary fusion of two F1 progeny during our screening process (see also Discussion below).
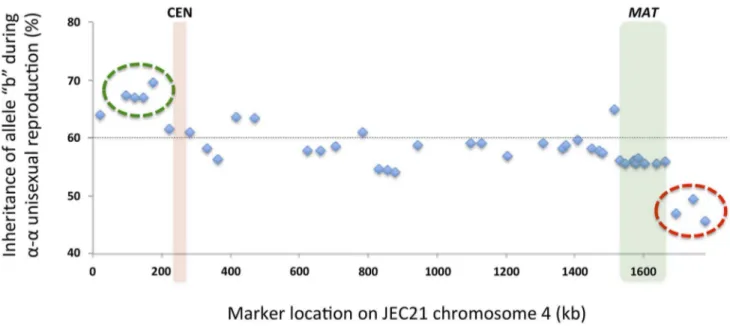
Biased allele inheritance in progeny froma-aunisexual and a-abisexual reproduction
Among the progeny recovered from a-a unisexual
reproduc-tion, we observed a general bias toward inheriting ‘‘b’’ alleles from the parental strain XL280aSS (Fig. 8). Specifically, across all 42
markers, the frequencies of allele ‘‘b’’ among the progeny froma-a
unisexual reproduction ranged between 45.7% and 69.6%, with an average of 58.3%. Interestingly, this inheritance bias toward ‘‘b’’ alleles was most significant in a cluster of 4 markers located close to the left end of chromosome 4 (green circle in Fig. 8). In contrast, a cluster of 3 markers located on the opposite end of Fig. 5. Recombination within theMATlocus duringa-aunisexual reproduction.A) Of the 42 genetic markers (only No. 21 to No. 42 are
shown here for simplicity) that were analyzed for progeny froma-aunisexual reproduction, progeny SSB369 inherited ‘‘a’’ alleles from parental strain 431afor all but 6 markers (No. 31–No. 36; see Table 2 for detailed marker information), which were continuous and located either within or at the edge of theMATlocus. The run of allele ‘‘b’’ stopped between markers No. 36 and No. 37 within theMATlocus at the 59end, and between markers No. 30 and No. 31 that flank theMATlocus at the 39end. The red dashed-lined rectangle indicates theMATlocus. B) Fine mapping conducted by sequencing the region between markers No. 36 and No. 37 showed that in progeny SSB369 the breakpoint within theMATlocus for the run of ‘‘b’’ alleles is located inside theGEF1gene, within a region of 150 bp in size.
doi:10.1371/journal.pgen.1004849.g005
Unisexual Reproduction inCryptococcus neoformans
chromosome 4 showed a significant allele inheritance bias toward the ‘‘a’’ alleles from parental strain 431a(red circle in Fig. 8).
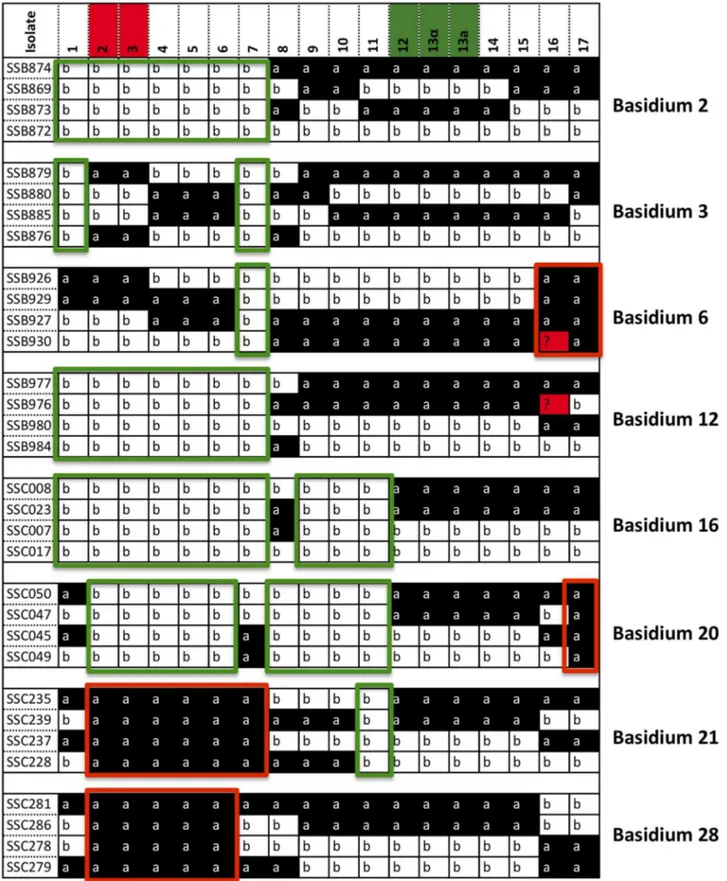
Similarly, we also found evidence of biased allele inheritance among progeny that were dissected froma-a bisexual
reproduc-tion. Specifically, of the 26 basidia from which viable spores were recovered (basidium No. 15 was excluded because only one viable spore was recovered), for 8 basidia (30.8%) there was at least one (and up to 10) genetic marker(s) for which the allele from one of the two parental strains was absent among all viable spores (Fig. 9). All eight basidia generated spores that belonged to four different genotypes, and the germination rates of the spores from these eight basidia were higher than 80% except for two basidia, No. 3 and No. 20, that had spore germination rates of 50% and 46%, respectively. Among these eight basidia, the absence of an allele from one of the two parental strains occurred in 13 of the 17 loci analyzed. Interestingly, of the four loci for which no biased allele inheritance has been observed during a-a bisexual
reproduction, one locus,SXI1Da/SXI2Da, is located within the MAT locus, while the other three, Inter-BSP3-IKS1, Inter-CND06020–CND06030 and Inter-CND06030–CN06040, are located within regions that flank theMATlocus (Table 2; Fig. 9).
Of the cluster of four genes that showed the most significant biased inheritance towards ‘‘b’’ alleles during a-a unisexual
reproduction, marker Inter-CND00490–CND00500 was also used for genotyping progeny from a-a bisexual reproduction.
Allele ‘‘b’’ of marker Inter-CND00490–CND00500was present in progeny from all of the 26 basidia dissected from bisexual reproduction. However, in four of the 26 basidia (basidia 2, 12, and 16; Fig. 9) the ‘‘a’’ allele from parental strain 431a for this
marker was absent in all of the progeny that germinated, which is consistent with the biased inheritance toward the ‘‘b’’ allele observed at this marker duringa-aunisexual reproduction.
Of the cluster of three genes that showed the most significant biased inheritance towards ‘‘a’’ alleles during a-a unisexual
reproduction, markers Inter-CND06130–CND06140 and Inter-CND06290–CND06300 were also employed to genotype prog-eny from a-a bisexual reproduction. The ‘‘a’’ alleles for both
markers were present in progeny from all of the 26 basidia dissected. However, the ‘‘b’’ alleles for markers Inter-CND06130– CND06140 and Inter-CND06290–CND06300 were absent among progeny from 1 (basidium 6) and 2 (basidia 6 and 20) basidia, respectively (Fig. 9). Again, this is consistent with the more Fig. 6. Meiotic progeny disomic for chromosome 4 are produced bya-aunisexual and a-abisexual reproduction.Top panel: Meiotic
progeny froma-aunisexual reproduction between strains 431aand XL280aSS that are disomic for chromosome 4 are shown. Bottom panel: Meiotic progeny from thea-abisexual reproduction between strains 431aand XL280athat are disomic for chromosome 4 are depicted. The marker numbers in each panel correspond to those listed in Table 2. For simplicity, not all of the markers fora-aunisexual reproduction are shown (please see S3 Table for complete genotyping profiles). The markers located within the MATlocus are highlighted in green, while the markers flanking the centromere are highlighted in red. The values for ploidy were estimated based on FACS analyses and whole genome sequencing (see S1, S2 Figure), where 1N represents haploid and 2N represents diploid. Additionally, the ‘‘+’’ and ‘‘2’’ following 1N or 2N indicate the presence and absence of specific chromosomes, respectively. For example: 2N+22,3(SSB359-small) represents diploid (2N) with additional two chromosomes (ch. 2 and 3). The small colony from progeny SSB552 appears to be a mixture of individuals with varying ploidy levels (S2 Figure), and is thus designated as ‘‘undetermined’’ here.
doi:10.1371/journal.pgen.1004849.g006
Unisexual Reproduction inCryptococcus neoformans
biased inheritance towards ‘‘a’’ alleles at these loci observed ina-a
unisexual reproduction.
Discussion
InC. neoformans, a leading human fungal pathogen, mating can be bisexual, occurring between isolates of opposite mating type,MATaandMATa. However, it has been recently discovered
that sexual reproduction also occurs between isolates of the same mating type, especiallyMATa [16]. Similar plasticity in mating
compatibilities occurs in C. albicans, another important human fungal pathogen [24]. The relaxed constraints on mating compatibility and consequently increased chances for sexual reproduction could provide evolutionary advantages for these pathogenic fungi, manifested as changes in ploidy and generation of novel genotypes through recombination [18].
Although unisexual reproduction in C. neoformans has been well characterized qualitatively, detailed quantitative assessments of this unique mode of sexual reproduction have not. One outstanding question is the extent of recombination duringa-a
unisexual reproduction, and how this compares to a-a bisexual
reproduction. Put another way: Does the level of recombination during a-a unisexual reproduction support its assignment as a
complete meiotic sexual cycle? In the study that first describeda-a
unisexual reproduction in C. neoformans, the authors analyzed eight progeny using 20 genetic markers located on 5 chromosomes [16]. They found clear evidence of independent chromosomal segregation among the 5 chromosomes; additionally, recombina-tion was detected among markers on 4 of the 5 chromosomes [16]. However, the genetic markers were widely dispersed along each chromosome, and the number of progeny analyzed was relatively Fig. 7. Transient aneuploid and persistent diploid progeny are generated froma-aunisexual reproduction.A) The three panels show
the read depths of all chromosomes in the three parental strains: 431a, XL280aSS, and XL280a. For each panel, the x-axis indicates the 14 chromosomes and the y-axis indicates the read depth from the Illumina sequencing. These strains had only one copy of chromosome 4, as no heterozygosity was detected for any marker from chromosome 4 that was analyzed, and thus, all are haploid. This was also consistent with results from the FACS analyses (S1 Figure). B) The six panels show the read depths of all chromosomes in strains derived from three meiotic progeny froma -aunisexual reproduction between strains 431aand XL280aSS. For each panel, the x-axis indicates the 14 chromosomes and the y-axis indicates the read depth from the Illumina sequencing. All of these strains showed heterozygosity at multiple markers along chromosome 4 (Fig. 6), indicating they had at least two copies of chromosome 4. FACS analyses indicated that these strains were likely diploid (S1 Figure), which was consistent with the sequencing results shown here suggesting all of the meiotic progeny had two copies for the majority of the chromosomes (including chromosome 4). The two panels within each of the three dashed-lined rectangles are sequencing results of small and large colonies, respectively, that were derived from the same meiotic progeny. C) The distribution of SNPs along chromosome 14 in the small and large colonies of the progeny SSB309, as well as the two parental strains 431aand XL280aSS. The genome sequence of each isolate was mapped against the published genome sequence of strain JEC21. The light blue bars indicate SNPs compared to JEC21, dark blue bars indicate heterozygous sites, while grey areas indicate regions that are identical to JEC21. The centromeric region of chromosome 14 is highlighted by the green rectangle.
doi:10.1371/journal.pgen.1004849.g007
Unisexual Reproduction inCryptococcus neoformans
small, which prevented a more quantitative assessment of recombination frequencies duringa-aunisexual reproduction.
In our study, we found that the two modes of sexual reproduction resulted in similar phenotypic segregation among meiotic progeny, including transgressive phenotypes observed under a variety conditions (Fig. 1). Additionally, frequencies of crossovers along chromosome 4 in the two modes of sexual reproduction were comparable (S5 Table and Fig. 3). Further-more, of the five chromosomal regions for which we were able to calculate genetic distances for botha-aunisexual anda-abisexual
reproduction, four showed comparable genetic distances with less than twofold differences between the two modes of sexual reproduction (intervals 8/9, 9/10, 29/30, and 40/41 in Table 3), while the other interval had genetic distances that are,4 times higher in a-a bisexual reproduction than in a-a unisexual
reproduction (intervals 7/8 in Table 3). These results provide definitive support thata-aunisexual anda-a bisexual
reproduc-tion involve similar meiotic processes.
The average recombination frequency observed during a-a
unisexual reproduction was,7.13 kb/cM. This is higher than the genome average of ,13.2 kb/cM previously reported for a-a
bisexual reproduction in serotype D C. neoformans [13]. There are several reasons why we may have observed a higher overall recombination frequency occurring along chromosome 4. First, as discussed below, chromosome 4 contains two recombination hot spots that flank theMATlocus, which could elevate the average recombination frequency of chromosome 4 compared to the genome wide average, even after taking into account that recombination is repressed within MAT(Fig. 4). Additionally, in the previous Marra et al. study, although linkage groups were established for most of the genome, some chromosomal regions were not included in the linkage map [13]. Thus, the genome wide recombination frequency average could be an underestimate. For example, there were two linkage groups assigned to chromosome 4 [13], which correspond to LGII and LGIII in oura-aunisexual
reproduction linkage map (Fig. 4). Thus, a linkage group (LGI;
Fig. 4) of about 130 cM in size encompassing a chromosomal region of more than 900 kb (Table 2) was not present in the Marra et al. linkage map [13]. Because the authors used the total genetic map length and genome size to calculate the average recombina-tion frequency, the omission of linkage groups could have underestimated the genome wide recombination frequency.
We also observed that recombination frequencies were not distributed evenly along chromosome 4 during a-a unisexual
reproduction, and several possible recombination hot spots were present. First, there were two gaps among the three linkage groups that were established for chromosome 4. The gap between LGI and LGII (between markers No. 19 and No. 20; Table 2 and Fig. 4) was relatively large (152 kb in size), and thus could be due to a paucity of sufficient genetic markers within this region to bridge the two linkage groups. However, the gap between LGII and LGIII encompassed a relatively small chromosomal region (31 kb in size; between markers No. 39 and No. 40). Given the population size of the meiotic progeny that were analyzed, the failure to establish linkage between LGII and LGIII was then most likely due to a recombination hot spot within this region. Notably, this gap overlaps with one of two recombination hot spots flanking MATpreviously shown to operate duringa-areproduction [11].
Also consistent with previous studies, the region flanking the other side of MAT also showed elevated recombination frequencies duringa-aunisexual reproduction (between markers No. 30 and
No. 31; Table 3 and Fig. 4). Specifically, the recombination frequency between markers No. 30 and No. 31 (interval 30/31 in Table 3) was 0.38 kb/cM, more than 18 times the chromo-somal average (7.13 kb/cM). Thus, the recombination hot spots that have been previously identified to flank MATand operate during a-a bisexual reproduction also function during a-a
unisexual reproduction.
Elevated recombination frequencies were also found in two other regions within LGI, intervals 5/6 and 14/15, within which recombination occurred at frequencies that were about 3.1 and 2.9 times the chromosomal average, respectively (Table 3). It is not Fig. 8. Biased allele inheritance among progeny froma-aunisexual reproduction.The X-axis shows the positions of the markers, and the
Y-axis indicates the percentage (%) of unisexual progeny that inherited allele ‘‘b’’ from parental strain XL280aSS at each marker. The dashed line indicates 60%. The green circle highlights a cluster of four markers that showed particularly high allele ‘‘b’’ frequencies, while the red circle highlights a cluster of three markers that showed relatively lower allele ‘‘b’’ frequencies. The red and green columns indicate the locations of the centromere andMATlocus, respectively.
doi:10.1371/journal.pgen.1004849.g008
Unisexual Reproduction inCryptococcus neoformans
Fig. 9. Biased allele inheritance among progeny from a-abisexual reproduction.Numbers in the top row indicate the loci/genetic markers
used for genotyping progeny froma-abisexual reproduction, with the markers flanking the centromere are highlighted in red and the markers within theMATlocus are highlighted in green (see Table 2 for detailed information). For simplicity, only the unique genotypes are shown for each of the eight basidia that showed biased allele inheritance. The markers that exhibited biased allele inheritance are highlighted by rectangles, with red color indicating a bias toward the ‘‘a’’ allele and green color indicating a bias toward the ‘‘b’’ allele.
doi:10.1371/journal.pgen.1004849.g009
Unisexual Reproduction inCryptococcus neoformans
clear what causes the increased recombination frequency within the interval 14/15. However, for interval 5/6, it is located in the chromosomal region that flanks the centromere of chromosome 4. Centromeres and their flanking regions are classically considered crossover deserts. Indeed, it has been shown that in yeast centromere-proximal crossovers usually lead to precocious sepa-ration of sister chromatids during meiosis, and is often responsible for spore inviability [29]. However, recent studies reveal these recombination cold spots might not be that cold after all. For example in Arabidopsis, unexpectedly high levels of gene conversion have been observed near centromeres [30]. Addition-ally, extensive gene conversions were found within centromere cores in maize [31]. Thus, the elevated recombination frequency within interval 5/6 could be due to extensive gene conversion. Interestingly, one of the two markers that flanks interval 5/6, marker No. 5, exhibited the most biased allele inheritance during
a-aunisexual reproduction (Table 2 and Fig. 8), which would also
be consistent with biased gene conversion being prevalent in this region. The recombination frequency in the chromosomal region flanking the other side of the centromere (interval 7/8 in Table 3) was 10 kb/cM during a-a unisexual reproduction, not
signifi-cantly different from the chromosomal average. However, the same interval had a recombination frequency that was almost 4 times higher (19 cM and 2.68 kb/cM) during a-a bisexual
reproduction (Table 3), indicating a recombination hot spot might operate within this region. Although no crossover has been observed within the centromeric region in either a-a or a-a
reproduction, the lack of suitable genetic markers within the centromere prevented us from investigating if intra-centromeric gene conversion had occurred during sexual reproduction.
No recombination has been detected withinMAT duringa-a
bisexual reproduction, which is consistent with the notion that recombination within MAT is highly repressed during sexual reproduction, presumably due to rearrangements between the MATaandMATaalleles. However, gene conversion does occur
at high frequency around a GC rich region withinMATduringa
-a bisexual mating [12], suggesting that MAT, just like
centro-meres, might not be as bereft of recombination as previously thought. Interestingly, among the 156 mating products and eight genetic markers that were analyzed for a-a unisexual
reproduc-tion, one recombination event was detected within MAT that likely resulted from crossover. Specifically, the MAT locus of progeny SSB369 contained two stretches of alleles inherited from different parents, with the breakpoint located in a region of 150 bp in size within theGEF1gene (between nucleotides 1,600,099 and 1,600,248 on chromosome 4; Fig. 5). Although this pattern could be the result of a gene conversion event, the track would have to be .50 kb in size, which is rare. Thus, we hypothesize that the observedMATlocus allele composition in progeny SSB369 is the result of a double crossover, with one occurring at the breakpoint withinMATand the other at the edge ofMATbetween markers 30 and 31 (Fig. 5).
Given that the alleles of theMATlocus are co-linear between the two parental MATa strains, it is thus not surprising that
crossover occurred withinMAT duringa-a unisexual
reproduc-tion. Instead, given the size of MAT (.100 kb) and the chromosomal average recombination frequency (7.13 kb/cM), we would have expected to identify more than 21 events of inter-MATrecombination among the 156a-aunisex progeny analyzed.
The lower than expected frequency has two possible explanations. First, repair of double strand breaks (DSBs) induced withinMAT may have an innate bias toward pathways leading to gene conversions (e.g. Synthesis Dependent Strand Annealing, SDSA) than pathways yielding crossovers (e.g. Double Strand Break
Repair, DSBR). Second, we have found that, similar to a-a
reproduction, recombination hot spots also operate flankingMAT duringa-aunisexual reproduction. Thus, inter-MAT
recombina-tion, including crossovers and gene conversions, could have been repressed due to interference exerted by these recombination hot spots even though no chromosomal rearrangements are present withinMATduringa-aunisexual reproduction. We note that the GEF1gene, within which the hypothesized crossover breakpoint is located, lies in a cluster of MAT genes (GEF1 to RPO41 in Fig. 5A) that show the least divergence between theMATaand MATaalleles ofC. neoformans[32]. Additionally, the intergenic
region between the RPO41 and BSP2 genes, where a gene conversion hot spot has been identified during a-a bisexual
reproduction [12], is also located within this gene cluster, and is near theGEF1gene (Fig. 5). Thus, the high similarity betweena andaalleles within this gene cluster could be the result of ongoing
recombination (crossovers and gene conversions) in this region duringa-aanda-areproduction.
Previous studies have found that diploid/aneuploid progeny can also be readily produced at high frequency during hybridization between serotypes A and DC. neoformans, which is likely due the elevated sequence divergence as well as the large number of chromosomal rearrangements that are present between the parental strains [28,33,34]. In our study, froma-aunisexual and
a-a bisexual reproduction, we recovered 12 and 4 progeny,
respectively, that were heterozygous for portions of the genetic markers analyzed (Fig. 6). Subsequent FACS analyses and genome sequencing showed that four progeny from a-a bisexual
repro-duction, as well as five of the 12 progeny from a-a unisexual
reproduction were diploid (Fig. 6, S1, S2 Figure). Of the other 7 progeny froma-aunisexual reproduction that had two copies of
chromosome 4, two produced colonies uniform in size and were shown to be diploid with one additional chromosome (2N+1; SSB571 and SSB620; Fig. 6 and S1, S2 Figure), while the other 5 produced dimorphic (large and small) colonies on YPD plates. By sequencing both large and small colonies from each of these five progeny, we found that for two progeny (SSB359 and SSB398) both large and small colonies were aneuploid (Fig. 6 and 7), while for the other three progeny the large colonies were diploid and the small colonies were aneuploid (Fig. 6 and 7; S1, S2 Figure). Furthermore, our data suggest that for two of these three progeny, the diploid large colonies were derived from the ancestral small aneuploid colonies by chromosome gain.
These diploid/aneuploid progeny were meiotic products, as they contained chromosomes that had clearly undergone recom-bination (Fig. 6). Thus, they could be the result of either errors that occurred during meiosis that caused chromosomal mis-segregation, or due to packaging of two meiotic products into a single spore during spore generation. Additionally, for the 12 diploid/aneuploid progeny froma-aunisexual reproduction that
were disomic for chromosome 4, because they were not isolated by spore dissection, it is possible they result from secondary cell-cell fusion between two meiotic products during the screening process. We observed a frequency between 7.7% and 14.9% (see Results) for diploid/aneuploid progeny generated bya-aunisexual
reproduction, while fora-abisexual reproduction, the frequency
of diploid/aneuploid progeny was between 3.7% and 7.4%. In a recent study by Ni and Feretzaki et al. [26], aneuploidy was found to be generated at a frequency between 4% and 5% during both
a-a unisexual and a-a bisexual reproduction in C. neoformans,
slightly lower than our observations, which included both diploid and aneuploid progeny. However, in our study, we only analyzed ploidy in detail for progeny disomic for chromosome 4; thus, the frequency observed represents the lower limit of the actual
Unisexual Reproduction inCryptococcus neoformans