AR
TIGO
AR
TICLE
1 Programa de Pós-Graduação em Saúde e Comportamento, Universidade Católica de Pelotas. R. Gonçalves Chaves 373/411C, Centro. 96015-560 Pelotas RS Brasil. [email protected] 2 Departamento de Nutrição, Faculdade de Nutrição, Universidade Federal de Pelotas. Pelotas RS Brasil.
Sedentary lifestyle and poor eating habits in childhood:
a cohort study
Sedentarismo e práticas alimentares inadequadas na infância:
um estudo de coorte
Resumo Mundialmente, cerca de 22 milhões de
crianças menores de cinco anos têm excesso de peso, sendo que fatores ambientais são os prin-cipais desencadeadores da epidemia. O objetivo deste trabalho foi verificar os hábitos alimentares e de atividade física em crianças de oito anos de idade, pertencentes a uma coorte de Pelotas, Bra-sil. Os hábitos alimentares foram avaliados com base nos Dez Passos para Alimentação Saudável, propostos pelo Ministério da Saúde. Para avaliar o nível de atividade física, utilizou-se o questioná-rio de atividade física para crianças e adolescentes (PAQ-C). Das 616 crianças avaliadas aos 8 anos, observou-se que 50,3% eram do sexo masculino; 70,3% de cor branca e pouco mais de metade per-tencia à classe econômica C. Nenhuma das crian-ças foi classificada como muito ativa ou aderiu ao consumo diário de 6 porções do grupo de cereais, tubérculos e raízes. Os passos de maior adesão fo-ram o 8 (não adicionar sal aos alimentos prontos); o 4 (consumo de feijão, pelo menos, 5 vezes por semana) e o 1 (realização de 3 refeições e 2 lanches por dia), respectivamente. A alta prevalência de inatividade física e o baixo nível de hábitos ali-mentares saudáveis , confirmam a importância de estratégias para apoiar e incentivar a prática de atividade física e alimentação saudável entre os jovens.
Palavras-chave Crianças, Dieta, Hábitos ali-mentares, Atividade física
Abstract Worldwide, about 22 million children
under five years old are overweight. Environmen-tal factors are the main trigger for this epidemic. The purpose of this study was to evaluate the ea-ting and physical activity habits in a cohort of eight-year-old children in Pelotas, Brazil. Eating habits were assessed based on the Ten Steps to He-althy Eating proposed by the Ministry of Health. To assess the level of physical activity, the physical activity questionnaire for children and adoles-cents (PAQ-C) was used. Of the 616 interviewed children at 8 years, it was observed that 50.3% were male; 70.3% were white and just over half belonged to economic class C. None of the children were classified as very active and none acceded to a daily consumption of six servings of the cere-als, tubers, and roots. The steps that had higher adhesion were 8 (do not add salt to ready foods); 4 (consumption of beans, at least 5 times per week) and 1 (have 3 meals and 2 snacks per day), respec-tively. The high prevalence of physical inactivity and low level of healthy eating habits confirm the importance of strategies to support and encourage the practice of physical activity and healthy eating among youth.
Key words Children, Diet, Eating habits, Phys-ical activity
Gisele Ferreira Dutra 1
Cristina Correa Kaufmann 2
Alessandra Doumid Borges Pretto 1
D
u
Introduction
Obesity is a worldwide epidemic and a risk fac-tor in the natural course of several other chronic diseases1. With the rise of globalization and its
consequences (particularly urbanization, indus-trialization, and economic development), there are negative changes in the population’s lifestyle, including changes in dietary patterns and a de-crease in physical activity2.
Worldwide, about 22 million children un-der five years old are overweight and more like-ly to become obese adults and to suffer from non-communicable chronic diseases (NCDs)3.
Childhood can be one of the most favorable periods for obesity prevention4. However,
para-doxically, the management can be more complex than in adult life, since it is related to changes in parents’ habits and availability and is inhibited by the lack of knowledge children have on the con-sequences of this condition5.
The etiology of obesity is multifactorial; how-ever, environmental changes comprise the main triggering factors of the epidemic, since they pre-dispose too much consumption of energy associ-ated with lower energy expenditure6. Therefore,
encouraging the increase of physical activity and the adoption of beneficial dietary habits are the main devices for creating a healthy lifestyle for young people7.
Healthy eating should provide water, car-bohydrates, proteins, lipids, fiber, vitamins, and minerals, which are essential for preserving health8. In terms of physical activity, children and
adolescents aged 5-17 years should accumulate at least 60 minutes on a daily basis at a moder-ate-to-vigorous-intensity level in an activity such as free play, games, sports, transportation, rec-reation, or planned exercising, in the context of family, school, and community activities9.
How-ever, national studies indicate unhealthy eating habits such as low consumption of fruits10 and
vegetables10,11, in addition to high consumption
of candies and fats10 among children. Added to
this scenario is the low level of physical activity found in this age group12,13.
The aim of this study was to investigate eat-ing and physical activity habits in eight-year-old children, from a cohort in Pelotas, Rio Grande do Sul, Brazil.
Methods
This is a prospective cohort study of people born between September 2002 and May 2003 in hos-pitals in the city of Pelotas (RS), Southern Bra-zil and followed a random sample of 30% of these, at 30, 90 and 180 days. This study refers to a cross-sectional analysis of data collected in the follow-up that occurred when the children were 8 years of age. These children were visited at home, and trained medical students adminis-tered a standardized and pretested questionnaire to mothers or caregivers and children on various aspects of child health, including the frequency, type and intensity of physical activity in the last week and the quantity and quality of the meals in the last month. Details on the cohort method-ology are published in Mascarenhas et al.14 and
Fonseca et al.15.
In the present study, the eating and physical activity habits in children aged eight years were evaluated. The assessment of eating habits was based on the Ten Steps to Healthy Eating (Dez
Passos para Alimentação Saudável), which were
developed by the Brazilian Ministry of Health16.
To collect data for each of the steps, we for-mulated questions that helped confirm the fre-quency of food consumption within one month before the interview. The response options were divided into seven categories: never, 1-2 times a week, 3-6 times a week, once a day, 2 times a day, 3 times a day, and more than 3 times a day. Step 9 (water) was categorized as it follows with an-swers: “I: do not take drink water”, “do not take drink water every day”, statements referring to 1-2 glasses a day, 3-5 glasses a day, 6-8 glasses a day, and more than 8 glasses a day. Steps 1, 8 and 10 were collected by direct questions whose re-sponse options were yes or no.
e C
ole
tiv
a,
21(4):1051-1059,
2016
one serving of vegetable oils, olive oil, butter or margarine constituted the membership to step 6. Likewise, step 7 was considered positive when the child consumed sodas, processed juices, sug-ar cookies, sandwich cookies, and other treats at most once a day. Step 8 was met when the answer to a question about adding salt to prepared food was “no.” Adherence to step 9 occurred when water consumption was at least two liters a day, while step 10 adherence was characterized by at least 30 minutes of physical activity every day and the maintenance of appropriate weight.
To calculate the nutritional status, we ana-lyzed anthropometric data (weight and height) by gender and age during the interview, from which body mass index (BMI) was calculated. The subjects were weighed using a portable scale with a 150 kg capacity and accuracy to ± 100 g, wearing light clothing without shoes. Height were measured using a portable stadiometer. Children with score values z ≥ -2 and ≤ + 1 were considered to have adequate weight; those with the score z < -2 were underweight; those with BMI with score values z > +1 and ≤ +2 were overweight, and those with score z > +2 were obese17,18.
To assess the level of physical activity, we used the Physical Activity Questionnaire for Children and Adolescents (PAQ-C), developed by Crock-er et al.19. This survey characterizes the level of
physical activity in the seven days preceding its application. It consists of nine questions about the practice of sports, games, and physical activ-ities at school and in free time, including week-ends. Each question has a value of one to five, and the final score is obtained by averaging the questions. A score of one is equivalent to a very sedentary lifestyle and five indicates a very active lifestyle. Scores two, three, and four represent the categories sedentary, moderately active, and active, respectively. Participants could be classi-fied as active (score ≥ 3) or sedentary (score < 3). The PAQ -C also includes a question on the average daily time in front of the TV and another on the existence of diseases impeding the normal development of the activities during the previous week, however, these data do not make up the score calculation.
To ascertain the repeatability of the data col-lected, the field work supervisor repeated a ran-dom sample of 10% of the interviews, using a synthesized questionnaire. The sample size was calculated based on a confidence level of 95% and a statistical power of 80%, exposures ranging from 15% to 80%, assuming a Relative Risk (RR)
of 2 and increase of 15% to the initial calcula-tion for losses and confounding factors control. We performed the calculation of the frequencies of the variables, the bivariate analysis between exposure factors and the outcome and between exposure factors and other variables.
The following variables were evaluated: de-mographic data (gender of the child [male or female], color [white or non-white], and mater-nal and patermater-nal age in years); socioeconomic data (family income, economic class according to the classification of the Brazilian Association of Research Companies [Associação Brasileira de Empresas de Pesquisa- ABEP]20,and
moth-er’s education); maternal color (white or non-white); number of children including the one in the study; marital status (living with a partner or not); maternal smoking; maternal overweight (reported by the interviewee); and character-istics of the child (gestational age, birth weight in grams, duration of breastfeeding, and physi-cal activity). Only the associations with p < 0.05 were considered statistically significant.
Epi-Info 6.0 and SPSS (version 21.0) for Win-dows were used to analyze data. Data were en-tered twice and checked for consistency. Initially, the frequencies of the variables of interest were obtained to characterize the study sample. Later, bivariate analysis between exposure factors and outcome was done, using chi-squared and linear trend tests.
The research project of perinatal data and visits of one, three, and six months was approved by the Committees of Research and Ethics in Health from Santa Casa de Misericórdia de Pelo-tas and from Fundação de Apoio Universitário (FAU), and ratified by the Committee of Ethics in Research from Universidade Federal do Rio Grande do Sul and by the Scientific Committee from Universidade Católica de Pelotas. The cur-rent research project, with visits to children eight years of age, was approved by the Ethics Com-mittee from Universidade Católica de Pelotas, as this new step was not included in the previous project. Informed consent in writing was ob-tained from parents or guardians, after they have received detailed and accurate information about the research.
Results and discussion
refus-D
u
als, 17 deaths, 93 cases of moves to other states or cities, and 242 cases whose addresses could not be found. The sample set of children who were visited was representative of that from the hos-pital screening.
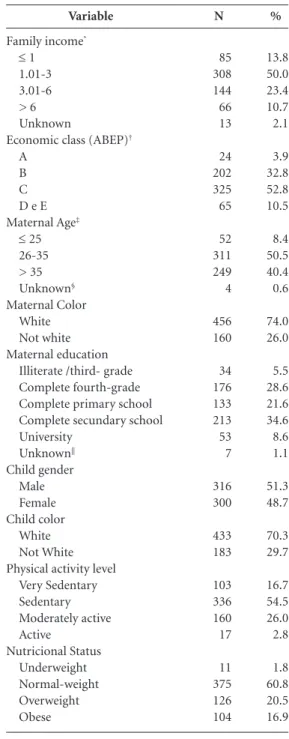
It was observed that about 10% of children were born preterm, and 8% were underweight at birth (< 2500 g). A little more than half of the sample belonged to economic class C, about 70 % of the children were sedentary and 37.4 % ex-cess weight. The other characteristics are shown in Table 1. More than half of the children were found to be sedentary, and none were found to be very active.
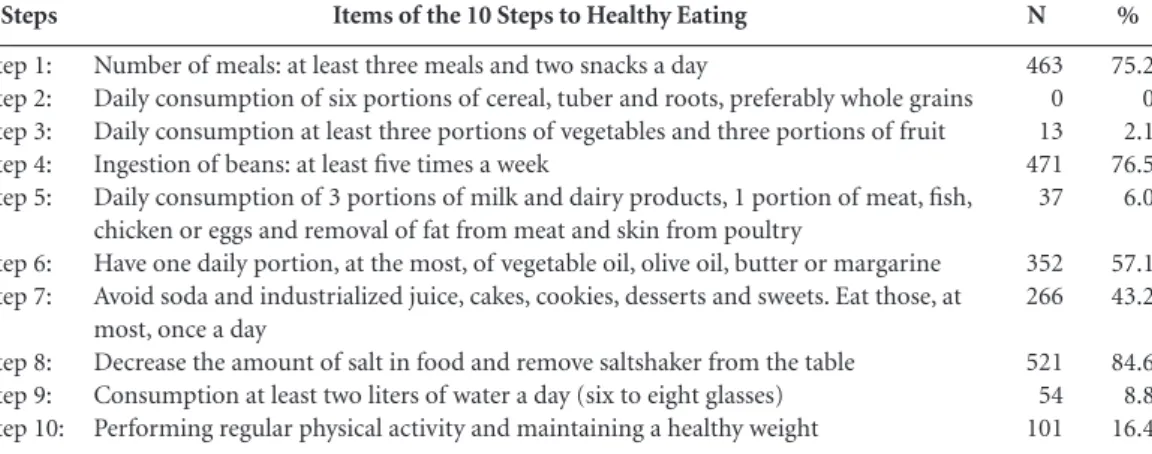
Table 2 shows that frequency of adherence to the Ten Steps to Healthy Eating was low, indicat-ing a possible need to rethink the most effective approach to this population. Vinholes et al.21,
Ra-phaelli et al.22, and Couto et al.23, also exposed low
adherence to the steps suggested by the Ministry of Health, in the adult21 and adolescent22,23
pop-ulation of the same city. These results are con-sistent with the prevalence of overweight in this location24. In addition, they confirm the findings
of Santos et al.25, who described the nutritional
status of family members in food insecurity in Pelotas/ RS. The authors found high rates of over-weight in all age groups, besides height deficit in children aged under five years, implying that food insecurity situation of these families could be re-lated not only to the low availability of food, but also to the poor nutritional value of them.
According to the results, step 1 (having at least three meals and two snacks a day) was mostly ad-hered by the children (75.2%). This was positive, because although there is no consensus about its benefits, the increase on the frequency of meals may reduce appetite, the loss of nitrogen, and im-prove lipid oxidation and blood markers such as total cholesterol, LDL–cholesterol, and insulin26.
In a study with dyslipidemic women, Oliveira and Sichieri27 suggested that having six daily meals
could be a measure of prevention and control of hypercholesterolemia, independent of age, body weight and type of eaten food, fruit, or fiber, once there was a reduction in total and LDL-C serum cholesterol. Furthermore, studies have shown an inverse association between the number of daily meals and BMI28,29.
On the other hand, no children adhered to step 2, which is the daily recommended con-sumption of six servings of the group of cereals, tubers and roots, preferably whole grains. How-ever, the individual analysis of groups of foods of this step showed that 39.1% of children had
eaten the recommended daily servings of cere-als, 6.7% ate the portions of tubers and roots, and 2.8% gave priority to whole grains. In the
Variable
Family income*
≤ 1 1.01-3 3.01-6 > 6 Unknown
Economic class (ABEP)†
A B C D e E Maternal Age‡
≤ 25 26-35 > 35 Unknown§
Maternal Color White Not white Maternal education
Illiterate /third- grade Complete fourth-grade Complete primary school Complete secundary school University
Unknown||
Child gender Male Female Child color
White Not White Physical activity level
Very Sedentary Sedentary Moderately active Active
Nutricional Status Underweight Normal-weight Overweight Obese
N
85 308 144 66 13
24 202 325 65
52 311 249 4
456 160
34 176 133 213 53 7
316 300
433 183
103 336 160 17
11 375 126 104
%
13.8 50.0 23.4 10.7 2.1
3.9 32.8 52.8 10.5
8.4 50.5 40.4 0.6
74.0 26.0
5.5 28.6 21.6 34.6 8.6 1.1
51.3 48.7
70.3 29.7
16.7 54.5 26.0 2.8
1.8 60.8 20.5 16.9
Table 1. Characteristics of the sample, Pelotas (RS), 2011 (N = 616).
e C
ole
tiv
a,
21(4):1051-1059,
2016
studies of Raphaelli et al.22 and Couto et al.23,
the total consumption of such foods was 31.5% and 21.0%, respectively. To obtain a healthy diet, 55% to 75% of the total energetic value of the diet (TEV) must come from total carbohydrates (complexes + free or simple sugars). Of these, 45-65% of the supplied energy should be derived from foods rich in complex carbohydrates such as grains, tubers, and roots8. Whole foods are rich
in fiber, vitamins, minerals, and other nutrients30,
exerting a protective effect against a number of chronic diseases such as diabetes, obesity, and heart disease31. Moreover, Esmaillzadeh et al.32
showed an inverse association between whole grain consumption and metabolic syndrome, corroborating its benefits to health.
The consumption of vegetables and fruits was also low (2.11%). Similar results were found in oth-er studies conducted in Southoth-ern Brazil33,34, which
is worrying because the daily recommendation is for at least three servings of vegetables and three servings of fruits, based on these foods’ potential prevention of non-communicable diseases16.
Step 4 (consumption of beans at least five times a week) had second-highest adherence (76.5%), confirming previous studies carried out in this city, which also reported good ad-herence to this step22,23. Moreover, this result is
higher than the one found by Bortolini et al.35,
who found daily consumption of this legume by 63.4% of children between 6-59 months of age in Southern Brazil. The percentage found in this study is important, since the Household Budget Surveys (POF)36 reveal a decrease in annual per
capita household consumption of beans, which is an important source of iron, fiber and, asso-ciated with rice, of high quality plant protein8.
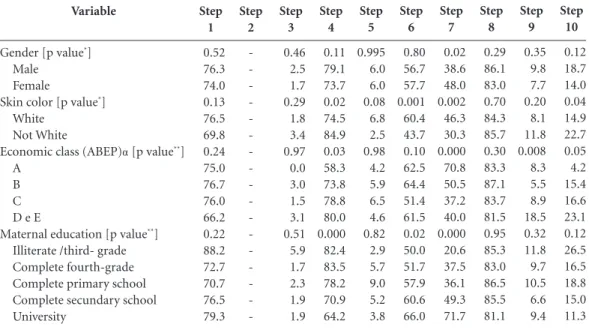
Confirming previous studies, consumption of beans was associated with non-white skin color37,
lower socioeconomic status38 and lower maternal
education39 (Table 3).
The fifth step was followed by 6.0% of chil-dren, but by analyzing the items separately, 25% consumed three servings of milk and dairy prod-ucts daily. This is higher than the result found by Filha et al.40, who reported adequate intake
of these foods by about 7% of the children en-rolled in the Public Health System of the city of Aracaju (SE). Regarding the intake of meat, fish, poultry, or eggs, 32.8% of the sample met the rec-ommendation to consume them once a day. In a research study conducted with adolescents in Pelotas (RS), the frequency of daily consump-tion of red meat and white meat was 43.0% and 9.7%, respectively41. In the present study, 80.7%
of the respondents reported removing the visible fat from meats. The percentage is higher than the one found in a study with adults, also resident in Pelotas (RS) in which 52.3% reported the con-sumption of meat with excess fat42.
The sixth step had adhesion of 57.1% of the sample and as it can be observed in the table 3, being associated with the white race and higher maternal education. Filha et al.40 found adequate
consumption of fats by only 6.2% of the children aged between 24 and 35 months, in Aracaju (SE).
Accession to step 7 was associated with the female gender, white race, socioeconomic status and maternal education (Table 3). Vinholes et al.21 observed the consumption of foods high in
sugar more often than twice a week by 41% of adults in Pelotas (RS), which were positively as-sociated with age and negatively asas-sociated with education.
%
75.2 0 2.1 76.5 6.0
57.1 43.2
84.6 8.8 16.4
Steps
Step 1: Step 2: Step 3: Step 4: Step 5:
Step 6: Step 7:
Step 8: Step 9: Step 10:
Items of the 10 Steps to Healthy Eating
Number of meals: at least three meals and two snacks a day
Daily consumption of six portions of cereal, tuber and roots, preferably whole grains Daily consumption at least three portions of vegetables and three portions of fruit Ingestion of beans: at least five times a week
Daily consumption of 3 portions of milk and dairy products, 1 portion of meat, fish, chicken or eggs and removal of fat from meat and skin from poultry
Have one daily portion, at the most, of vegetable oil, olive oil, butter or margarine Avoid soda and industrialized juice, cakes, cookies, desserts and sweets. Eat those, at most, once a day
Decrease the amount of salt in food and remove saltshaker from the table Consumption at least two liters of water a day (six to eight glasses) Performing regular physical activity and maintaining a healthy weight
Table 2. Frequency of adherence to the items of the 10 Steps to Healthy Eating of the sample, Pelotas (RS), 2011.
N
463 0 13 471 37
352 266
D
u
Step 8 was the one with largest accession in the sample (84.6%), consistent with the result found by Vinholes et al.21. This finding is
import-ant because excessive sodium ingestion is one of the major modifiable risk factors in the genesis of systemic hypertension (SH)43. Furthermore,
studies show excessive consumption of foods high in sodium by child44,45, so that the SH, which
previously reached only the elderly, now also in-cluded young people46.
The item relating to the consumption of at least two liters of water a day had poor acces-sion (8.7%), and was inversely associated with socioeconomic status (Table 3). This percentage is lower than the one found in recent studies47,48.
Furthermore, the association concerning water ingestion and socioeconomic status, differs from other studies47,49.
Analyzing step 10, according to Table 3, there was greater adherence by non-white chil-dren and those of lower socioeconomic status. We found that about 60% of the children main-tained appropriate weight and 37.4% were ex-cess weight (Table 1). In a study with children and adolescents from Maceió (AL), the authors observed better results when checking 86.2% of normal-weight and 13.8% of excess weight in
the sample12. However, when assessing the level
of physical activity, the prevalence of physical inactivity was 93.5%, whereas in this study was 71.2%. According to Olds et al.50, although the
rates of childhood overweight and obesity are stabilizing in many countries, they remain high, causing harmful effects on health across the life span. Thus, it becomes necessary to develop in-terventions that encourage active behaviors such as daily walks, school activities, and programs in-volving parents and children51.
Regarding physical activity, jogging was the most prevalent sport activity both in general population and in the study population (in both genders). Moreover, according to the bivariate analysis, only the gender variable was significant-ly associated with physical activity, which was found to be more frequent among boys (Table 4). These results confirm previous studies in Pelotas (RS), in which the frequency of physical activi-ty was higher among men21,52,53. Corroborating
the results found by Hallal et al.54, in this study
soccer and basketball were the sports played sig-nificantly more often among boys, while dancing and volleyball had significantly greater adherence among girls.
Variable
Gender [p value*]
Male Female
Skin color [p value*]
White Not White
Economic class (ABEP)α[p value**]
A B C D e E
Maternal education [p value**]
Illiterate /third- grade Complete fourth-grade Complete primary school Complete secundary school University
Table 3. Frequency of adherence to the 10 Steps to Healthy Eating according to the variables studied. Pelotas (RS), 2011. Step 1 0.52 76.3 74.0 0.13 76.5 69.8 0.24 75.0 76.7 76.0 66.2 0.22 88.2 72.7 70.7 76.5 79.3 Step 2 -Step 3 0.46 2.5 1.7 0.29 1.8 3.4 0.97 0.0 3.0 1.5 3.1 0.51 5.9 1.7 2.3 1.9 1.9 Step 4 0.11 79.1 73.7 0.02 74.5 84.9 0.03 58.3 73.8 78.8 80.0 0.000 82.4 83.5 78.2 70.9 64.2 Step 5 0.995 6.0 6.0 0.08 6.8 2.5 0.98 4.2 5.9 6.5 4.6 0.82 2.9 5.7 9.0 5.2 3.8 Step 6 0.80 56.7 57.7 0.001 60.4 43.7 0.10 62.5 64.4 51.4 61.5 0.02 50.0 51.7 57.9 60.6 66.0 Step 7 0.02 38.6 48.0 0.002 46.3 30.3 0.000 70.8 50.5 37.2 40.0 0.000 20.6 37.5 36.1 49.3 71.7 Step 8 0.29 86.1 83.0 0.70 84.3 85.7 0.30 83.3 87.1 83.7 81.5 0.95 85.3 83.0 86.5 85.5 81.1 Step 9 0.35 9.8 7.7 0.20 8.1 11.8 0.008 8.3 5.5 8.9 18.5 0.32 11.8 9.7 10.5 6.6 9.4 Step 10 0.12 18.7 14.0 0.04 14.9 22.7 0.05 4.2 15.4 16.6 23.1 0.12 26.5 16.5 18.8 15.0 11.3
e C
ole
tiv
a,
21(4):1051-1059,
2016
Conclusions
Given the increasing rates of childhood obesity and health problems that this condition entails, it is necessary studies to explicate the factors that cause changes in nutritional status in children. Considering this study’s findings, it is possible to conclude that adherence to Ministry of Health recommendations was low.
The results confirm the importance of strat-egies to support and encourage the practice of physical activity and healthy eating among chil-dren, which must have intersectional character, comprising health, education and culture poli-cies, and must also integrate the society and fam-ily. Only by making children and youth aware-ness about the importance of healthy habits, the growing obesity epidemic can be reduced, as well as the harms adjacent to this disease, especially the diseases associated with it and, therefore, the burden on health services.
Variable
Gender Male Female Skin color
White Not white
Economic class (ABEP) * A
B C D e E
Maternal education Illiterate /third- grade Complete fourth-grade Complete primary school Complete secundary school University
PR (CI95%)
1.32 (1.03-1.70) 1.00
1.00 1.10 (0.84-1.43)
1.00 1.87 (0.75 -4.69) 1.66 (0.68-4.14) 1.85 (0.70-4.85)
1.00 0.88 (0.51-1.51) 0.86 (0.49-1.50) 0.96 (0.57-1.62) 0.76 (0.38-1.49)
Table 4. Association between physical activity and socio-demographic variables. Pelotas (RS), 2011.
p
0.03
0.51
0.51
0.88
* Classification according to Brazilian Association of Research Companies (Associação Brasileira de Empresas de Pesquisa), emphasizes people’s purchasing power without classifying them into social classes. Economic class A comprises people with the highest purchasing power, and economic class E, those with least purchasing power. PR (IC95%): Prevalence Ratio and 95% Confidence Interval.
Collaborations
D
u
Brasil. Ministério da Saúde (MS). Secretária de Atenção à Saúde. Departamento de Atenção Básica. Orientações para a coleta e análise de dados antropométricos de saú-de: Norma Técnica do Sistema de Vigilância Alimentar e Nutricional – SISVAN. Brasília: MS; 2011.
De Onis M, Onyango AW, Borghi E, Siyam A, Nishida C, Siekmann J. Development of a WHO growth ref-erence for school-aged children and adolescents. Bull World Health Organ 2007; 85(9):660-667.
Crocker PR, Bailey DA, Faulkner RA, Kowalski KC, Mcgrath R. Measuring general levels of physical ac-tivity: Preliminary evidence for the Physical Activity Questionnaire for Older Children. Med Sci Sports Exerc
1997; 29(10):1344-1349.
Associação Brasileira de Empresas de Pesquisa (ABEP). 2008. [cited 2013 Apr 1]. Available from: http://www. abep.org
Vinholes DB, Assunção MCF, Neutzling MB. Frequ-ência de hábitos saudáveis de alimentação medidos a partir dos 10 Passos da Alimentação Saudável do Mi-nistério da Saúde: Pelotas, Rio Grande do Sul, Brasil.
Cad Saude Publica 2009; 25(4):791-799.
Raphaelli CO, Azevedo, MR, Hallal PC. Associação entre comportamentos de risco à saúde de pais e ado-lescentes em escolares de zona rural de um município do Sul do Brasil. Cad Saude Publica 2011; 27(12):2429-2440.
Couto SF, Madruga SW, Neutzling MB, Silva MC. Fre-quência de adesão aos “10 Passos para uma Alimenta-ção Saudável” em escolares adolescentes. Cien Saude Colet 2014; 19(5):1589-1599.
Gigante DP, Dias-da-Costa JS, Olinto MTA, Menezes AMB, Macedo S. Obesidade da população adulta de Pe-lotas, Rio Grande do Sul, Brasil e associação com nível socioeconômico. Cad Saude Publica 2006; 22(9):1873-1879.
Santos JV, Gigante DP, Domingues MR. Prevalência de insegurança alimentar em famílias de Pelotas, Rio Grande do Sul, Brasil, e estado nutricional de indivídu-os que vivem nessa condição. Cad Saude Publica 2010; 26(1):41-49.
La Bounty PM, Campbell BI, Wilson J, Galvan E, Be-rardi J, Kleiner SM, Kreider RB, Stout JR, Ziegenfuss T, Spano M, Smith A, Antonio J. International Society of Sports Nutrition position stand: meal frequency. J Int Soc Sports Nutr 2011; 8:4.
Oliveira MC, Sichieri R. Fracionamento das refeições e colesterol sérico em mulheres com dieta adicionada de frutas ou fibras. Rev Nutr 2004; 17(4):449-459. Holmback I, Ericson U, Gullberg B, Wirfalt E. A high eating frequency is associated with an overall healthy lifestyle in middle-aged men and women and reduced likelihood of general and central obesity in men. Br J Nutr 2010; 104(7):1065-1073.
Bachman JL, Phelan S, Wing RR, Raynor HA. Eating frequency is higher in weight loss maintainers and nor-mal-weight individuals than in overweight individuals.
J Am Diet Assoc 2011; 111(11):1730-1734. 17.
18.
19.
20.
21.
22.
23.
24.
25.
26.
27.
28.
29. References
World Health Organization (WHO). Obesity: prevent-ing and managprevent-ing the global epidemic. Report of a WHO Consultation on Obesity. Geneva: WHO; 2000. World Health Organization (WHO). Diet, nutrition and the prevention of chronic diseases. Report of a Joint WHO/FAO Expert Consultation. Geneva: WHO; 2003. World Health Organization (WHO). School policy framework: Implementation of the WHO global strate-gy on diet, physical activity and health. Geneva: WHO; 2008.
Natale R, Scott SH, Messiah SE, Schrack MM, Uhlhorn SB, Delamater A. Design and methods for evaluating an early childhood obesity prevention program in the childcare center setting. BMC Public Health 2013; 13:78.
Mello ED, Luft VC, Meyer F. Obesidade infantil: como podemos ser eficazes? J Pediatr 2004; 80(3):173-182. Enes CC, Slater B. Obesidade na adolescência e seus principais fatores determinantes. Rev Bras Epidemiol
2010; 13(1):163-171.
Sabia RV, Santos JE, Ribeiro RPP. Efeito Da atividade física associada à orientação alimentar em adolescentes obesos: comparação entre exercício aeróbico e anaeró-bico. Rev Bras Med Esporte 2004; 10(5):349-355. Brasil. Ministério da Saúde (MS). Secretaria de Atenção à Saúde, Coordenação- Geral da Política de Alimenta-ção e NutriAlimenta-ção. Guia alimentar para a população brasi-leira. Brasília: MS; 2005.
World Health Organization (WHO). Global recom-mendations on physical activity for health. Geneva: WHO; 2010.
Conceição SIO, Santos CJN, Silva AAM, Silva JS, Oli-veira TC. Consumo alimentar de escolares das redes pública e privada de ensino em São Luís, Maranhão.
Rev Nutr 2010; 23(6):993-1004.
Alves MN, Muniz LC, Vieira MFA. Consumo alimentar entre crianças brasileiras de dois a cinco anos de ida-de: Pesquisa Nacional de Demografia e Saúde (PNDS), 2006. Cien Saude Colet 2013; 18(11):3369-3377. Rivera IR, Silva MAM, Silva RDTA, Oliveira BAV, Car-valho ACC. Atividade física, horas de assistência à TV e composição corporal em crianças e adolescentes. Arq Bras Cardiol 2010; 95(2):159-165
Barros SSH, Lopes AS, Barros MVG. Prevalência de baixo nível de atividade física em crianças pré-esco-lares. Rev Bras Cineantropom Desempenho Hum 2012; 14(4):390-400.
Mascarenhas ML, Albernaz EP, Silva MB, Silveira RB. Prevalence of exclusive breastfeeding and its determin-ers in the first 3 months of life in the South of Brazil. J Pediatr (Rio J) 2006; 82(4):289-294.
Fonseca AL, Albernaz EP, Kaufmann CC, Neves IH, Figueiredo VL. Impact of breastfeeding on the intelli-gence quotient of eight-year-old children. J Pediatr (Rio J) 2013; 89(4):346-353.
Brasil. Ministério da Saúde (MS). Coordenação Geral da Política de Alimentação e Nutrição. Alimentação saudável para todos: siga os 10 passos. Brasil, 2005. [cited 2013 Jun 1]. Available from: http://nutricao.saude.gov. br/documentos/10passos_adultos.pdf
1.
2.
3.
4.
5. 6.
7.
8.
9.
10.
11.
12.
13.
14.
15.
e C
ole
tiv
a,
21(4):1051-1059,
2016
Slavin J. Why whole grains are protective: biological mechanisms. Proc Nutr Soc 2003; 62(1):129-134. Ye EQ, Shacko SA, Chou EL, Kuqizaki M, Liu S. Greater whole-grain intake is associated with lower risk of type 2 diabetes, cardiovascular disease, and weight gain. J Nutr 2012; 142(7):1304-1313.
Esmaillzadeh A, Mirmiran P, Azizi F. Whole-grain con-sumption and the metabolic syndrome: A favorable association in Tehranian adults. Eur J Clin Nutr 2005; 59(3):353-362.
Costa LCF, Vasconcelos FAG, Corso ACT. Fatores asso-ciados ao consumo adequado de frutas e hortaliças em escolares de Santa Catarina, Brasil. Cad Saude Publica
2012; 28(6):1133-1142.
Muniz LC, Zanini RV, Schneider BC, Tassitano RM, Feitosa WMN, González-Chica DA. Prevalência e fato-res associados ao consumo de frutas, legumes e verdu-ras entre adolescentes de escolas públicas de Caruaru, PE. Cien Saude Colet 2013; 18:393-404.
Bortolini GA, Gubert MB, Santos LMP.Consumo ali-mentar entre crianças brasileiras com idade de 6 a 59 meses. Cad Saude Publica 2012; 28: 1759-1771. Instituto Brasileiro de Geografia e Estatística (IBGE).
Pesquisa de orçamentos familiares 2008-2009: análise do consumo alimentar pessoal no Brasil. Rio de Janeiro: IBGE; 2011.
Sichieri R, Castro JFG, Moura AS. Fatores associados ao padrão de consumo alimentar da população brasileira urbana. Cad Saude Publica 2003; 19(Supl. 1):S47-S53. Velásquez-Meléndez G, Mendes LL, Pessoa MC, Sar-dinha LMV, Yokota RTC, Bernal RTI, Malta DC. Ten-dências da frequência do consumo de feijão por meio de inquérito telefônico nas capitais brasileiras, 2006 a 2009. Cien Saude Colet 2012; 17(12):3363-3370. Dos Santos Barroso G, Sichieri R, Salles-Costa R. Re-lationship of socio-economic factors and parental eating habits with children’s food intake in a popula-tion-based study in a metropolitan area of Brazil. Pub-lic Health Nutr 2012; 17(1):156-161.
Filha EOS, Araújo JS, Barbosa JS, Gaujac DP, Santos CFS, Silva DG. Consumo dos grupos alimentares em crianças usuárias da rede pública de saúde do mu-nicípio de Aracaju, Sergipe. Rev Paul Pediatr 2012; 30(4):529-536.
Assunção MCF, Dumith SC, Menezes AMB, Araújo CL, Schneider BC, Vianna CA, Machado EC, Wehrmeister FC, Muniz LC, Zanini RV, Orlandi SP, Madruga SW. Consumo de carnes por adolescentes do Sul do Brasil.
Rev Nutr Campinas 2012; 25(4):463-472.
Schneider BC, Silva SM, Assunção MCF. Consumo de Carnes por Adultos do Sul do Brasil: Um Estudo de Base Populacional. Cien Saude Colet 2014; 19(8):3583-3592.
Sociedade Brasileira de Cardiologia, Sociedade Brasi-leira de Hipertensão, Sociedade BrasiBrasi-leira de Nefrolo-gia. VI Diretrizes Brasileiras de Hipertensão. Arq Bras Cardiol 2010; 95(1 Supl.1):1-51.
Costa FP, Machado SH. O consumo de sal e alimen-tos ricos em sódio pode influenciar na pressão arterial das crianças? Cien Saude Colet 2010; 15(Supl. 1):1383-1389.
Matuk TT, Stancari PCS, Bueno MB, Zaccarelli, EM. Composição de lancheiras de alunos de escolas parti-culares de São Paulo. Rev Paul Pediatr 2011; 29(2):157-163.
Ferreira JS, Aydos RD. Prevalência de hipertensão arte-rial em crianças e adolescentes obesos. Cien Saude Colet
2010; 15(1):97-104.
Goodman AB, Blanck HM, Sherry B, Park S, Nebeling L, Yaroch AL. Behaviors and Attitudes Associated With Low Drinking Water Intake Among US Adults, Food Attitudes and Behaviors Survey, 2007. Prev Chronic Dis
2013; 10:E51.
Feferbaum R, Abreu LC, Leone C. Fluid intake patterns: an epidemiological study among children and adoles-cents in Brazil. BMC Public Health 2012; 12:1005. Kant AK, Graubard BI, Atchison EA. Intakes of plain water, moisture in foods and beverages, and total water in the adult US population — nutritional, meal pat-tern, and body weight correlates: National Health and Nutrition Examination Surveys 1999-2006. Am J Clin Nutr 2009; 90:655-663.
Olds T, Maher C, Zumin S, Péneau S, Lioret S, Castet-bon K, Bellisle, de Wilde J, Hohepa M, Maddison R, Lissner L, Sjöberg A, Zimmermann M, Aeberli I, Og-den C, Flegal K, Summerbell C. EviOg-dence that the prev-alence of childhood overweight is plateauing: data from nine countries. Int J Pediatr Obes 2011; 6(5-6):342-360. Shultz SP, Browning RC, Schutz Y, Maffeis C, Hills AP. Childhood obesity and walking: guidelines and chal-lenges. Int J Pediatr Obes 2011; 6(5-6):332-341. Hallal PC, Matsudo SM, Matsudo VKR, Araújo TL, An-drade DR, Bertoldi AD. Physical activity in adults from two Brazilian areas: similarities and differences. Cad Saude Publica 2005; 21(2):573-580.
Azevedo MR, Araujo CL, Reichert FF, Siqueira FV, Silva MC, Hallal PC. Gender differences in leisure time phys-ical activity. Int J Public Health 2007; 52(1):8-15. Hallal PC, Bertoldi AD, Gonçalves H, Victora CG. Pre-valência de sedentarismo e fatores associados em ado-lescentes de 10-12 anos de idade. Cad Saude Publica
2006; 22(6):1277-1287.
Artigo apresentado em 05/10/2014 Aprovado em 22/08/2015
Versão final apresentada em 24/08/2015 30.
31.
32.
33.
34.
35.
36.
37.
38.
39.
40.
41.
42.
43.
44.
45.
46.
47.
48.
49.
50.
51.
52.
53.