17 1. PhD. Pediatrician. Professor, Universidade Católica de Brasília (UCB),
Brasília, DF, Brazil. 2. MSc.
Manuscript received May 28 2003, accepted for publication Oct 01 2003. Abstract
Objective: To analyze the relationship between obesity, physical activity and hours of sleep in schoolchildren and parental schooling and obesity.
Methods: We measured the weight, height, body mass index and adiposity (subscapular to triceps skinfold ratio) of children. The children were classified as normal, underweight, overweight or obese, according to body mass index per age. Four hundred and fifty-two schoolchildren were evaluated; 68 children with excess weight and obesity and 97 normal children were selected to answer a questionnaire regarding daily physical activity and sleeping hours, as well as parental schooling, physical activity, weight and height.
Results: The prevalence of excess weight and obesity was of 21.1% in boys and 22.9% in girls. Adiposity was different between normal children and the other groups (p < 0.01). In children with excess weight and obesity, adiposity was directly correlated with daily sitting hours and inversely correlated with daily sleeping hours (p < 0.05). Schooling was lower in mothers of overweight and obese children was lower than in mothers of normal children (p < 0.01). The frequency of excess weight and obesity in the parents of overweight/obese children was higher than in the parents of normal children (p < 0.01). Most parents had a sedentary life style.
Conclusion: We observed an association between excess weight and obesity in children and inactivity. The time spent sleeping was a positive factor for maintaining a balance between weight and height. Maternal schooling and the presence of excess weight/obesity in parents were significantly associated with childhood obesity.
J Pediatr (Rio J). 2004;80(1):17-22: Excess weight, body mass index, adiposity, sleep.
Factors associated with obesity
in school children
Rodolfo Giugliano1, Elizabeth C. Carneiro2 Copyright © 2004 by Sociedade Brasileira de Pediatria
O
RIGINALA
RTICLEIntroduction
Obesity is currently regarded as a public health problem that affects both young people and adults.1 The data about Brazilian children obtained by the Brazilian Institute for Food and Nutrition (INAN) and by the Brazilian Survey on Nutrition and Health (PNSN) in 1989 demonstrate that nearly one and a half million children suffer from obesity, whose prevalence is higher among girls and in well developed regions.2 However, this profile has been changing, and obesity has been increasing among boys and in underprivileged social classes.3
In the last decades children have become less active as a result of their easy access to technological advances. A positive relationship has been observed between lack of activity (e.g.: time spent watching television) and an increase in adiposity in school-aged children.9,10 Physical activity, however, reduces the risk of obesity by regulating the energy balance or improving the ratio of lean-to-fat tissue
The aim of the present study was to investigate the relationship between daily activities and number of hours of sleep and overweight and obesity in school-aged children. Some familial factors were also analyzed, such as educational level, parental obesity and parental physical activity patterns in comparison to childhood obesity.
Materials and Methods
The study was carried out in 2000 and included both male and female students aged between 6 and 10 years, as part of the PREVINE (Nutritional Study and Surveillance of Students) project developed by Universidade Católica de Brasília (UCB). The aim of this study was to assess and record the weight, height and the BMI of elementary to high school students for the early diagnosis of overweight, obesity or underweight, as well as for the guidance of students and parents. The study was approved by the research ethics committee of Universidade Católica de Brasília. The PREVINE project included students from Centro Educacional da Católica de Brasília, a private school inside the campus of UCB in which middle and upper-middle class children from the town of Taguatinga are enrolled. A total of approximately 2,500 students participated in the project, which corresponds to nearly 2.1% of the students enrolled in private schools in Brasília.12 All students could participate in the PREVINE project provided their parents signed an authorization for their inclusion in the study.
The anthropometric assessment of the students was performed at the Laboratory of Nutritional Assessment (LAN) of UCB, where they had their weight, height, and triceps and subscapular skinfold thicknesses measured. Measuring instruments included a metal Sanny® tape measure mounted to the wall (Kirchnner & Wilhelm, Medizintechnik, Germany), with a precision of 2 m/0.1 cm for height measurement; a digital Filizola® scales (Indústria Filizola S/A, Brazil) with a capacity for 0 to 150 kg/100 g for weight measurement, and a Lange skinfold caliper (Beta Technology Incorporated, Cambridge, Maryland, USA) with a precision of 0.5 mm for skinfold thickness measurement. All anthropometric measurements were made according to the Anthropometric Standardization Reference Manual.13
In the first part of the study, we calculated the body mass index (BMI) of the children by dividing their weight (kg) by their squared height (m). The body fat percentage (%BF) was estimated using the triceps and subscapular skinfold thicknesses.14 Students were then classified as normal, overweight, or obese depending on their BMI for age, considering the thresholds proposed by Cole et al.,15 and as underweight in cases with a BMI for age below the 5th percentile16 (Table 1).
In the second part of the study, we matched the children according to sex and age and split them into two groups: OW+O (overweight and obese children) and a control group (healthy children). The control group included only 50 children of each sex due to time restrictions, since the interviews were time-consuming and could only be conducted outside of classtime.
Parents were allowed to answer the questionnaire at home. Parental physical activity was assessed by a questionnaire adapted from Ross & Jackson,17 in which participants had to indicate whether they had a sedentary lifestyle or did little or moderate to intense physical activity, according to the models proposed. Daily recalls,
Male Female
Age Underweight Overweight Obesity Underweight Overweight Obesity
(years) (<) (>) (>) (<) (>) (>)
6 13.7 17.5 19.8 13.4 17.3 19.6
6.5 13.7 17.7 20.2 13.4 17.5 20.1
7 13.7 17.9 20.6 13.4 17.7 20.5
7.5 13.7 18.2 21.1 13.5 18.0 21.0
8 13.8 18.4 21.6 13.5 18.3 21.6
8.5 13.8 18.7 22.2 13.6 18.7 22.2
9 13.9 19.1 22.8 13.7 19.1 22.8
9.5 14.1 19.5 23.4 13.8 19.4 23.5
10.0 14.2 19.8 24.0 14.0 19.9 24.1
10.5 14.3 20.2 24.6 14.2 20.3 24.8
11 14.5 20.5 25.1 14.4 20.7 25.4
adapted from Sallis et al.,18 were used to assess the childrens physical activity, and the amount of time spent sitting, number of hours of sleep and leisure-time physical activities also were recorded. In case of children, questions about sports activities and about the habit of going to clubs and fitness centers and engaging in free time activities also were included. All questionnaires were previously tested to identify possible difficulties in filling them out.
Means (x), standard deviation (SD) and frequency (%) were calculated for the statistical analysis. Pearsons correlation coefficient was used to assess the level of association between the variables analyzed. Students t test was used to compare the mean results of the analyzed variables and χ2 was used for comparison of frequencies. Multiple linear regression was used to detect the influence of variables over overweight and obesity. A p value below or equal to 0.05 was considered to be statistically significant for a 95%CI. The data were analyzed through SPSS 10.0 (SPSS Inc.) statistical package.
Results
Students
In the first part of the study, 452 students were assessed - 203 boys (44.9%) and 249 girls (55.1%). Among the assessed boys, 85 (41.9%) were 6 to 8 years old and 118 (58.1%) were 9 and 10 years old. As to girls, 112 (45.0%) were 6 to 8 years old and 137 (55.0%) were 9 and 10 years old.
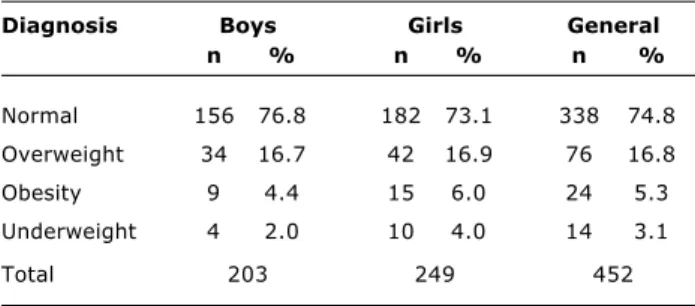
Table 2 shows the frequency of healthy, underweight, overweight and obese children. The concomitance of obesity and overweight was similar for both sexes, amounting to 21.1% in boys and 22.9% in girls.
The mean body fat percentage increased from underweight to healthy children and from healthy children to overweight and obese children, in both boys and girls (Table 3). Significant differences were observed (p<0.01). Healthy girls had a higher body fat percentage than boys (p < 0.01).
Table 2 - Distribution of normal, underweight, overweight and obese children based on BMI/age15,16 (Brasília, DF)
Diagnosis Boys Girls General
n % n % n %
Normal 156 76.8 182 73.1 338 74.8
Overweight 34 16.7 42 16.9 76 16.8
Obesity 9 4.4 15 6.0 24 5.3
Underweight 4 2.0 10 4.0 14 3.1
Total 203 249 452
Table 3 - Mean values and standard deviation (x±sd) of adiposity14 in normal, underweight, overweight and obese children based on BMI/age15,16 (Brasília, DF)
Body fat (x±dp)
Boys Girls General
Normal* 16.3±4.2 [156] 19.1±4.0 [182] 17.8±4.4 [338]
Overweight 26.9±4.9 [34] 27.6±4.3 [42] 27.3±4.5 [76]
Obesity 40.1±7.2 [9] 33.8±3.8 [15] 36.2±6.0 [24]
Underweight 12.0±1.9 [4] 14.0±4.3 [10] 13.5±3.8 [14]
Total 19.1±7.5 [203] 21.2±6.2 [249] 20.3±6.9 [452]
[ ]: number of children;
(*) and (†): significant difference (p < 0.01) in all columns.
There was agreement between the diagnosis of overweight and obesity according to the BMI for age15 and excess adiposity in children, in accordance with the threshold values for body fat proposed by Lohman19 (20% for boys and 25% for girls). The frequency of excess adiposity between healthy boys and girls or false negatives according to the BMI for age was of 20.0% and 18.2% respectively, most cases relating to threshold values for high adiposity. The concordance between excess adiposity and overweight and obesity ranged between 97.3% for girls and 95.2% for boys, which indicates a low occurrence of false positives when the BMI for age was used.
In the second part of the study, overweight and obese children (43 boys and 57 girls from the OW+O group) and 50 healthy children of each sex in the control group were interviewed, randomly selected (drawn out), after being age- and sex-matched, in comparison with overweight and obese children. The participation of families with overweight and obese children was small (61.8%), consisting of 33 boys and 35 girls, comparatively to the families with healthy children (97%).
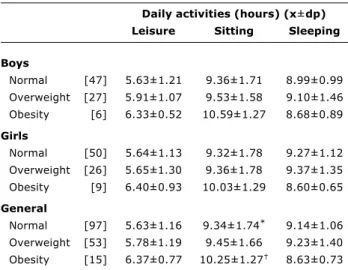
The childrens daily physical activity and number of hours of sleep are shown in Table 4. Notably, around 75% of childrens daily routine is distributed between hours of sleep and hours spent sitting. Differences were observed between the groups regarding the amount of time spent sitting, which was longer for the OW+O group than for the control group in both boys and girls. The difference is significant (p < 0.05) when we compare healthy and obese children.
Sports were practiced by boys (63.8%) more often than by girls (43.5%) [p < 0.01], and also were more frequent among healthy children than among overweight ones. The sports most widely practiced by boys were swimming and indoor soccer (futsal), whereas girls preferred swimming and tennis.
The habit of going to clubs and fitness centers was similar between groups and sexes, and the multiple regression analysis did not show any correlation of body fat with these parameters.
Parents
Table 5 shows parental educational level. The study population is notably of a different type, since over 50% of parents have a university degree or are in undergraduate school. A low educational level is more frequent, while lack of a university degree is less frequent, in mothers of children in the OW+O group when compared to the control group. The statistical analysis of the data revealed a significant and inverse correlation (r = -0.239, p < 0.01) between maternal education and occurrence of overweight and obesity in children. This was not observed in paternal education. Table 4 - Mean daily sleeping hours, sitting hours and leisure
activities of normal, overweight and obese children (Brasília, DF)
Daily activities (hours) (x±dp)
Leisure Sitting Sleeping
Boys
Normal [47] 5.63±1.21 9.36±1.71 8.99±0.99
Overweight [27] 5.91±1.07 9.53±1.58 9.10±1.46
Obesity [6] 6.33±0.52 10.59±1.27 8.68±0.89
Girls
Normal [50] 5.64±1.13 9.32±1.78 9.27±1.12
Overweight [26] 5.65±1.30 9.36±1.78 9.37±1.35
Obesity [9] 6.40±0.93 10.03±1.29 8.60±0.65
General
Normal [97] 5.63±1.16 9.34±1.74* 9.14±1.06
Overweight [53] 5.78±1.19 9.45±1.66 9.23±1.40
Obesity [15] 6.37±0.77 10.25±1.27 8.63±0.73
[ ]: number of children;
(*) and (†): significant difference (p < 0.05).
Figure 1 - Dispersion graphic and linear regression between body fat percentage and the mean daily time spent sitting of overweight and obese children (Brasília, DF, Brazil).
Figure 2 - Dispersion graphic and linear regression between body fat percentage and mean number of hours of sleep of overweight and obese children (Brasília, DF, Brazil).
50
40
30
20
10
6 7 8 9 10 11 12 13 14
R = 0.28 p < 0.05
%
o
f
b
o
d
y
f
a
t
Daily sleeping hours
50
40
30
20
10
4 6 8 10 12 14
%
o
f
b
o
d
y
f
a
t
Daily sitting hours
R = 0.31 p = 0.05
Children
Normal Overweight/Obese
Father [91] [65]
E % %
1 5.5 9.2
2 7.4 27.7
3 57.1 63.1
Mother [97] [66]
E % %
1 2.1 7.6
2 35.1 43.9
3 62.9 48.5
Table 5 - Distribution of educational level of parents of overweight and obese children (Brasília, DF)
Weight and height were recorded by parents and confirmed by direct assessment during the interviews, showing good concordance between the values. Considerable differences were found on comparing the occurrence of overweight and obesity in parents of children in the control and OW+O groups (Table 6). Mean BMI is significantly higher in parents of children in the OW+O group comparatively to the parents of children in the control group (p < 0.01). The frequency of overweight and obesity also is remarkably higher in parents of children in the OW+O group comparatively to the parents of children in the control group. The frequency of overweight and obesity among the mothers of children in the control group was 22.73% while for mothers of children in the OW+O group it was 35.07%. The occurrence of overweight and obesity among the fathers of children in the control group was 48.19% whereas for fathers of children in the OW+O group it was 74.33% (p < 0.01). The frequency of overweight and obesity in children was 51.8% when both parents were obese, 50% when one of the parents was obese and 19.6% when none of the parents was obese. There was a strongly positive correlation between parental and child overweight and obesity (p < 0.001).
Children
Normal Overweight/
obese
Father [91] [64]
BMI (x±dp) 25.9±4.0 27.3±3.1
Nutritional status (%)*
Normal 49.5 25.0
Overweight 38.5 56.3
Obese 12.1 18.8
Mother [96] [67]
BMI (x±dp) 23.8±3.7 24.6±3.7
Nutritional status (%)*
Normal 74.0 65.7
Overweight 19.8 25.4
Obese 6.2 9.0
Table 6 - Body mass index and frequency of overweight and obesity in parents of normal and overweight/obese children (Brasília, DF)
[ ]: number of parents; BMI: body mass index; * Criteria of WHO1;
† and ‡: significant difference between the means and frequencies (p < 0.01).
Discussion and conclusions
The prevalence of overweight and obesity in school-aged children in our study corroborates the results obtained from other studies conducted in Brazil20 and in South America21 showing that childhood overweight and obesity should be addressed as a major public health problem. The PREVINE project, conducted by Universidade Católica de Brasília, has tested and implemented an annual assessment of school-aged children, from elementary to high school, using a printed card, and the BMI for age as a diagnostic tool.
The tendency towards a sedentary lifestyle shown in the present study, given the association between the amount of time children spend sitting and their body fat percentage, is in agreement with the findings of other authors9,10,suggesting that inactivity plays a major role in the development of childhood obesity. On the other hand, the fact that the number of hours of sleep observed in this study may favor a decrease in body fat shows that sleep may act positively towards maintaining body composition in children and should therefore be encouraged, especially in overweight and obesity ones. We have found no other reports in the literature on this issue. However, it should be underscored that correlations in both cases, albeit significant, were low, thus suggesting the need for further investigation, especially into the influence of sleep on energy balance in children, which could be regarded as preliminary results.
The familial characteristic of obesity is widely known22 given the concomitance between child and parental obesity. The importance of education, especially maternal education, is shown by the higher occurrence of overweight and obesity in students whose mothers had a lower educational level, which suggests that maternal education is a risk factor for childhood obesity.
The present study shows a high occurrence of overweight and obesity in middle-class and upper-middle class students in Brasília (DF), with rates greater than 20% for both sexes. The classification used, based on the international BMI for age standard, revealed good correlation with adiposity. Among the analyzed factors, the following could be considered to predispose to overweight and obesity in students: inactivity, fewer hours of sleep, lower level of maternal education and occurrence of overweight or obesity in one or both parents. It must be noted that the results of our study were obtained from a relatively small sample of middle-class and upper middle-middle-class students in Brasília, and should therefore be further investigated before they are extended to schoolchildren of other regions in Brazil.
Acknowledgments
We acknowledge the dedication and laboratory assistance from Vânia Pereira Nunes. We would also like to express our thanks to Prof. Eduardo da Silva Sena, The amount of daily physical activity of parents
References
1. World Health Organization. Obesity. Preventing and managing the global epidemic: Report of WHO consultation group on obesity. Geneva: WHO; 1997.
2. Brasil. Ministério da Saúde, Instituto Nacional de Alimentação e Nutrição. Pesquisa Nacional sobre Saúde e Nutrição. Condições nutricionais da população brasileira. Brasília: INAN; 1991. 3. Monteiro CA, Conde WL. Tendência secular da obesidade segundo
estratos sociais: nordeste e sudeste do Brasil. Arq Bras Endocrinol Metab. 1999;43:186-94.
4. Fisberg M. Obesidade na infância e adolescência. In: Fisberg M. editor. Obesidade na infância e adolescência. São Paulo (SP): Fundo Editorial BYK; 1995. p. 9-13.
5. Whitaker RC, Wright JA, Pepe MS, Seidel KD, Dietz WH. Predicting obesity in young adulthood from childhood and parental obesity. N Engl J Med. 1997;337:869-73.
6. Price RA. Genetics of human obesity. Ann Behav Med. 1987; 9:9-14.
7. Cutting MT, Fisher OJ, Thomas GK, Birch L. Like mother, like daughter: familial patterns of overweight are mediated by mothers dietary disinhibition. Am J Clin Nutr. 1999;69:608-13. 8. Duda JL, Hom HL. Interdependencies between the perceived and self-reported goal orientations of young athletes and their parents. Pediatr Exerc Sci. 1993;5:234-41.
9. Ma GS, Li YP, Hu XQ, Ma WJ, Wu J. Effect of television viewing on pediatric obesity. Biomed Environ Sci. 2002;15:291-7. 10. Pimenta APA, Palma A. Perfil epidemiológico da obesidade em
crianças: relação entre televisão, atividade física e obesidade. Rev Bras Ciência Movimento. 2001;9:19-24.
11. Rippe JM, Hess S. The role of physical activity in the prevention and management of obesity. J Am Diet Assoc. 1998;4:31-8. 12. Instituto Nacional de Estudos e Pesquisas Educacionais Anisio
Teixeira. Ministério da Educação. Censo Escolar 2000 [site na internet]. Sinopse Estatística da Educação Básica - Ano 2002 [citado 2 de setembro de 2003] Disponível em: http:// w w w . i n e p . g o v . b r / b a s i c a / c e n s o / E s c o l a r / S i n o p s e / sinopse_2002.htm.
Corresponding author: Rodolfo Giugliano
Universidade Católica de Brasília UCB Laboratório de Avaliação Nutricional LAN Prédio São Gaspar Bertoni [bloco M] sala 121 QS 07 Lote 1 Águas Claras
CEP 71966 700 Taguatinga, DF, Brazil Tel.: +55 (61) 356.9338
Fax: +55 (61) 356.3010
13. Lhoman TG, Roche AF, Martorell R. Anthropometric Standardization Reference Manual, Champaign (IL): Human Kinetics Books; 1988.
14. Slaughter MH, Lohman TG, Boileau RA, Horswill CA, Stillman RJ, Van Loan MD, et al. Skinfold equations for estimation of body fatness in children and youth. Hum Biol. 1988;60:709-23. 15. Cole TJ, Bellizzi MC, Flegal KM, Dietz WH. Establishing a
standard definition for child overweight and obesity worldwide: international survey. BMJ. 2000;320:1240-3.
16. Hammer LD, Kraemer HC, Wilson DM, Ritter PL, Dornbusch SM. Standardized percentile curves of body-mass index for children and adolescents. Am J Dis Child. 1991;145:259-63.
17. Ross RM, Jackson AS. Exercise concepts, calculations and computer applications.Carmel (IN): Brown & Benchmark Pub; 1990.
18. Sallis JF, Buono MJ, Roby JJ, Micale FG, Nelson JA. Seven-day recall and other physical activity self-reports in children and adolescents. Med Sci Sports Exerc. 1993;25:99-108. 19. Heyward VH, Stolarczyk LM. Applied Body Composition
Assessment. Champaign (IL): Human Kinetics; 1996.
20. Neutzling MB, Taddei JA, Rodrigues, EM, Sigulem DM. Overweight and obesity in Brazilian adolescents. Int J Obes Relat Metab Disord. 2000;24:869-74.
21. Agrelo F, Lobo B, Bazán M, Mas LB, Lozada C, Jazán G, et al. Prevalencia de delgadez y gordura excessiva en um grupo de escolares de la ciudad de Córdoba, Argentina. Arch Latino Am
Nutr. 1988;38:69-80.
22. Margarey AM, Daniels LA, Boulton TJ, Cockington RA. Predicting obesity in early adulthood from childhood and parenteral obesity. Int J Obes Relat Metab Disord. 2003;27:505-13.